 Hou Linna
 Bai Yi
 Su Juning
- School of Economics and Management, Xi’an University of Technology, Xi’an, Shaanxi, China
The proposal of the dual carbon policy has put forward new requirements for the planning of wind power photovoltaic energy storage, which should not only meet economic requirements but also consider the timeliness of carbon reduction. Particularly, in recent years, there has been a contradiction between energy waste and power shortage in some regions of China, which needs to be resolved through reasonable planning of the capacity of multi energy systems. Based on the aforementioned background, this paper uses system dynamics simulation to analyze the efforts that should be made to maintain a stable energy balance between wind–solar power generation output and energy storage capacity when considering the cost of the power side and the demand response level of the load side. We assume a development plan for wind and solar energy, and optimize the allocation of energy storage capacity under these conditions to meet the balance requirements of carbon reduction and investment cost reduction. We use system dynamics simulation to simulate the energy storage demand under the demand response. In order to achieve the near-zero carbon goal, this paper discusses the reasonable state of a power energy structure based on different carbon emission reduction goals. Finally, we discovered the relationship between investment costs and carbon reduction targets as increasing carbon reduction targets will greatly increase investment costs and provide some suggestions for planning.
1 Introduction
In order to meet global challenges and achieve sustainable development, China proposes to build an energy system with deep decarbonization and strives to achieve a carbon peak by 2030 and carbon neutrality by 2060 (He et al., 2020). According to statistics, at present, China’s coal consumption accounts for approximately 57% of the total energy consumption. As the industry with the largest proportion of coal consumption and carbon emissions, the proportion of emissions from the power industry has exceeded 40% (Hepburn et al., 2021). How to promote carbon emission reduction in the power industry has become the key to achieve the “Goal 3060.”
The development of clean electricity is a critical path for low-carbon energy transformation. The vigorous development of wind power and PV power has not only brought remarkable results but also led to grid instability and the waste of wind and solar energy. Meanwhile, the changes in the international environment and the frequent occurrence of extreme cold and hot climate have induced a sharp increase in the demand for electricity in the past 2 years. In some areas in the southern and northeastern parts of China, the power supply is tight, so some industries and residents were forced to restrict their electricity use, resulting in large-scale and long-term power outages.
The reason for power outages is that the supply cannot meet the demand, but further analysis reveals that there is still a waste of power supply. This paradox phenomenon has also appeared more and more continually in recent years, especially during summer and winter. This raises a series of questions: Can a high proportion of clean energy solve the balance between power supply and demand? How much impact does it have on carbon emission reduction of a power system? In what ways do we need to support their development? Quantitative research on these studies can effectively solve the problem of energy transformation under the requirements of upgrading carbon emission goals.
The current research on energy transition mainly uses optimization methods, system simulation, and so on. These studies demonstrate the effect of random fluctuations in new energy on system operations by constructing multi-energy systems, discuss the economics brought by capacity allocation, and design scheduling schemes (Bukar et al., 2019; Dong et al., 2022; Kim et al., 2022; Wang et al., 2023). Some literature studies discuss the power balance under the introduction of green certificates and demand response, and propose to utilize energy prices and income distribution to promote the collaboration of both the generator side and load side (Yang et al., 2020). In view of the carbon emission reduction goals, some studies consider how to help formulate action plans for carbon peak and carbon neutrality goals by calculating the binding indicators and other methods (Yan et al., 2019), or look forward to dynamic optimization pathways from multiple perspectives such as “fast before slow” and “slow before fast” (Shu et al., 2021). Some literature studies analyze the development of carbon reduction technologies and costs (Misconel et al., 2022), and explore electricity pricing mechanisms, cross subsidies for electricity, demand elasticity, and social welfare levels (Li et al., 2023). These studies indicate that the development of clean energy should concentrate on the synergistic effect of multiple factors.
The construction focus of a multi-energy system is the integration of “wind–solar-thermal-storage,” including a flexible adjustment on the power side and the design on the scale of various power supplies. However, due to a large fluctuation in the peak-valley generation caused by wind power and solar power, power supply and demand are difficult to match and the abandonment of wind and solar energy occurs frequently. At present, the development of energy storage has become the key to solve this problem, and the development scale of energy storage largely determines the waste level of wind and solar energy (Lu, 2023). Therefore, in the case of different proportions of clean electricity, it is a crucial issue on how to develop clean power and match the corresponding installed capacity of energy storage.
Integration also requires full play to load regulation capabilities, but there are still a series of obstacles, such as a small response scale, low response willingness, and imperfect compensation mechanisms (Xu et al., 2021). Currently, some research studies focus on demand response business models in different market environments (Ding et al., 2017), incentive and subsidy mechanisms (Alasseri et al., 2020), and demand response packages for different user types (Hou et al., 2018). However, few studies have refined the user response behavior, especially analyzing the impact of differences in user response levels. Ignoring the gap between user awareness and behavior can lead to significant deviations between predicted and actual electricity demand.
These studies usually use optimization algorithms to design system planning from a micro perspective, but there are few analyses of the impact of optimization results on long-term carbon reduction effects. Therefore, it is difficult to evaluate the impact of optimization schemes on the achievement of dual carbon goals from a macro perspective. The system dynamics method is a mature method to analyze the long-term macro system through computer simulation. However, in the existing research using this method, the uncertainty of the generation side is considered more than the uncertainty of the demand response, and this uncertainty of the demand side has a great impact on the system supply and demand balance and optimization results.
In this article, we focus on both system cost and carbon emission reduction, and plan system capacity under the requirement of dual goals, which is different from previous studies that focus more on single goals. Second, not only the uncertainty of power supply but also the uncertainty of the demand response is considered in the system constraints. Under the condition of double uncertainty of supply and demand, the design and planning scheme is more realistic.
2 Research design
2.1 Regional energy system analysis
The regional energy system involves four subsystems:
1) Clean power supply subsystem
This subsystem mainly analyzes the supply of wind power, PV, and thermal power to meet the regional power demand. Considering the resource endowment, we study the relative relationship between the installed capacity of clean electricity and energy storage capacity in a region. The different capacity proportions of wind, PV, and energy storage will change the total supply, which will have a direct effect on the investment and operation costs and carbon emissions.
2) Demand response subsystem
This subsystem describes the different behaviors of two types of users in response to power demand. The two types are called as transferable users and interruptible users, and each type of users includes two levels: level 1 and level 2. We assume that level 1 users respond randomly, considering the peak-valley electricity prices, and level 2 users do not respond. When the electricity supply is less than the demand, level 1 users will optimize their power consumption behavior, interruptible users reduce power consumption during peak hours, and transferable users shift more load from peak hours to valley hours so that it can play the role of peak shaving and valley filling.
3) Clean power consumption subsystem
In this subsystem, when the demand response is required, the interruptible demand response is prioritized, followed by the transferable demand response. After the user responds, clean electricity is supplied. If the clean power supply is insufficient, storage energy is utilized, and if it still cannot meet the demand, thermal power is used as a supplement. Thermal power should be reduced as much as possible to cut down carbon emissions. One thing to note is that energy storage comes from clean power.
4) Carbon emission subsystem
This subsystem considers the cost of environmental governance, and in addition, its factors also include thermal power consumption and carbon emissions. Thermal power consumption is influenced by electricity demand after demand response and clean power consumption. The more clean energy, the less carbon is emitted.
According to the analysis of four subsystems, the causal relationship is established for the whole system including a clean power supply subsystem, demand response subsystem, clean power consumption subsystem, and carbon emission subsystem, as shown in Figure 1.
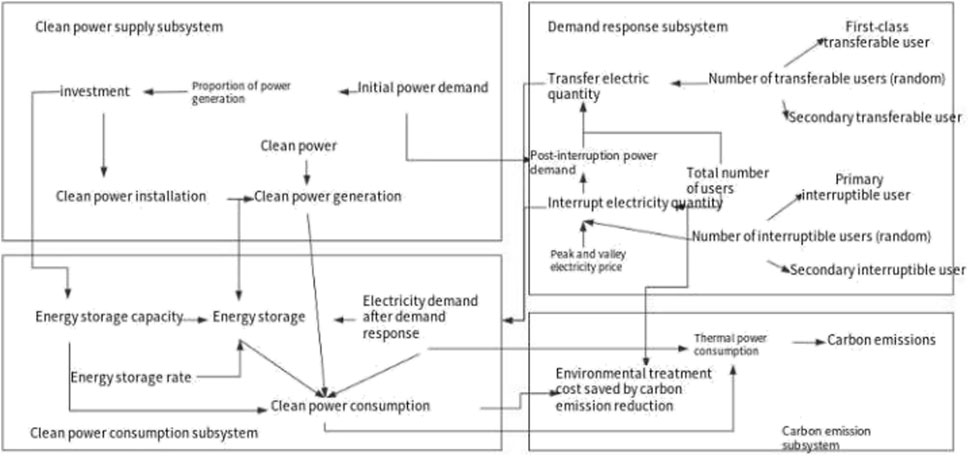
FIGURE 1. Causality loop diagram.
2.2 System flowchart and the main equation
The system flowchart is shown in Figure 2. The system includes 35 variables, including 1 level variable, 2 rate variables, 29 auxiliary variables, and 3 constants.

FIGURE 2. System flowchart.
The main equations in the model are as follows:
1)Clean power supply subsystem
The daily power generation is based on the hourly power generation data (Wang et al., 2019), which is expressed in the form of a table function. We assume that the installed capacity of both wind power and PV can meet 90% of the regional power demand. The levelized cost of wind power and PV is calculated at 0.375 yuan/kWh (5.4 US cent/kWh).
2) Demand response subsystem
Taking demand interruption as an example, when power supply is inadequate, a part of the users respond to the need to actually reduce electricity consumption. In this study, we assume that the interrupted users are those who are interrupted during peak hours, so it meets the following requirement:
The same is true for demand transfer. When a demand response is required, users may transfer electricity. Assuming that the response probability is a random uniform distribution, the sum of transferred electricity in each period is evenly distributed during the valley-price period. We assume that the number of transferred users is equal to the number of transferred users during peak hours, so it meets the following:
3) Clean power consumption subsystem
When storing unconsumed electricity, it is necessary to consider whether the energy storage capacity is good enough. The amount of abandoned wind and solar energy is the electricity that has not been consumed and stored in time.
4) Carbon emission subsystem
Saving electricity or using clean electricity is equivalent to reducing the environmental cost, which is assumed as 44 yuan/ton (Liu et al., 2023).
2.3 Regional selection
We select a region as the research object which is rich in wind and solar resources. This region has the potential to move from the current power supply to a high proportion of clean power, which is in line with the requirements of near-zero carbon. The simulation results in this region can be used as a reference in other regions with similar resource endowments so as to promote the national carbon peak and carbon neutralization.
3 Analysis of simulation results
3.1 Basic assumptions
In this paper, the system dynamics software Vensim PLE 6.0 is used for simulation. The model simulates 24 h at a time in 1 h steps. The first simulation season is summer, the proportion of clean electricity is set according to the requirements of near-zero carbon, and the ratio of the wind and PV output is 1:1 in that time. Later, the model is checked according to the winter data and other ratios of wind and PV in order to reflect the operation of the system accurately.
Considering that the simulation time is 24 h, the model mainly makes the following assumptions:
1) It is assumed that the selected area is rich in new energy resources, which can meet the requirements of near-zero carbon.
2) There is no major economic and demand fluctuations during the simulation time.
3) The carbon emission result is measured by the thermal power generation.
4) Demand response is random.
3.2 Simulation results
Assuming that wind power and PV generation account for 90% of the total power generation, we assess the conditions of energy storage and the demand response to achieve the near-zero carbon goal.
1) Comparison of two scenarios
When the installed capacity ratio of wind power and PV is 1:1, we compare the results in two scenarios.
Scenario 1: Not considering energy storage and demand response.
Scenario 2: Considering energy storage and demand response, the demand response ratio (DRR) is a random distribution with RANDOM UNIFORM (0.3, 0.5, and 0.4).
The simulation results are shown in Figures 3, 4.
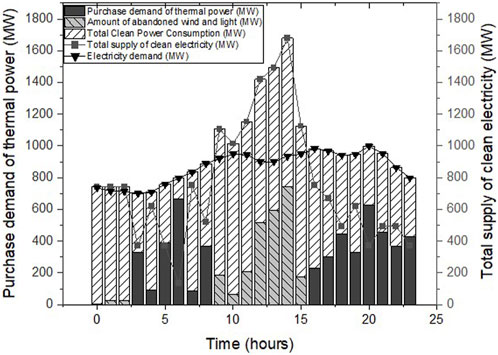
FIGURE 3. Simulation results of Scenario 1.
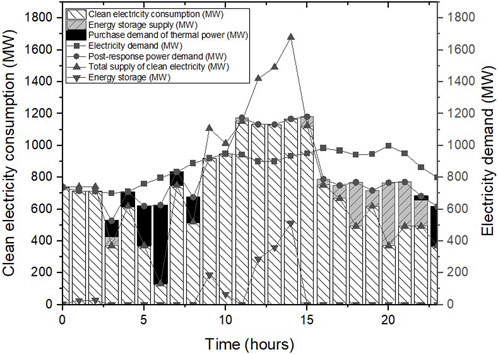
FIGURE 4. Simulation results of Scenario 2.
Under the influence of wind and PV output characteristics in Scenario 1, there are clear differences between the power supply curve and the demand curve. The power supply exceeds the demand between 9:00 and 15:00, and wind and solar energy are abandoned, leading to wind power curtailment of approximately 255 million kWh. However, at other times, the supply of clean electricity is not enough, so thermal power generation is required. In the simulation, the thermal power generation is approximately 511 million kWh. Based on the emission of 0.86 Kg per kWh, the annual CO2 emission is approximately 44,011 tons. Therefore, in Scenario 1, it is unable to effectively meet the requirements of near-zero carbon.
In Scenario 2, the demand curve is closer to the clean power supply curve because even if there is imbalance, energy storage can adjust the energy demand and supply by charging and discharging the battery. It stores the electrical energy from 11:00 to 15:00 and provides it from 18:00 to 22:00 (Figure 4), so there is no waste of wind and solar energy. At the same time, the demand for thermal power is also greatly reduced from 511 million kWh in Scenario 1 to 144 million kWh. Then, CO2 emission is approximately 12,409 tons per year, which is 71.80% less than that without energy storage and demand response.
Consequently, we should encourage the demand response and the application of energy storage, which will significantly reduce carbon emissions. However, the demand response and energy storage application are mutually affected by each other. Only by matching the transferred load to the installed capacity of energy storage can we achieve the goal of near-zero carbon at a lower construction cost of energy storage. Therefore, we then analyze the minimum installed capacity of energy storage under two conditions of low and high probability of the demand response.
2) Impact of demand response probability on the energy storage capacity
The change of the energy storage capacity is shown in Figure 5 when the response probability follows RANDOM UNIFORM (0.3, 0.5, and 0.4) and RANDOM UNIFORM (0.5, 0.7, and 0.6).
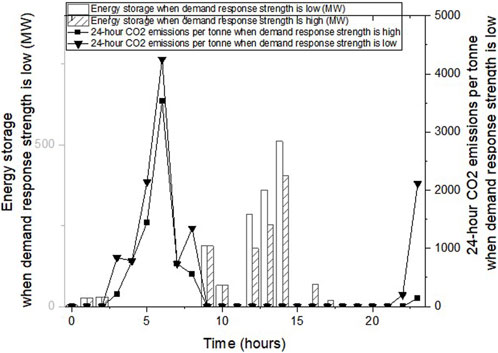
FIGURE 5. Comparison of the energy storage capacity under two conditions.
When the user’s demand response probability is high, the difference between power supply and demand is smaller than low probability, and the power demand curve is closer to the clean power supply curve. At this time, it can be seen that the demand for the energy storage capacity is centralized and uneven at various times. When the response probability is low, the system needs to store energy for 1.87 million kWh, 0.66 million kWh, 0, 2.86 million kWh, 3.59 million kWh, and 5.55 million kWh from 9:00 to 14:00 accordingly. According to the turnover rate of the storage capacity, the installed capacity of the energy storage shall be at least 2.5 million kW if surplus electricity in the afternoon is to be stored. However, most of the hours have little demand for energy storage and the total energy storage is 14 million kW in 24 h, resulting in a great waste of energy storage resources and expensive cost. When the probability of the demand response is high, the system needs to store energy for 1.87 million kWh, 0.66 million kWh, 0, 1.80 million kWh, 2.53 million kWh, and 4.05 million kWh from 9:00 to 14:00; the installed capacity of energy storage shall be at least 2 million kW.
Figure 5 shows that under the two demand response conditions, the thermal power generation is also different, that is, the difference in carbon emissions is obvious. Therefore, the demand response has played a significant role in carbon emission and energy storage investment. Consequently, the stability of the demand response should be maintained, and the response probability should be improved through various policies.
3) Optimal installed capacity of energy storage
Under the condition of a high proportion of clean energy, the installed capacity of energy storage is simulated based on the five ratios of wind/PV for 3:7, 4:6, 5:5, 6:4, and 7:3 in summer and winter. According to simulation results, the investment cost of wind-PV storage is calculated, and the proportion of wind-PV storage with the lowest cost is selected.
Figure 6 shows the demand for energy storage in summer is generally more than that in winter. Further analysis shows that the change of the investment cost is different in two seasons. In summer, the investment cost gradually decreases with the increase of the ratio of wind/PV, while in winter, the investment cost slowly decreases first and then rises. The investment cost involves wind power generation, PV power generation, and storage energy, and the investment of energy storage is affected by the installed capacity of wind power and PV power. The PV power in summer is higher than that in winter, and more PV power is stored during that season; however, the energy storage demand of wind power in winter is large, so we should balance the impact of seasonal differences. Considering the minimum investment cost, it is 38.931 billion yuan in summer and 34.933 billion yuan in winter. At that time, the ratio is 7:3 and 4:6, respectively. We also noticed that carbon emission is not the lowest at the ratio of 4:6 in winter, and on the contrary, when carbon emission is the lowest, the ratio should be 7:3. Based on comprehensive consideration, the installed capacity ratio of wind/PV should be 7:3 for carbon emission reduction.
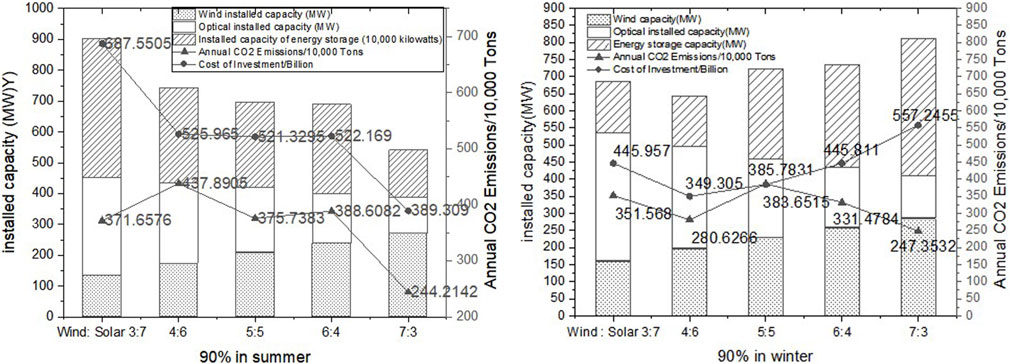
FIGURE 6. Comparison of investment costs and carbon emissions under different ratios in summer and winter.
The aforementioned research is based on the goal of near-zero carbon, but at present, many regions cannot meet the requirement. Therefore, we discussed scenarios where clean energy power generation accounts for 70% and 50%, and the investment and carbon emission simulation are carried out, as shown in Table 1.
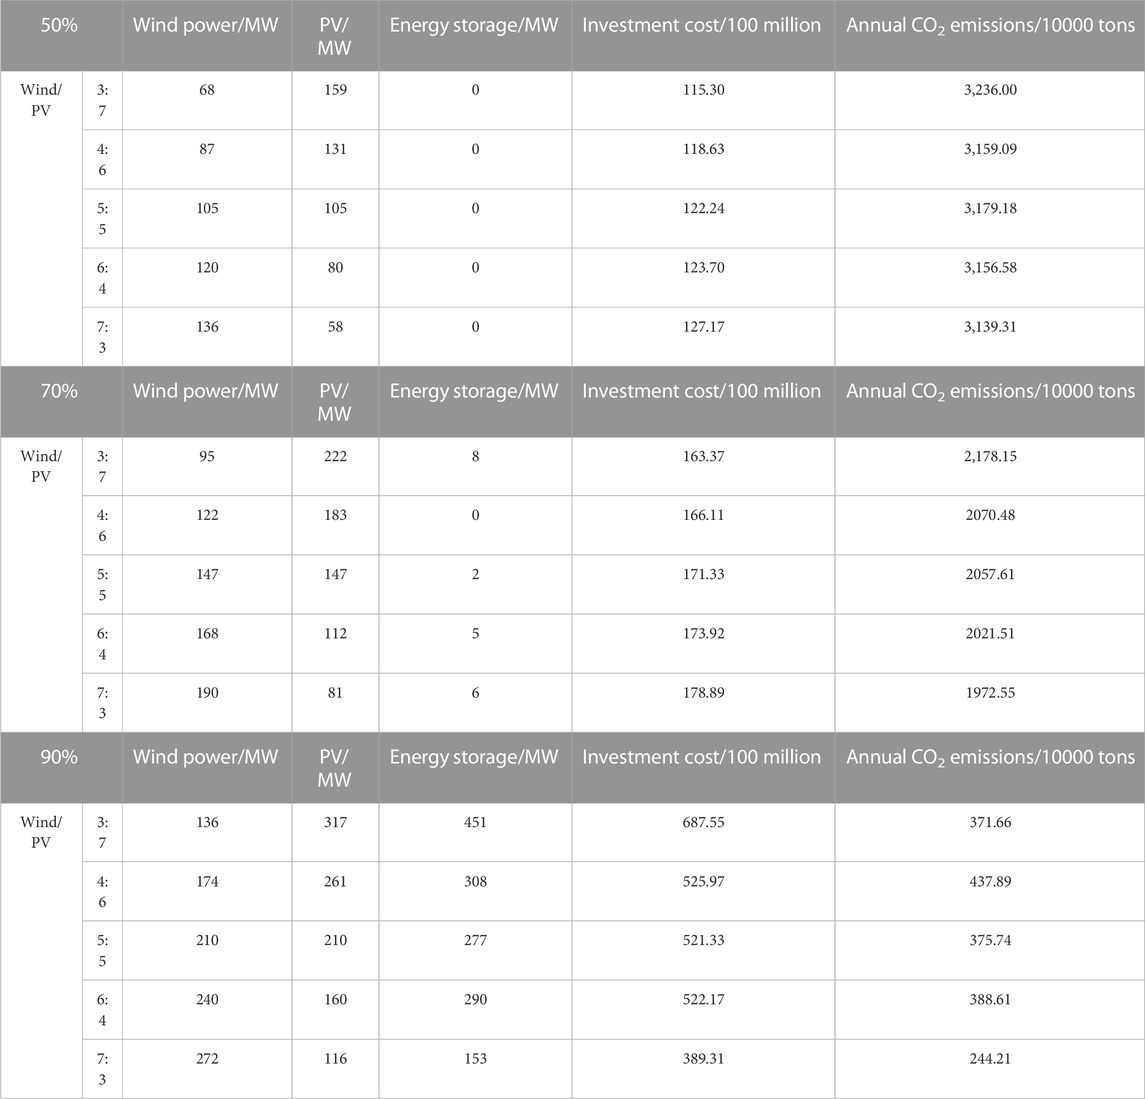
TABLE 1. Installed capacity and investment cost in different ratios of wind-PV storage in summer.
Huge investments are needed to promote carbon emission reduction, as shown in Table 1. The lowest investment cost is 11.53 billion yuan with 50% of clean electricity, while the lowest investment cost is 16.337 billion yuan with 70% of clean electricity. The investment has increased by 41.63%, and carbon emission has decreased by 32.7%, from 32.36 million tons per year to 21.7815 million tons per year. However, in order to reduce carbon emissions to 3.7166 million tons per year, the investment will increase sharply from 11.53 billion yuan to 68.755 billion yuan with a growth rate of 496.31%. Therefore, it is necessary to clarify the carbon emission target and evaluate the relationship between this target and the investment cost. Although a large amount of clean energy power generation can significantly reduce carbon emissions, but due to the high investment cost, especially the huge investment in energy storage, it will put forward very high requirements for the cost of achieving the goal. Consequently, it is very important to reduce the cost of power generation and energy storage through technical means, and it is particularly necessary not to blindly set the proportion of wind-PV storage.
4 Conclusion
This article designs the energy storage capacity based on the cost to satisfy the requirements of minimizing carbon emissions during system operation. It supplements the optimization research under dual objectives and provides support for solving the carbon goal and investment planning.
Aiming to explore the rational capacity configuration of wind-PV storage, we construct a system dynamics model of carbon emission with large-scale clean power generation. Under the dual-carbon goal, we simulate and analyze the factors of carbon emission reduction and obtain the following conclusion and suggestions.
The large-scale development of clean electricity requires energy storage and user response to provide assistance. When facing the requirements of carbon emission reduction, it is necessary to clarify the matching relationship between the proportion of wind and PV power, as well as the required capacity of energy storage devices. Carbon emission targets affecting the simulation results, investment cost of clean energy, and energy storage must all be taken into account to achieve the near-zero carbon target because we need to invest more that is not proportional to the carbon emission reduction. Therefore, when planning and designing the system, we should consider whether to adopt a one-step investment to meet the zero-carbon emission objective rapidly or utilize a step-by-step investment to lessen carbon emissions gradually.
The investment cost is one of the key points to be considered for the large-scale development of clean power and energy storage. We should try to cut down the cost resulting from increasing the supply of clean power and the scale of energy storage. A demand response can promote the consumption of clean electricity, and we can further study user psychology, effectively utilize the hierarchical response, and make corresponding policies for different levels of users. Hence, we can fulfill the achievement of the dual-carbon goal.
The further study of this paper aims to explore the impact of investment on electricity price, including the investment scale and structure, and consider the real-time electricity price in the demand response, rather than just peak and valley prices. In addition, the system dynamics method used in this article can also be applied to the risk assessment, efficiency assessment (Hu et al., 2021; Hu et al., 2022), and energy subsidy policy research on industrial systems (Wei and Niu, 2023).
Data availability statement
The original contributions presented in the study are included in the article/Supplementary Material; further inquiries can be directed to the corresponding author.
Author contributions
All authors listed have made a substantial, direct, and intellectual contribution to the work and approved it for publication.
Funding
This research is supported by the National Social Science Foundation of China (20BGL018).
Conflict of interest
The authors declare that the research was conducted in the absence of any commercial or financial relationships that could be construed as a potential conflict of interest.
Publisher’s note
All claims expressed in this article are solely those of the authors and do not necessarily represent those of their affiliated organizations, or those of the publisher, the editors, and the reviewers. Any product that may be evaluated in this article, or claim that may be made by its manufacturer, is not guaranteed or endorsed by the publisher.
References
Alasseri, R., Rao, T. J., and Sreekanth, K. J. (2020). Institution of incentive-based demand response programs and prospective policy assessments for a subsidized electricity market. Renew. Sustain. Energy Rev. 117, 109490. doi:10.1016/j.rser.2019.109490
Bukar, A., Tan, C., and Lau, K. (2019). Optimal sizing of an autonomous photovoltaic/wind/battery/diesel generator microgrid using grasshopper optimization algorithm. Sol. Energy 188, 685–696. doi:10.1016/j.solener.2019.06.050
Ding, Y., Hui, H., Lin, Z., Zheng, M., Xinyao, Q., and Cui, W. (2017). Design of business model and market framework oriented to active demand response of power demand side. Automation Electr. Power Syst. 41 (14), 2–9. doi:10.7500/AEPS20170218001
Dong, J., Dou, Z., Si, S., Wang, Z., and Liu, L. (2022). Optimization of capacity configuration of wind–solar–diesel–storage using improved sparrow search algorithm. J. Electr. Eng. Technol. 17, 1–14. doi:10.1007/s42835-021-00840-3
He, J., Li, Z., Zhang, X., Wang, H., Dong, W., Chang, S., et al. (2020). Comprehensive report on China's long-term low-carbon development strategies and pathways. Chin. J. Popul. Resour. Environ. 18 (4), 263–295. doi:10.1016/j.cjpre.2021.04.004
Hepburn, C., Qi, Y., Stern, N., Ward, B., Xie, C., and Zenghelis, D. (2021). Towards carbon neutrality and China's 14th Five-Year Plan: Clean energy transition, sustainable urban development, and investment priorities. Environ. Sci. Ecotechnology 8, 100130. doi:10.1016/j.ese.2021.100130
Hou, J., Lin, Z., Yang, L., Ding, Y., and Yang, B. (2018). Design of electricity plans for industrial and commercial customers oriented to active demand response on power demand side. Automation Electr. Power Syst. 42 (24), 11–19. doi:10.7500/AEPS20180404002
Hu, X., Zhang, H., Ma, D., and Wang, R. (2021). A tnGAN-based leak detection method for pipeline network considering incomplete sensor data. IEEE Trans. Instrum. Meas. 70, 1–10. doi:10.1109/TIM.2020.3045843
Hu, X., Zhang, H., Ma, D., Wang, R., and Tu, P. (2022). Small leak location for intelligent pipeline system via action-dependent heuristic dynamic programming. IEEE Trans. Industrial Electron. 69 (11), 11723–11732. doi:10.1109/TIE.2021.3127016
Kim, I., Kim, B., and Sidorov, D. (2022). Machine learning for energy systems optimization. Energies 15 (11), 4116. doi:10.3390/en15114116
Li, Y., Jiang, Y., and Dong, C. (2023). Electricity cross-subsidies in China: Social equity, reverse Ramsey pricing, and welfare analysis. Econ. Analysis Policy 77, 403–417. doi:10.1016/j.eap.2022.12.002
Liu, C., Tang, X., and Wu, L. (2023). A decision-making model for emission trading based on ABM. Third Int. Conf. Comput. Vis. Data Min. (ICCVDM 2022) 12511, 74–86. doi:10.1117/12.2660141
Lu, Z. (2023). Experimental analysis of one micro-compressed air energy storage-power generation system with different working fluids. J. Energy Storage 60, 106647. doi:10.1016/j.est.2023.106647
Misconel, S., Prina, M. G., Hobbie, H., Möst, D., and Sparber, W. (2022). Model-based step-wise marginal CO2 abatement cost curves to determine least-cost decarbonization pathways for sector-coupled energy systems. J. Clean. Prod. 368, 133173. doi:10.1016/j.jclepro.2022.133173
Shu, Y., Zhang, L., Zhang, Y., Wang, Y., Lu, G., Yuan, B., et al. (2021). Carbon peak and carbon neutrality path for China’s power industry. Strategic Study Chin. Acad. Eng. 23 (6), 1–14. doi:10.15302/J-SSCAE-2021.06.001
Wang, J., Wei, J., Zhu, Y., and Wang, X. (2019). The reliability and operation test system of power grid with large-scale renewable integration. CSEE J. power energy Syst. 6 (3), 704–711. doi:10.17775/CSEEJPES.2017.01300
Wang, R., Li, J., Sun, Q., and Wang, P. (2023). Current edge-control strategy for multiple energy routers based on cyber-energy dual modulations. IEEE Trans. Industrial Electron. 2023, 1–10. doi:10.1109/TIE.2023.3277085
Wei, J., and Niu, C. (2023). How does institutional support affect the coalbed methane industry? Front. Energy Res. 10, 1–10. doi:10.3389/fenrg.2022.1087984
Xu, X., Li, K., Wang, F., Mi, Z., Jia, Y., Wei, W., et al. (2021). Evaluating multitimescale response capability of EV aggregator considering users’ willingness. IEEE Trans. Industry Appl. 57 (4), 3366–3376. doi:10.1109/TIA.2021.3081402
Yan, Q., Wang, Y., Li, Z., Baležentis, T., and Streimikiene, D. (2019). Coordinated development of thermal power generation in beijing–tianjin–hebei region: Evidence from decomposition and scenario analysis for carbon dioxide emission. J. Clean. Prod. 232, 1402–1417. doi:10.1016/j.jclepro.2019.05.256
Keywords: multi-energy system, wind-PV-thermal storage, near-zero carbon emission, system dynamics simulation, regional energy, path planning, energy transformation
Citation: Linna H, Yi B and Juning S (2023) Process simulation on the planning of wind-PV storage for near-zero carbon emission. Front. Energy Res. 11:1217279. doi: 10.3389/fenrg.2023.1217279
Received: 05 May 2023; Accepted: 16 June 2023;
Published: 03 July 2023.
Edited by:
Rui Wang, Northeastern University, ChinaCopyright © 2023 Linna, Yi and Juning. This is an open-access article distributed under the terms of the Creative Commons Attribution License (CC BY). The use, distribution or reproduction in other forums is permitted, provided the original author(s) and the copyright owner(s) are credited and that the original publication in this journal is cited, in accordance with accepted academic practice. No use, distribution or reproduction is permitted which does not comply with these terms.
*Correspondence: Hou Linna, aG91bGlubmFpZUAxNjMuY29t