 Juan Zuo
 Chongxin Xu1
- 1State Grid Shanghai Energy Interconnection Research Institute Co., Ltd, Shanghai, China
- 2School of Electronic Information and Electrical Engineering, Shanghai Jiao Tong University, Shanghai, China
A virtual power plant (VPP) is an effective way to manage distributed energy resources. Virtual power plant cluster (VPPC) is constructed due to the increasing number of VPPs. It has great potential in carbon emission reduction through coordination between VPPs. Therefore, a dynamic dispatch priority model is proposed. The model adjusts the dispatch sequence of VPPs based on carbon emissions. The higher the carbon emissions, the lower the dispatch priority. The VPPC participates in carbon trading and the carbon trading cost is included in the optimization objective. There are still many uncontrolled distributed energy resources, e.g., wind power, out of the VPPC. The distributionally robust optimal method is used to deal with the uncertainty of wind power. Finally, this paper proposes a two-stage distributionally robust optimal model of VPPC considering carbon emission-based dynamic dispatch priority. This model can be solved by the column-and-constraint generation (C&CG) algorithm. A VPPC with four VPPs is used in case studies, which verify the economic benefit and low carbon of the proposed model.
1 Introduction
With the emission of carbon dioxide, the greenhouse effect has severely affected sustainable social development. It is significant to study emission reduction in power systems, which are regarded as the main source of carbon emissions (Kang et al., 2015). To reduce carbon emissions, there are many distributed energy resources connected to the power grid, and they can be integrated into a VPP and participate in dispatch as a single entity (Zhao et al., 2020). Zhang et al. (2021) propose a dynamic clustering algorithm that allocates energy storage systems to different virtual power plants to reduce load losses. In Wang et al. (2021), network reconfiguration is considered in the aggregation approach to reduce the fluctuations of voltages and power.
These distributed energy sources include wind power, PV, gas turbines, energy storage devices, electric vehicles, and dispatchable loads. Different combinations can serve different purposes. In Luo et al. (2020), a bi-level dispatch model of VPP which consists of energy storage devices and dispatchable loads is constructed for the target of load peak shaving and valley filling. Yu et al. (2022) study the energy management of a VPP considering the comfort of the flexible load users. The impacts of energy storage devices on a VPP are analyzed by Bagchi et al. (2019). Yang et al. (2020) integrate electric vehicles into a VPP to participate in the power market and analyze the function of electric vehicles. In Zhang and Hu (2022), the VPP which includes a power network, natural gas network, and power-to-gas device participates in power and gas energy markets with the aim to maximize profit.
Meanwhile, distributed energy resources produce uncertainty in the power grid, and the VPP is a new way to cope with it. A distributed two-stage economic dispatch model for VPP is proposed to decrease the impact of uncertainties (Zheng et al., 2021). There are many optimization methods to handle uncertainties. The information gap decision theory is used to achieve the minimization of operating costs and carbon emissions (Ren et al., 2023). Omelčenko, (2021) use the methods of machine learning. In Guo et al. (2021), the dynamic capacity optimization strategy is formed by the risk measurement theory. Considering the uncertainty of wind power and market prices, the strategic offering problem of a VPP is formulated as a stochastic adaptive robust optimization model (Baringo and Baringo, 2017). In Dabbagh and Sheikh-El-Eslami (2016), a two-stage stochastic programming approach is adopted for VPP trading. Babaei et al. (2019) adopt a distributionally robust optimization method that utilizes moment information of random parameters. The distributionally robust optimization deals with uncertainties by finding the worst-case probability distribution and obtaining the optimal decision plan. It avoids assuming a specific uncertainty distribution and makes the best use of limited statistical data to yield less-conservative results, but it has rarely been applied in VPP optimization. Therefore, there is important research value in introducing the distributionally robust optimization into VPP optimization.
On the generation side, carbon capture and carbon trading have become important ways of emission reduction. Reddy K et al. (2017) model the carbon capture systems in a carbon-constrained environment. In Akbari-Dibavar et al. (2021), carbon capture systems are combined with coal power plants to decrease carbon emissions. The carbon capture plant provides a spinning reserve depending on the potential flexibility (Lou et al., 2015). Zhang et al. (2016) study how the generation schedule is influenced by the carbon trading mechanism. Priority rules are often used for many load-shedding strategies. Laghari et al. (2015) present under-frequency load-shedding strategies based on the priority of loads. A user-determined priority schedule for load shedding is proposed by Adamiak et al. (2014), but few researchers consider a dispatch priority on the generation side. The above papers provide references for priority rules to achieve carbon reduction.
VPPC is formed as the number of VPPs increase. Therefore, investigating the optimization operation of VPPC is an urgent demand. The VPPC pays close attention to its entire economic cost and profits, and it can realize economic dispatch among DGs that belong to different owners. A virtual cluster control is proposed to achieve coordination operation and local autonomy of VPPs (Liu et al., 2019). There is also a conflict of interest between the VPPC and the distribution network. It is necessary to separately consider the economic objectives of the VPPC and operational constraints of the distribution network when formulating the optimal operation strategy. Yi et al. (2020) propose a bi-level model for the active distribution network with multiple VPPs to enhance the security and economic performance of the system. To reduce the peak-valley difference of net load, active distribution networks with VPPs join the energy-reserve market indicating the validation in shaping the load profile and realizing the economical operation (Zhang et al., 2023).
Most existing research focuses on the optimization operation of a single VPP. Few researchers consider the VPPC a study object; however, it has great potential in carbon emission reduction. Therefore, a distributionally robust optimal model of VPPC considering carbon emission-based dynamic dispatch priority is proposed. The dynamic dispatch priority is constructed to adjust the dispatch sequence of VPPs based on the carbon emissions. The higher the carbon emissions, the lower the dispatch priority. The uncertainty of wind power is considered with the method of distributionally robust optimization. This model is dispatched in the day-ahead stage and intra-day stage. It can be solved by the C&CG algorithm. A VPPC with four VPPs is used in case studies, which verify the economic benefit and low carbon of the proposed model.
2 Mathematical model
2.1 Carbon trading mechanism model
The carbon trading mechanism requires the units with carbon emissions to get involved in trading. Carbon emissions are regarded as a commodity. Each carbon emission source has a certain carbon emission quota. When carbon emissions of the carbon emission source exceed the carbon emission quota, the excess part should be purchased from the carbon trading cost. Conversely, the remaining part can be sold to other carbon emission sources.
Gas-fired units, diesel units, and coal-fired units are seen as carbon emission sources in this paper. Each unit has the same carbon emission quota and different carbon emission intensities. The carbon emission intensity of coal-fired units is the highest, and the gas-fired units have the lowest carbon emission intensity. The coal-fired units are equipped with carbon capture devices. The carbon capture device can absorb carbon dioxide generated by the coal-fired units. The carbon trading mechanism model can be expressed as:
where EVPP,2,t and EVPP,3,t are the carbon emissions of VPP 2 and VPP 3; λGT, λdie, and λco are the carbon emission intensity of the gas-fired unit, diesel unit, and coal-fired unit, respectively; PGT,t, Pdie,t, and Pco,t are the power outputs of the units; λcar is the carbon emission quota; Ecap,t is the amount of captured carbon dioxide; εtra is the carbon trading price; Ctra,t is the carbon trading cost.
2.2 Carbon emission-based dynamic dispatch priority
Most existing methods of carbon reduction increase generating costs leading to an increase in electricity users’ costs. Therefore, a carbon emission-based dynamic dispatch priority model which achieves carbon emission reduction by adjusting the dispatch sequence of VPPs is proposed. We first set the dispatch priority according to carbon emissions which can be presented by the following equations:
where PVPP,i,t is the power output of VPP i; P1,VPP,i,t, P2,VPP,i,t, and P3,VPP,i,t are the power outputs of VPP i in different dispatch priorities; EVPP,i,t is the carbon emissions of VPP i; E1,VPP and E2,VPP are the carbon emission thresholds dividing dispatch priorities; uVPP,i,t is the status of VPP i, 0 is taken when the power output of VPP i is 0, otherwise 1 is taken; u1,VPP,i,t, u2,VPP,i,t, and u3,VPP,i,t are the status of VPP i in different dispatch priorities. As can be seen above, there are three dispatch priorities in this paper. The higher the carbon emissions, the lower the dispatch priority. When the carbon emissions of the VPP exceed the carbon emission threshold, the power output of the VPP reduces to zero. Therefore, the VPP needs to actively reduce carbon emissions to obtain more profits.
Then, the VPPs with higher dispatch priorities have priority in generation. The dispatch priority rules can be expressed as:
where
3 Distributionally robust optimization considering carbon emission-based dynamic dispatch priority
3.1 Two-stage distributionally robust optimal dispatch model of VPPC
A VPPC with four VPPs is considered in this paper. On the generation side, there are clean energy units and conventional units. PV is a typical clean energy unit, but its volatility is not beneficial to the operation of the power system. In order to smooth the output volatility of PV, it is often used in conjunction with energy storage, which forms VPP 1. Gas-fired units, diesel units, and coal-fired units are common conventional units. The carbon emission intensities of the first two units are relatively low. They are aggregated as VPP 2. For emission reduction, the coal-fired units with the highest carbon emissions are equipped with a carbon capture device. The third VPP consists of a coal-fired unit and a carbon capture device. The outputs of VPP 2 and VPP 3 are constrained by the dynamic dispatch priority rules due to the carbon emission of the units. On the load side, the dispatchable loads which include the shiftable loads and interruptible loads are aggregated as VPP 4. VPP 4 is encouraged to participate in power system dispatch by economic compensation and has the effect of peak load shifting. The VPPC is formed by the four VPPs, which can be regarded as a small power system.
Wind power is a representative of distributed resources which is difficult to control. Therefore, wind power is not suitable as a part of the VPP. In this paper, the wind power is in the area powered by the VPPC, but the VPPC does not include wind power. The low-carbon economic operation of the VPPC is influenced by the uncertainty of wind power. Therefore, a two-stage distributionally robust optimal dispatch model is proposed to deal with the uncertainty and improve the absorption of wind power. The dispatch priorities of VPPs are determined in the day-ahead stage, and the outputs of each VPP are determined in the intra-day stage according to the dispatch priorities.
3.2 Objective function
A distributionally robust optimal model of the VPPC considering carbon emission-based dynamic dispatch priority is proposed in this paper. The objective is to minimize the comprehensive operating costs of VPPC consisting of four VPPs. It can be calculated as follows:
where Con,t and Coff,t are the start-up and shut-down costs of units; ps is the probability value of the sth discrete wind power output scenario; S is the total number of discrete scenes; W is the set of probabilities for actual wind power output scenarios; C1,t, C2,t, C3,t, and C4,t are the operating costs of the four VPPs; Cwind,t is the punishment cost of wind power curtailment; T is the time of dispatch period taking the value of 24. The min form in the outer layer represents the minimization of the total cost in two stages. The max-min form represents the minimization of cost in the intra-day stage under the worst wind power output scenario probability.
3.2.1 Start-up and shut-down costs
The start-up and shut-down costs of the coal-fired unit are considered in this paper. uco,t is a binary variable. Zero is taken when the coal-fired unit is off, while one means the coal-fired unit is on. ρon and ρoff are the single start-up and shut-down costs.
3.2.2 Operating cost of VPP 1
The operating cost of VPP 1 includes the charging and discharging costs of the energy storage device and the punishment cost of PV curtailment, which can be expressed as:
where ρPV is the unit punishment cost of PV curtailment;
3.2.3 Operating cost of VPP 2
The operating costs of the gas-fired unit and the diesel unit are included in the operating cost of VPP 2, which can be expressed as follows:
where PGT,t and Pdie,t are the power outputs of the gas-fired unit and the diesel unit, respectively; ρGT is the unit generation cost; adie and bdie are generation cost coefficients of the diesel unit.
3.2.4 Operating cost of VPP 3
The coal-fired unit is equipped with a carbon capture device in VPP 4. The carbon capture device can absorb carbon dioxide produced by coal combustion, and the captured carbon dioxide needs to be stored, thus producing the storage cost. The operating costs of the coal-fired unit and the carbon capture device are also included in the operating cost of VPP 3. It can be presented as follows:
where aco and bco are generation cost coefficients of the diesel unit; ρCC and ρcap are the unit operation cost of the carbon capture device and unit storage cost of carbon dioxide; Pco,t and PCC,t are power outputs of the coal-fired unit and the carbon capture device, respectively.
3.2.5 Operating cost of VPP 4
The operating cost of VPP 4 includes compensation costs of shiftable loads and interruptible loads. It can be calculated as follows:
where ρshif and ρinte are the unit compensation cost of shiftable loads and interruptible loads, respectively; Pshif,t and Pinte,t are the response power of shiftable loads and interruptible loads.
3.2.6 Punishment cost of wind power curtailment
ρwind is the unit punishment cost of wind power curtailment;
3.3 Constraints
3.3.1 Constraints of VPP 1
The output of PV should be within the limits.
The energy storage device should meet the following constraints:
Eqs. 18 and 19 are the charging and discharging power constraints of energy storage devices, respectively.
The total output of VPP 1 PVPP,1,t is given by:
It can be smoothed by combining PV and energy storage devices, which can be expressed as follows:
where RVPP,1 is the maximum ramp rate.
3.3.2 Constraints of VPP 2
The gas-fired unit and the diesel unit should meet the power output constraints and ramp rate constraints, which can be expressed as follows:
where uGT,t and udie,t are binary variables denoting the on/off status of the gas-fired unit and the diesel unit, zero for off and one for on;
The total power output of VPP 2 PVPP,2,t can be calculated as follows:
And it meets the following constraint:
where uVPP,2,t are binary variables denoting the on/off status of the VPP 2; zero for off and one for on.
3.3.3 Constraints of VPP 3
The coal-fired unit should meet the following constraints:
Equation 30 is the power output constraint of a coal-fired unit.
The constraints of power outputs Eq. 35 and ramp rates Eq. 36 are considered for the carbon capture device.
where λ is the amount of carbon dioxide captured by unit power.
Because the carbon capture device does not exchange power with the outside of the VPP 3, the power output of VPP 3 PVPP,3,t is given by:
3.3.4 Constraints of VPP 4
The shiftable loads can be presented by the following constraints:
Equation 39 indicates that the shiftable loads remain unchanged during the whole dispatch period. The response power of shiftable loads should be within the limits in Eq. 40
The interruptible loads should meet the following constraints:
Equation 41 indicates that the total response power of interruptible loads is limited during the whole dispatch period.
The power output of VPP 4 PVPP,4,t can be presented by:
3.3.5 Constraints of wind power
3.3.6 Constraints of power balance
The wind power and the power output of the VPPC with four VPPs supply the load demand.
3.3.7 Ambiguity set construction of wind power
The method of distributionally robust optimization is adopted to deal with the uncertainty of wind power. There is uncertainty in the probability of wind power output scenarios. Therefore, an ambiguous set of wind power output scenarios is constructed by moment information. First, the historical scenarios of wind power output are clustered into several typical scenarios using the K-means algorithm, and the probability of typical scenarios is obtained. Next, the 1-norm and ∞-norm constraints centered around typical scenario probabilities are used to describe the set of actual wind power output scenario probabilities, which can be expressed as follows:
where
The probability of wind power output scenarios should meet the following confidence constraints:
where K is the number of historical wind power output scenarios; Pr{} is the probability of inequality being established in {}.
The right sides of Eqs 47, 48 are confidence levels, which can be presented by β1 and β∞.
When the number of historical scenarios increases or the confidence level approaches one, the probability deviation of wind power output scenarios decreases. The probability of actual wind power output scenarios is closer to the probability of typical scenarios. The operator can balance the economy and robustness of the optimization results by adjusting the confidence level.
4 Solution methodology
The two-stage distributionally robust optimal dispatch model is constructed in this paper. In the day-ahead stage, the variables unrelated to the probability of actual wind power output scenarios are optimized, including the states and dispatch priority of each VPP. In the intra-day stage, the distributionally robust optimal method is used to optimize the operating power of each VPP and the power of wind curtailment under the worst wind power output scenario probability. The C&CG algorithm is introduced to solve the two-stage distributionally robust optimal dispatch model. It decomposes the model into a main problem (MP) and a sub problem (SP). They can be written in the following compact matrix form:
where x is the first stage optimization variable; ys is the optimization variable for the sth typical scenario in the second stage; ξs is the predicted wind power output for the sth typical scenario; A, B, C, D, G, I, J, P, and Q are coefficient matrices; d, g, j, and r are parameter vectors.
The specific solution steps of the C&CG algorithm are as follows.
Step 1. Set the initial wind power output scenario, scenario probability values, upper bound UB = +∞, lower bound LB = −∞, convergence criterion ε = 0.1, and the number of iterations n = 0.
Step 2. Solve the MP to obtain the first stage decision variables, and the LB is updated.
Step 3. Solve the SP with the first-stage decision variables known to obtain the second-stage decision variables and the worst wind power output scenario probability and update the UB.
Step 4. If UB-LB≤ε, stop the iteration and output the result. If not, add new second-stage variables and the corresponding constraint based on the wind power output scenario probability obtained by solving the SP to the MP. Next, return to step 2 with iteration number n = n+1.
5 Case studies
5.1 Case description
A VPPC with four VPPs is used to verify the feasibility and effectiveness of the distributionally robust optimal dispatch model proposed in this paper. The composition of each VPP is described in section 3.1. The unit curtailment cost of PV and wind power is 50 $/MW. The carbon emission intensities of the gas-fired unit, the diesel unit, and the coal-fired unit are 0.4 t/MW, 0.6 t/MW, and 1.5 t/MW. The amount of carbon dioxide captured by unit power is 4 t/MW. The unit charge-discharge cost is 40 $/MW. The unit operation cost of the carbon capture device is 10 $/MW. The unit storage cost of carbon dioxide is 5 $/t. The unit compensation cost of shiftable loads and interruptible loads are 40 $/MW and 50 $/MW, respectively. The paper assumes that the wind power output follows the normal distribution with the predicted wind power output as the mean and 0.5 times the predicted wind power as the variance, and 10,000 historical wind power output scenarios are generated. Five typical wind power output scenarios are clustered using the K-means algorithm, as shown in Figure 1. The confidence levels β1 and β∞ are set to 0.99.
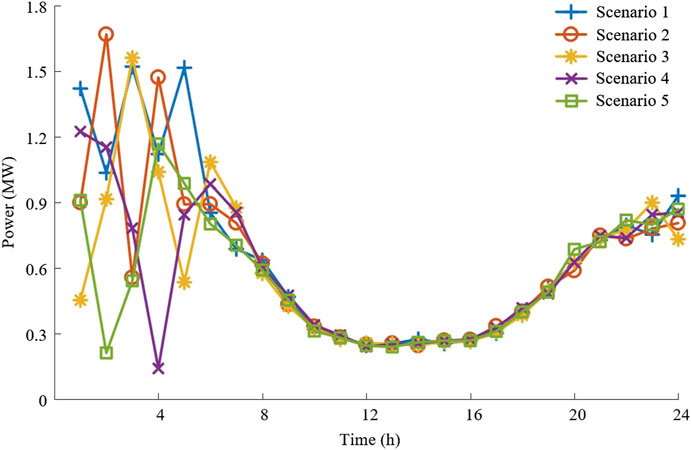
FIGURE 1. Typical wind power output scenarios.
This model is solved by commercial software CPLEX in MATLAB.
5.2 Analysis of carbon emission-based dynamic dispatch priority
To verify the impact of carbon emission-based dynamic dispatch priority, the case studies are conducted with and without the dynamic dispatch priority. The power outputs of VPP 2 and VPP 3 are shown in Figure 2 because only VPP 2 and VPP 3 follow the dynamic dispatch priority rules. The priority generation proportion is set to one.
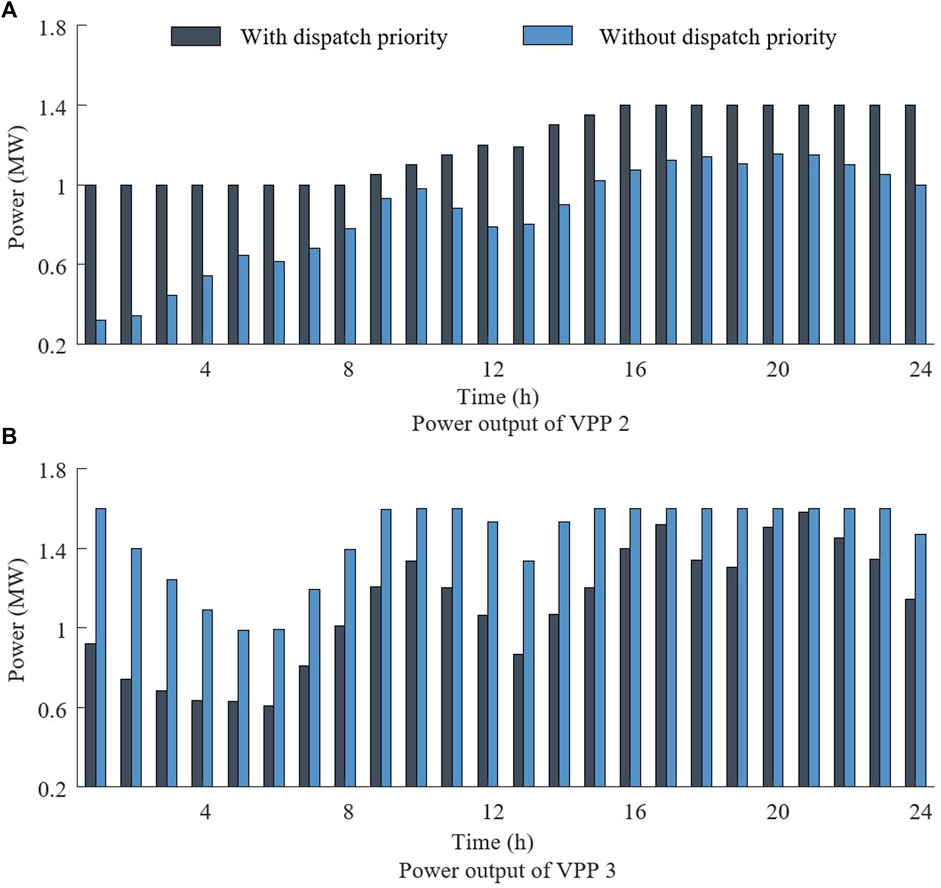
FIGURE 2. Power outputs with and without dynamic dispatch priority: (A) VPP 2 (B) VPP 3.
The carbon emission intensity of the coal-fired unit in VPP 3 is higher than the carbon emission intensities of the gas-fired unit and the diesel unit in VPP 2. The power output of VPP 2 increases and the power output of VPP 3 decreases when considering the dynamic dispatch priority. The dispatch priority of VPP decreases when the carbon emissions of VPP exceed a certain value, resulting in delayed power output and achieving carbon reduction. The dispatch sequences are decoupled from the carbon emissions without dynamic dispatch priority. Each VPP participates in dispatch with an economic orientation. The power output of VPP 3 increases because the generation cost is relatively low. By contrast, the power output of VPP 2 decreases.
Carbon emissions with different priority generation proportions are shown in Figure 3. It can be found that the carbon emissions decrease while the priority generation proportion increases because the higher the priority generation proportion, the higher the power generated by the VPP with low carbon emission. It has an inhibitory effect on carbon emissions. Each VPP generates freely when the priority generation proportion is zero. The power output of the coal-fired unit in VPP 3 increases causing an increase in carbon emissions.
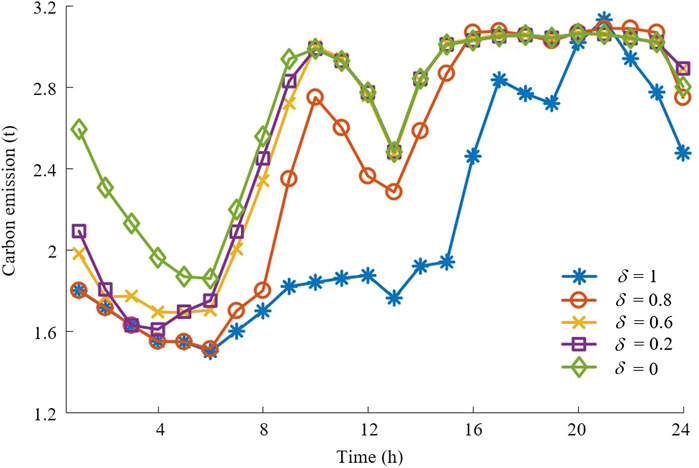
FIGURE 3. Carbon emissions with different priority generation proportions.
In Table 1, the operating cost of VPP 2 increases by 40% and the operating cost of VPP 3, carbon trading cost, and total cost decreases by 20%, 66%, and 6% as the priority generation proportion increases from zero to one. Because VPP 2 has less carbon emissions compared with VPP 3. And the output of the coal-fired unit in VPP 3 decreases resulting in a decrease in the carbon trading cost and the total cost. Therefore, the carbon emission-based dynamic dispatch priority can reduce the carbon emissions and total cost.
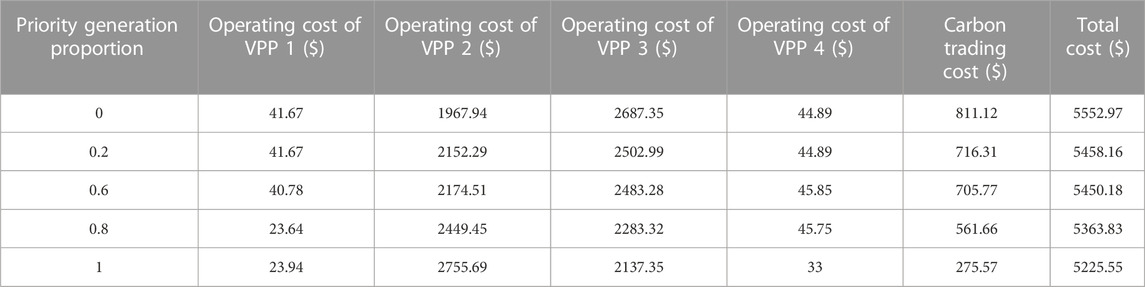
TABLE 1. Various costs under different priority generation proportions.
The amount of carbon captured with different carbon emission thresholds is shown in Figure 4. Each VPP wants to receive higher dispatch priority because they want to gain higher revenue. Therefore, each VPP will try to reduce its carbon emissions as much as possible, but the carbon capture device has power limits. If the amount of carbon dioxide absorbed within the power limit of the carbon capture device can improve the dispatching priority of VPP, the output power of the carbon capture device will be as large as possible. On the contrary, the output power of the carbon capture device will reduce due to the operating costs. Therefore, the amount of carbon captured will increase with the decrease in carbon emission thresholds most of the time, and the output power of the carbon capture device will not increase at some time.
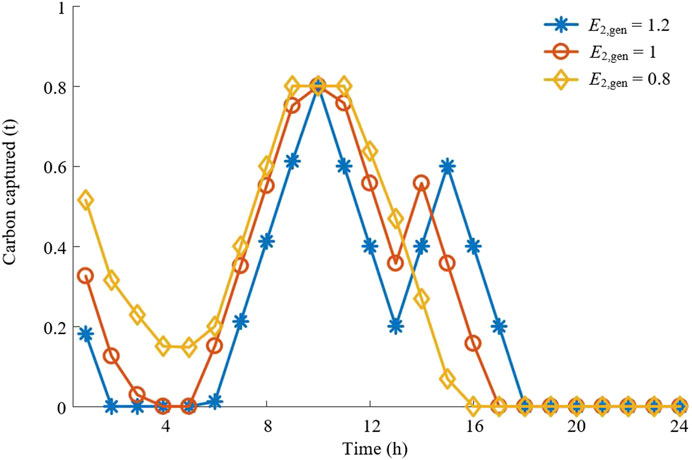
FIGURE 4. Amount of carbon captured with carbon emission thresholds.
Figure 5 shows a relation curve between carbon emission thresholds, carbon emissions, and total costs. The carbon emissions decrease when the carbon emission threshold decreases from 1.2 to 1. VPP 3 needs to increase the power output of the carbon capture device to reduce carbon emissions and achieve higher dispatch priority, and the carbon emissions increase when the carbon emission threshold decreases from 1 to 0.7 because the power output of the carbon capture device reaches its limit currently and is unable to increase the dispatch priority of VPP 3. The trend of total cost changes is basically consistent with carbon emissions. The carbon emissions and total cost reach the minimum at the same time. Therefore, the lowest carbon emissions and total cost can be achieved by setting reasonable carbon emission thresholds.
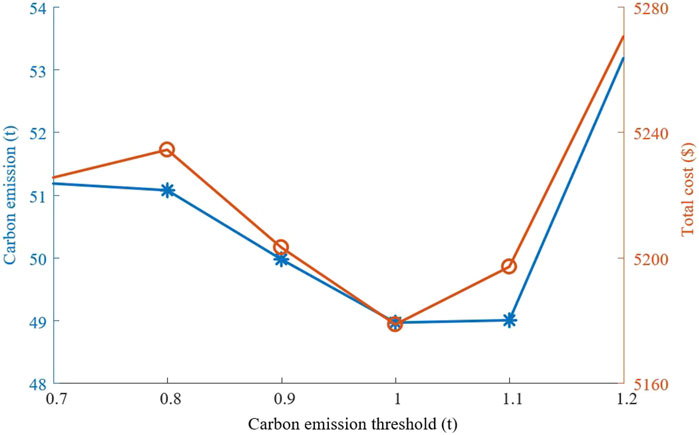
FIGURE 5. Relation curve between carbon emission thresholds, carbon emissions, and total cost.
5.3 Analysis of the carbon trading mechanism
To verify the impact of carbon trading mechanisms, the operating results under different carbon trading prices are analyzed.
The operating costs of VPP 2 and VPP 3 under different carbon trading prices are shown in Figure 6. The operating cost of VPP 2 increases and the operating cost of VPP 3 decreases with the increase in carbon trading prices. When the carbon trading price increases to 50$, the operating cost of VPP 2 increases significantly and the operating cost of VPP 3 decreases significantly. The operating costs of VPP 2 and VPP 3 remain unchanged when the carbon trading price exceeds 80$. Because the carbon trading mechanism increases the generating cost, it has inhibitory effects on VPP with high carbon emissions and encourages the generation of VPP with low carbon emissions. When the carbon trading price is less than 50$, VPP 3 still has economic advantages. When the carbon trading price exceeds 80$, the carbon trading mechanism has the strongest inhibitory effect on VPP 3.
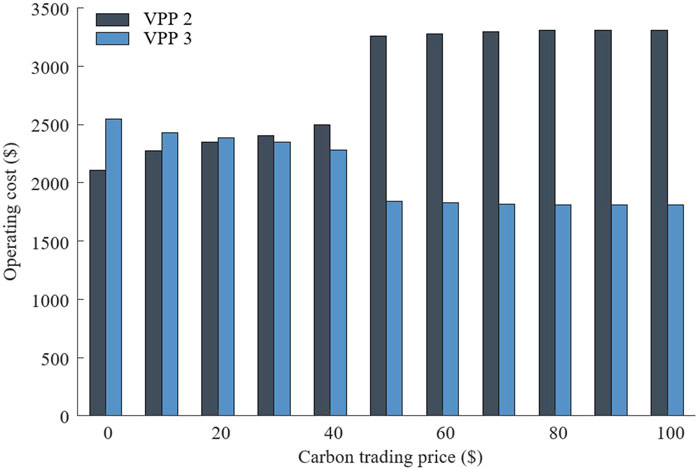
FIGURE 6. Operating costs of VPP 2 and VPP 3 under different carbon trading prices.
Figure 7 shows the trend in carbon trading cost with the increase in carbon trading price. When the carbon trading price is less than 40$ or higher than 50$, the carbon trading cost increases with the increase in carbon trading price. When the carbon trading price is 50$, the carbon trading cost significantly decreases. Because the carbon trading cost of VPP 3 is too high, the power output of the coal-fired unit in VPP 3 decreases.
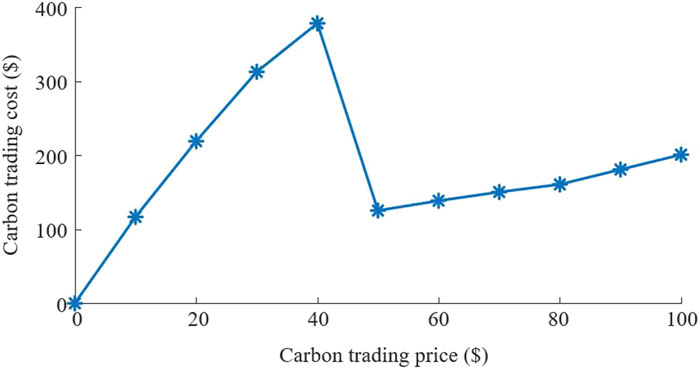
FIGURE 7. Carbon trading cost under different carbon trading prices.
In Figure 8, the total cost increases and the carbon emissions decrease with the increase in carbon trading price. Therefore, the carbon trading mechanism can reduce the carbon emissions from the VPPC and increase the total cost in the meantime. The economic and low-carbon performance of the VPPC can be balanced by setting reasonable carbon trading prices.
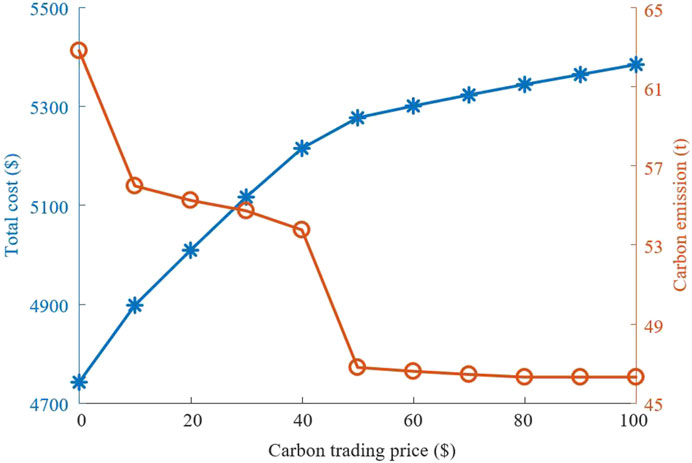
FIGURE 8. Relation curve between total cost, carbon emission, and carbon trading price.
5.4 Analysis of the distributionally robust optimal method
5.4.1 Comparison with the deterministic method
The number of historical wind power output scenarios is 10,000. The confidence levels β1 and β∞ are set to 0.99. In this section, the distributionally robust optimal method is compared with the deterministic method. The optimization results are shown in Table 2.
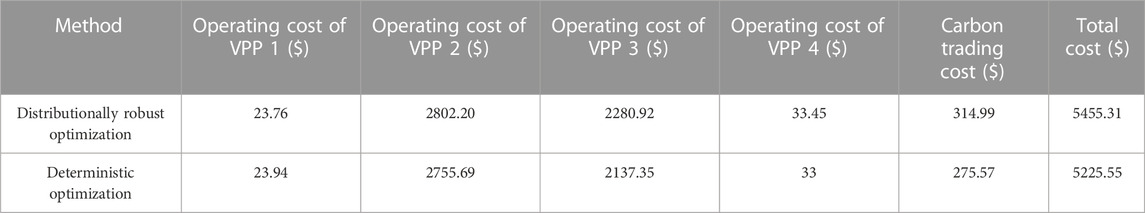
TABLE 2. Comparison between different optimal methods.
In Table 2, most costs of the distributionally robust optimal method are higher compared with the deterministic method. Because the probability of the worst wind power output scenario can be obtained through distributionally robust optimization, the carbon emission-based dynamic dispatch priority model is considered. The dispatch priority of VPP 4 is lower because of the substantial carbon emission from the coal-fired unit. The coal-fired unit in VPP 4 has a sufficient adjustment margin. Therefore, the coal-fired unit is the main unit to cope with the uncertainty of wind power. More operating cost of VPP 4 increases leading to an increase in carbon trading cost. The total cost also increases by 4%.
5.4.2 A comparison of different numbers of historical wind power output scenarios
In this section, the confidence levels β1 and β∞ are set to 0.99. 1-norm constraint, ∞-norm constraint, and the comprehensive norm are considered, respectively. The optimization results when selecting different numbers of historical data are compared. The results are calculated based on the number of wind power historical data ranging from 100 to 10,000, as shown in Table 3.
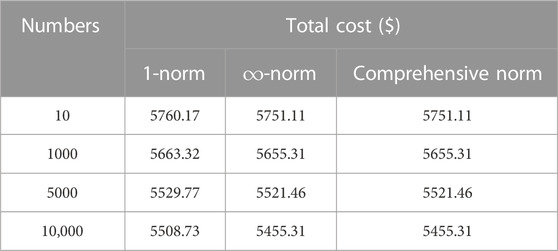
TABLE 3. Result of comparison under different numbers of historical data.
Table 3 shows that the total cost gradually decreases as the historical data increases. The increase in the number of historical data reduces the deviation of scenario probability, thus reducing the conservatism of solving the problem. It also can be seen that the total cost is lower with the comprehensive norm constraint compared to the other two constraints under the same number of historical data, which indicates that the conservatism of the model with the comprehensive norm constraint is lower.
5.4.3 A comparison of different confidence levels
This section analyzes the calculation results by setting different confidence levels β1 and β∞. The number of historical data is 10,000.
It can be seen from Table 4 that the total cost increases with increasing confidence levels. As the confidence levels increase, the uncertainty of wind power output increases. The VPPC needs to dispatch more distributed resources resulting in an increase in total costs.
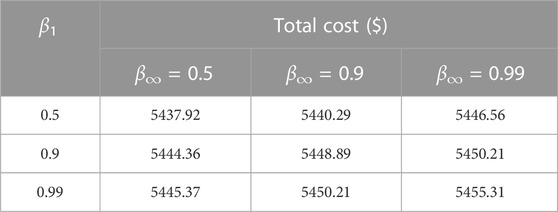
TABLE 4. Result of comparison under different confidence levels.
The confidence level β∞ is set to 0.99 and the confidence level β1 is set to 0.5, 0.9, and 0.99, respectively. The comparison between the results under the comprehensive norm constraint and ∞-norm constraint is shown in Table 5. The results under the comprehensive norm constraint are lower because the comprehensive norm constraint takes the 1-norm constraint into account resulting in lower conservatism.
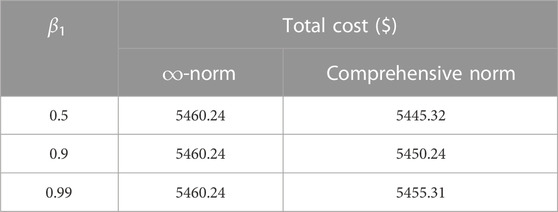
TABLE 5. Comparison between comprehensive norm and ∞ norm.
The confidence level β1 is set to 0.99 and the confidence level β∞ is set to 0.5, 0.9, and 0.99, respectively. The comparison between the results under comprehensive norm constraint and 1-norm constraint is shown in Table 6. Similarly, the total cost under the comprehensive norm constraint is lower and less conservative than under the 1-norm constraint.
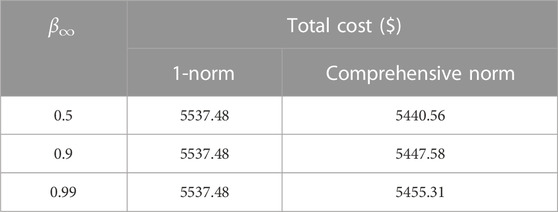
TABLE 6. Comparison between comprehensive norm and 1 norm.
6 Conclusion
A distributionally robust optimal model of the VPPC considering carbon emission-based dynamic dispatch priority is proposed in this paper. The main results of case studies are as follows.
(1) The carbon emission-based dynamic dispatch priority can not only reduce carbon emissions but also reduce the total cost by 6%. It can promote each VPP to operate in a greener way. The higher the priority generation proportion, the stronger the inhibitory effect on carbon emissions. Better economic and low-carbon performance can be achieved by setting reasonable carbon emission thresholds.
(2) The carbon trading mechanism can reduce the carbon emissions in VPPC and increase the total cost at the same time. Therefore, it is necessary to balance the economic and low-carbon performance of the VPPC by setting reasonable carbon trading prices.
(3) When considering the wind power uncertainty, the costs of the distributionally robust optimal method are higher compared with the deterministic method. The increase in the number of historical data reduces the conservatism of this model. The conservatism of this model increases with the increase in confidence levels, and the conservatism of the model with the comprehensive norm constraint is lower.
Electrical energy is only considered in the VPPC. The interdependency between natural gas and electrical energy is increasing. Further work will consider multiple forms of energy in the VPPC.
Data availability statement
The original contributions presented in the study are included in the article/Supplementary material, further inquiries can be directed to the corresponding author.
Author contributions
JZ contributed to the model, simulation and writing. CX contributed to the method. WW contributed to the editing of the article and discussion. YJ contributed to the literature analysis and provided a critical review. All authors contributed to the article and approved the submitted version.
Funding
This work was supported by the National Key R&D Program of China (No. 2021YFB2401200).
Conflict of interest
JZ, CX, WW and YJ were employed by State Grid Shanghai Energy Interconnection Research Institute Co., Ltd.
Publisher’s note
All claims expressed in this article are solely those of the authors and do not necessarily represent those of their affiliated organizations, or those of the publisher, the editors and the reviewers. Any product that may be evaluated in this article, or claim that may be made by its manufacturer, is not guaranteed or endorsed by the publisher.
References
Adamiak, M., Schiefen, M. J., Schauerman, G., and Cable, B. (2014). Design of a priority-based load shed scheme and operation tests. IEEE Trans. Ind. Appl. 50 (1), 182–187. doi:10.1109/TIA.2013.2260511
Akbari-Dibavar, A., Mohammadi-Ivatloo, B., Zare, K., Khalili, T., and Bidram, A. (2021). Economic-emission dispatch problem in power systems with carbon capture power plants. IEEE Trans. Ind. Appl. 57 (4), 3341–3351. doi:10.1109/TIA.2021.3079329
Babaei, S., Zhao, C., and Fan, L. (2019). A data-driven model of virtual power plants in day-ahead unit commitment. IEEE Trans. Power Syst. 34 (6), 5125–5135. doi:10.1109/TPWRS.2018.2890714
Bagchi, A., Goel, L., and Wang, P. (2019). Adequacy assessment of generating systems incorporating storage integrated virtual power plants. IEEE Trans. Smart Grid 10 (3), 3440–3451. doi:10.1109/TSG.2018.2827107
Baringo, A., and Baringo, L. (2017). A stochastic adaptive robust optimization approach for the offering strategy of a virtual power plant. IEEE Trans. Power Syst. 32 (5), 3492–3504. doi:10.1109/TPWRS.2016.2633546
Dabbagh, S., R., and Sheikh-El-Eslami, M., K. (2016). Risk assessment of virtual power plants offering in energy and reserve markets. IEEE Trans. Power Syst. 31 (5), 3572–3582. doi:10.1109/TPWRS.2015.2493182
Guo, M., Guo, X., Yang, J., Gao, C., and Chen, T. (2021). Operation strategy of central air conditioning virtual power plant based on risk measurement method. Front. Energy Res. 9, 773149. doi:10.3389/fenrg.2021.773149
Kang, C., Zhou, T., Chen, Q., Wang, J., Sun, Y., Xia, Q., et al. (2015). Carbon emission flow from generation to demand: A network-based model. IEEE Trans. Smart Grid 6 (5), 2386–2394. doi:10.1109/TSG.2015.2388695
Laghari, J. A., Mokhlis, H., Karimi, M., Abu Bakar, A. H., and Mohamad, H. (2015). A new under-frequency load shedding technique based on combination of fixed and random priority of loads for smart grid applications. IEEE Trans. Power Syst. 30 (5), 2507–2515. doi:10.1109/TPWRS.2014.2360520
Liu, W., Gu, W., Sheng, W., Song, X., and Gao, F. (2019). Virtual cluster control for active distribution system using pinning-based distributed secondary control. Int. J. Electr. Power Energy Syst. 109, 710–718. doi:10.1016/j.ijepes.2019.02.017
Lou, S., Lu, S., Wu, Y., and Kirschen, D. S. (2015). Optimizing spinning reserve requirement of power system with carbon capture plants. IEEE Trans. Power Syst. 30 (2), 1056–1063. doi:10.1109/TPWRS.2014.2341691
Luo, F., Yang, X., Wei, W., Zhang, T., Yao, L., Zhu, L., et al. (2020). Bi-level load peak shifting and valley filling dispatch model of distribution systems with virtual power plants. Front. Energy Res. 8, 596817. doi:10.3389/fenrg.2020.596817
Omelčenko, V., and Manokhin, V. (2021). Optimal balancing of wind parks with virtual power plants. Front. Energy Res. 9, 665295. doi:10.3389/fenrg.2021.665295
Reddy, K. S., Panwar, L. K., Panigrahi, B. K., and Kumar, R. (2017). Modeling of carbon capture technology attributes for unit commitment in emission-constrained environment. IEEE Trans. Power Syst. 32 (1), 662–671. doi:10.1109/TPWRS.2016.2558679
Ren, L., Peng, D., Wang, D., Li, J., and Zhao, H. (2023). Multi-objective optimal dispatching of virtual power plants considering source-load uncertainty in V2G mode. Front. Energy Res. 10, 983743. doi:10.3389/fenrg.2022.983743
Wang, L., Wu, W., Lu, Q., and Yang, Y. (2021). Optimal aggregation approach for virtual power plant considering network reconfiguration. J. Mod. Power Syst. Clean. Energy 9 (3), 495–501. doi:10.35833/MPCE.2020.000625
Yang, D., He, S., Wang, M., and Pandžić, H. (2020). Bidding strategy for virtual power plant considering the large-scale integrations of electric vehicles. IEEE Trans. Ind. Appl. 56 (5), 5890–5900. doi:10.1109/TIA.2020.2993532
Yi, Z., Xu, Y., Zhou, J., Wu, W., and Sun, H. (2020). Bi-level programming for optimal operation of an active distribution network with multiple virtual power plants. IEEE Trans. Sustain. Energy 11 (4), 2855–2869. doi:10.1109/TSTE.2020.2980317
Yu, D., Zhao, X., Wang, Y., Jiang, L., and Liu, H. (2022). Research on energy management of a virtual power plant based on the improved cooperative particle swarm optimization algorithm. Front. Energy Res. 10, 785569. doi:10.3389/fenrg.2022.785569
Zhang, M., Xu, Y., and Sun, H. (2023). Optimal coordinated operation for a distribution network with virtual power plants considering load shaping. IEEE Trans. Sustain. Energy 14 (1), 550–562. doi:10.1109/TSTE.2022.3220276
Zhang, N., Hu, Z., Dai, D., Dang, S., Yao, M., and Zhou, Y. (2016). Unit commitment model in smart grid environment considering carbon emissions trading. IEEE Trans. Smart Grid 7 (1), 420–427. doi:10.1109/TSG.2015.2401337
Zhang, R., Hredzak, B., and Fletcher, J. (2021). Dynamic aggregation of energy storage systems into virtual power plants using distributed real-time clustering algorithm. IEEE Trans. Ind. Electron. 68 (11), 11002–11013. doi:10.1109/TIE.2020.3038074
Zhang, T., and Hu, Z. (2022). Optimal scheduling strategy of virtual power plant with power-to-gas in dual energy markets. IEEE Trans. Ind. Appl. 58 (2), 2921–2929. doi:10.1109/TIA.2021.3112641
Zhao, H., Wang, B., Wang, X., Pan, Z., Sun, H., Liu, Z., et al. (2020). Active dynamic aggregation model for distributed integrated energy system as virtual power plant. J. Mod. Power Syst. Clean. Energy 8 (5), 831–840. doi:10.35833/MPCE.2020.000202
Keywords: dynamic dispatch priority, carbon trading, carbon capture, virtual power plant clusters, distributionally robust
Citation: Zuo J, Xu C, Wang W and Ji Y (2023) Distributionally robust optimization for virtual power plant clusters considering carbon emission-based dynamic dispatch priority. Front. Energy Res. 11:1214263. doi: 10.3389/fenrg.2023.1214263
Received: 29 April 2023; Accepted: 03 August 2023;
Published: 23 August 2023.
Edited by:
Haoming Liu, Hohai University, ChinaReviewed by:
Linfei Yin, Guangxi University, ChinaShunbo Lei, The Chinese University of Hong Kong, China
Kai Zhou, Soochow University, Suzhou, China
Copyright © 2023 Zuo, Xu, Wang and Ji. This is an open-access article distributed under the terms of the Creative Commons Attribution License (CC BY). The use, distribution or reproduction in other forums is permitted, provided the original author(s) and the copyright owner(s) are credited and that the original publication in this journal is cited, in accordance with accepted academic practice. No use, distribution or reproduction is permitted which does not comply with these terms.
*Correspondence: Juan Zuo, enVvanVhbl9zZ2NjQDE2My5jb20=