 Xiping Ma
 Chen Liang2
94% of researchers rate our articles as excellent or good
Learn more about the work of our research integrity team to safeguard the quality of each article we publish.
Find out more
ORIGINAL RESEARCH article
Front. Energy Res., 06 June 2023
Sec. Smart Grids
Volume 11 - 2023 | https://doi.org/10.3389/fenrg.2023.1213154
This article is part of the Research TopicData-based Resilience-oriented Planning and Operation of Multi-Energy SystemsView all 6 articles
To fully tap the abilities of renewables in reactive power optimization, this paper develops a detailed model for the power regulation capabilities of wind turbines and photovoltaic units and studies their impact on the power system’s operation. First, the power system model with renewables integration is established using AC power flow. The wind turbines and photovoltaic units are modeled in detail according to their topologies and operating characteristics, and then further simplified according to the feasible region. An improved DC power flow model is adopted to handle the non-linear characteristics of the power system. On this basis, a multi-objective reactive power optimization model is constructed to minimize the power generation cost, wind and solar power curtailment, and voltage offset. Finally, comparisons between two types of models in different scenarios are designed. Numerical simulations demonstrate that the participation of renewables in reactive power regulation can improve the operational economy and voltage stability of power systems.
With the rapid development of renewable energy generation technology, the scale of renewable integration has gradually expanded to promote clean energy use. However, the random and intermittent renewable energy integration has changed the topology of the traditional power system, and the power distribution in the system has also been affected. In this context, operational problems such as voltage offset (Li et al., 2021; Li et al., 2022a) and frequency stability (Li et al., 2020; Lin et al., 2023) have become particularly significant. To this end, scholars worldwide have analyzed the impact of renewable integration from the perspectives of grid-connected control strategy, optimal configuration of renewables’ capacity and locations, active/reactive power optimization, and stability analysis to achieve economic and secure operation of power systems (Zhang et al., 2023).
Reactive power optimization of power systems is a hot topic in the research of renewable energy integration. In the early stage, scholars paid more attention to the single-objective optimization problem to promote wind power or photovoltaic integration, and established corresponding optimization models with the objectives of minimizing operational costs (Ai et al., 2021), maximizing renewable energy consumption (Hui et al., 2019), and minimizing voltage offset (Zhong et al., 2020). However, with the increment of renewable integration, the operation of the power system becomes more complex, and the traditional single-objective optimization gradually develops into multi-objective optimization. In this context, reference (Adaryani and Karami, 2013) established a reactive power optimization model to minimize operational costs and carbon emissions. Considering the strong non-linearity in the corresponding optimization problem, the intelligent bee colony algorithm was adopted for efficient solution. In (Kuang et al., 2022), a reactive power optimization model considering large-scale wind turbine (WT) integration was established with the goal of minimizing active power loss and maximizing renewable energy consumption, and an e-orthogonal multi-objective differential evolution algorithm was used to solve the problem via global search. The influences of the WT integration on the voltage stability were analyzed. In (Duan et al., 2017), the ability of renewable energy to participate in reactive power regulation was considered, with which an optimization model is established to minimize voltage fluctuation and maximize renewable energy consumption. The above literature mainly establishes the objective function according to the different needs of power system operation, thereby optimizing the output distribution of renewable energy and conventional units. However, due to the strong non-linearity of the model, these studies mostly use artificial intelligence algorithms to solve the optimization problem. Consequently, the uniqueness of the optimization results and the local optimal problem are difficult to be guaranteed. Moreover, the renewables, like wind power and solar power, are mainly modeled as simply active power generation in these studies, while their abilities to support the reactive power optimization and voltage regulation have not been fully explored.
To overcome the aforementioned deficiency, reference (Sulc et al., 2014) first adopted the dist-flow model for the linearization of the distribution power system model. The original non-linear multi-objective reactive power optimization problem was further transformed into a two-layer linear optimization problem for solution. The rapid convergence of the two-layer problem was then realized through the dual ascent method. On this basis, references (Bolognani et al., 2015; Li et al., 2022b) considered the collaborative optimization of multi-regional systems and used the alternating direction method of multipliers (ADMM) to achieve the global convergence in the multi-agent optimization problems. To improve the iterative effectiveness of the two-layer and the multi-agent model, reference (Tang et al., 2019) further proposed an accelerated strategy of the distributed dual ascent algorithm to improve the efficiency of the model’s solution, the original non-linearity was then solved with limited iterations between different sub-problems.
According to the analysis above, the existing literature has carried out a large number of studies on the reactive power optimization problem in the power system considering renewable integration from the perspectives of optimization objectives and algorithms. However, these studies have simplified renewable energy into a simple power output unit without considering its internal operation and grid connection constraints. As a result, the corresponding optimization model cannot accurately reflect the impacts of renewable integration on the reactive power optimization of power systems. To fill the mentioned gaps, this paper first studies the detailed model of the power system with renewable integration, with a focus on the operation and grid-connected characteristics of the renewable energy generation unit. Based on this, an improved DC power flow model is used to simplify the non-linear power system model. Finally, a multi-objective reactive power optimization model is established with the objective function of minimizing operational cost, abandonment rate of WT and PV, and voltage deviation. The main contributions of this paper are summarized below.
(1) We propose a complete characterization of the power system considering large-scale renewable integration. During the model formulation, the operational characteristics and topological connections of the renewable generation, like WTs and PVs, are analyzed in detail.
(2) Based on the characterization of the formulated model, we develop a multi-objective reactive power optimization method, where the renewable curtailment, operational cost, and voltage offset are considered.
The remainder of this paper is as follows. The power system model considering large-scale renewable integration is presented in Section 2. The multi-objective reactive power optimization method is developed in Section 3. The case study and conclusion are given in Section 4 and Section 5, respectively.
In this paper, the doubly-fed induction generator (DFIG) with certain reactive power regulation ability is taken as the research object. Its output active power is described according to the change of wind speed, which can be expressed as (Kuang et al., 2022):
where PWT is the output active power of the WT; PWT,rate is the rated active power of the WT; vin and vout are cut-in and cut-out wind speed, respectively; vrate is rated wind speed.
As shown in Figure 1, when DFIG participates in reactive power regulation of the power system, its regulation ability is mainly determined by the capacity of the stator side and grid side rectifier. The output power constraints on the stator side are (Zhou et al., 2020):
where PWT,s and QWT,s are the active and reactive power output of the stator side of the WT, respectively; UWT,s and IWT,s are the voltage and current of the stator side of the fan, respectively; XWT,s and XWT,m are the leakage reactance and excitation reactance of the stator side of the fan, respectively; IWT,R is the rectifier current on the rotor side of the fan. Ignoring the reactive power consumed by the rectifier, the actual active and reactive power outputs of the DFIG are:
where w is the slip rate of DFIGURE After the actual output power of DFIG is determined according to Eq. 1, its reactive power regulation capability (QWT,T,min, QWT,T,max) can be determined as:
where IWT,R,max represents the maximum rectifier current on the rotor side.
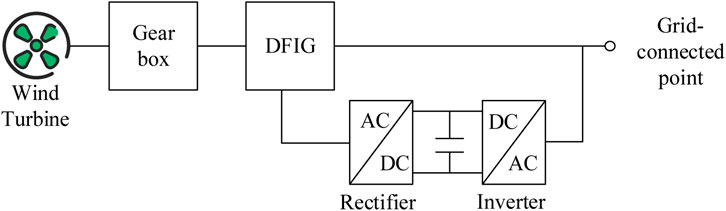
FIGURE 1. Structure of DFIG.
As shown in Figure 2, the photovoltaic unit is mainly composed of a photovoltaic panel, AC-DC rectifier, DC-AC inverter, filter circuit and control system. The AC-DC rectifier is used for boosting to realize the maximum power point tracking (MPPT) control, and then connected to the grid through a DC-AC inverter. Its output power at the grid-connected point can be expressed as (Ai and Ding, 2020):
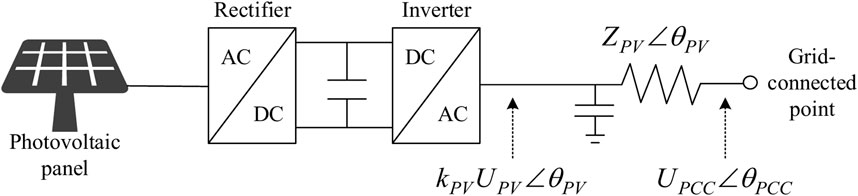
FIGURE 2. Structure of photovoltaic unit.
In the above equations, kPV is the modulation ratio of the photovoltaic inverter, which is used to restrict the output voltage of the photovoltaic unit and ranges from (0, 1); UPV and UPCC are the voltage amplitudes of the photovoltaic unit and its grid-connected point, respectively; GPV and BPV are the equivalent conductance and susceptance of the photovoltaic unit, respectively. In addition, the output power of the photovoltaic unit is also constrained by the grid-connected point voltage and capacity.
Defining the equivalent impedance of the photovoltaic unit as:
We can formulate the power constraint of the grid-connected point as follows.
The renewable-based power system model mainly describes the power balance at the buses and branches. Considering the photovoltaic and wind power integration, they can be expressed as:
where Ui, θi are the voltage amplitude and phase angle of bus i; Pi and Qi are the net injected active and reactive power of bus i; PG,i, QG,i are the active and reactive power outputs of the generator at bus i; PL,i, QL,i are the active and reactive loads at bus i; PPV,i, QPV,i are the active and reactive power outputs of the photovoltaic unit at bus i; PWT,i, QWT,i are the active and reactive power output of the WT at bus i; Gij and Bij are the conductance and susceptance between buses i, j; Pij, Qij are the active and reactive power flow between buses i, j.
Considering the stability, cleanliness and economic requirements of power system operation, this paper establishes an objective function with the objectives of minimizing operational costs, renewable curtailment, and voltage offset.
The objective function f1 represents the objective of minimizing the operational cost, which is expressed as:
where α1-3 are the constant coefficients of the generator set.
The objective function f2 represents the objective of minimizing the renewable curtailment, which is expressed as:
where ηPV,t and ηWT,t are the curtailment rates of photovoltaic units and wind turbines at time t, respectively.
The objective function f3 represents the objective of minimizing voltage fluctuation, which is expressed as:
where Ui,rate represents the reference voltage amplitude of bus i. In this paper, the penalty factors are introduced to integrate the three types of objective functions, i.e., renewable curtailment and voltage offset will undertake certain economic losses. In this condition, the multiple objective functions can be reconstructed as:
where cPV,t and cWT,t are the unit penalty costs of abandoning solar power and wind power at time t, respectively; ci is the unit penalty cost of the voltage fluctuation at bus i.
In large-scale power systems, the computational burden of the optimization problem considering the detailed AC power flow model is very considerable, which is not conducive to a direct solution. Therefore, this paper adopts an improved DC power flow model for transmission networks to simplify the non-linear equations in Eqs 11–14. In the transmission network, the differences between phase angles of different buses are usually very small, and the voltage amplitude is often close to 1.0 p.u. Based on these simplifications, we can use Taylor expansion to simplify Eqs 11–14, as shown below.
Substituting Eqs 19, 20 into the first equation in Eqs 11, 12, we can get (Zhang et al., 2022):
In addition, the reactive power regulation of the power system needs to meet the following security constraints:
where Ui,max and Ui,min represent the upper and lower limits of the voltage amplitude of bus i, respectively; PG,i,max and PG,i,min represent the upper and lower limits of the active power output of the generator at bus i, respectively; QG,i,max and QG,i,min represent the upper and lower limits of the reactive power output of the generator at bus i, respectively; Sij,max represents the maximum branch apparent power flow between buses i, j.
Besides the reactive power constraints, the power system operator can determine the actual consumed wind power at each time step, which is expressed as:
where PWT,t,max represents the maximum output active power of WT at time t. For photovoltaic units, the model described in Section 2.2 presents the strong non-linearity, which is not conducive to solving the optimization model. Therefore, this section further analyzes the operating characteristics of the grid-connected photovoltaic unit, to appropriately simplify the model and improve the solvability of the corresponding optimization problem.
In general, the equivalent impedance ZPV of the photovoltaic unit is a constant, and the voltage amplitude UPCC of the grid-connected point fluctuates very little. Therefore, the term (UPCC)2/ZPV can be regarded as a constant (Mao et al., 2019). By characterizing Eq. 10 to the polar coordinate domain, the left side of the equal sign can be regarded as the operating domain composed of the capacity of the photo-voltaic unit, as shown in the blue solid line section of Figure 3. The right side of Eq. 10 can be regarded as the operating domain formed by the voltage amplitude constraint of the grid-connected point.
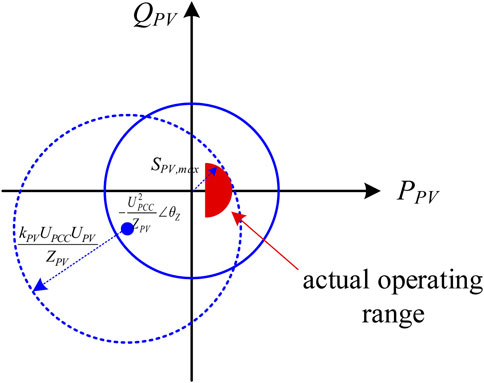
FIGURE 3. Feasible region of photovoltaic unit.
Mathematically, the operating domain described on the right side of Eq. 10 can be understood as follows. When (UPCC)2/ZPV is fixed, the operating domain of the photo-voltaic unit is a circle formed by taking (UPCC)2/ZPV∠θZ as the center and kPVUPCCUPV/ZPV as the radius. The radius of the operating interval is determined by the modulation ratio of the photovoltaic inverter and the voltage amplitude of the photovoltaic unit, as shown in the blue dotted part of Figure 3. Therefore, the basic operating range of the photovoltaic unit can be regarded as the intersection of the blue solid line and the blue dotted line. Further, considering the harmonic and frequency constraints (Zhao et al., 2018; Zhao and Chen, 2021), the operating constraints of the PV unit can be further characterized as Eqs 27, 28.
where SPV,max represents the maximum rated capacity of rectifier and inverter considering grid-connected harmonic and frequency constraints, PPV,t,max represents the maximum output active power of photovoltaic unit at time t, α represents the critical ratio of output active power considering grid-connected harmonic and frequency constraints, as shown in the red part of Figure 3.
Combined with Section 3.1 to Section 3.3, the multi-objective reactive power optimization model of power system suitable considering large-scale renewable integration in this paper can be summarized as follows:
where, the first row of the constraint corresponds to those from the power system side, the second row corresponds to those from the wind turbine side, and the third row corresponds to those from the photovoltaic unit side. The variables to be optimized include the active and reactive power output of the generator at each time step, the actually-consumed active power of the WT and PV unit, and the output active power of the renewable energy participating in the voltage regulation.
In this paper, the IEEE 30-bus standard test system with some modifications is adopted as the power system with large-scale renewable integration (Wang et al., 2022). All the settings and data are the same as those in the original IEEE 30-bus test system, while several renewables are connected at several buses. As shown in Figure 4, the power system is connected to photovoltaic units at buses 3, 7, 10, and 28, and WTs at buses 5, 15, 17, and 30. The optimization period is 24 h, and the optimization time interval is 1 h. The simulation is performed on a desktop computer with Intel i7-7410U CPU and 8GB RAM. The coding environment is Matlab 2018b, and the solver is IPOPT. Specifically, IPOPT is a mature commercial software that uses interior point optimizer to solve the non-linear optimization problems.
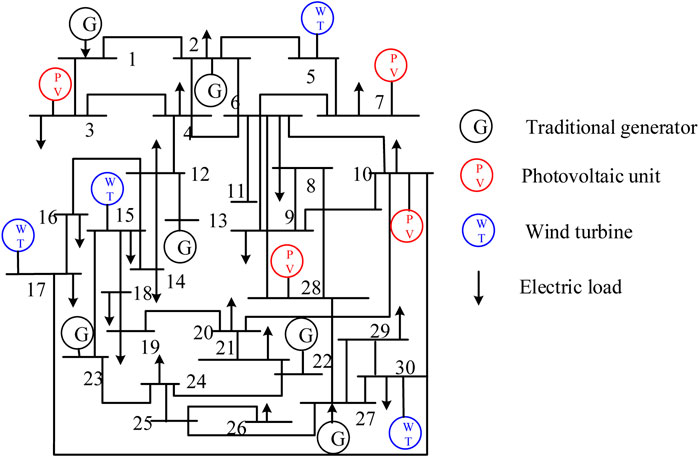
FIGURE 4. Structure of power system with renewable integration.
The electric load rate, the output curve of each photovoltaic unit, and the output curve of the wind turbine are shown in Figure 5. In scenario 1, renewable energy participates in the reactive power regulation. In scenario 2, the renewable energy does not participate in reactive power regulation.
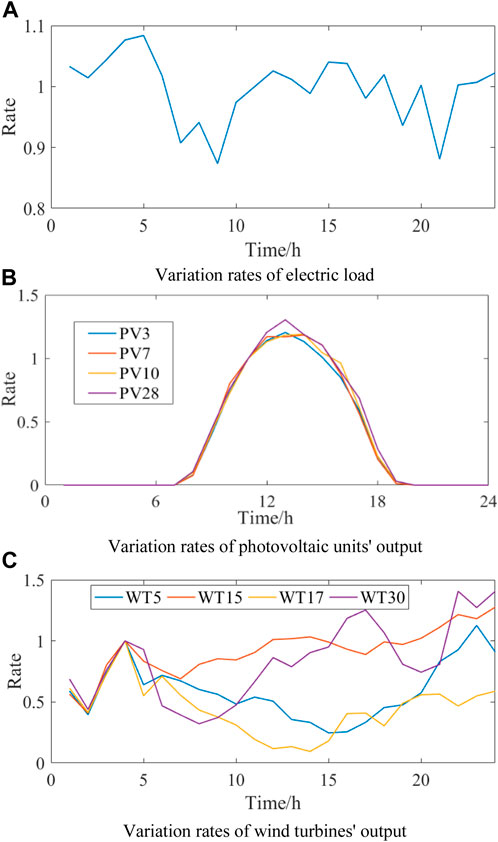
FIGURE 5. Variation rate in case study. (A) Variation rates of electric load. (B) Variation rates of photovoltaic units’ output. (C) Variation rates of wind turbines’ output.
In this part, the impacts of renewable integration on reactive power optimization and voltage regulation are analyzed. The simulation results are shown in Figure 6 and Table 1. According to Table 1, almost all the renewable generation realizes 100% consumption of solar and wind power in different scenarios. This is because the use of photovoltaic units and WTs in the cases does not need to undertake its operational costs, and the unit penalty of renewable curtailment is distinct. As a result, the operators are more inclined to consume renewable energy for power supply, thereby reducing the operational cost of the traditional generators. However, due to the integration of renewable energy, the system presents a multi-source state, and its voltage level fluctuates more significantly. Therefore, the voltage offset in scenario 2 is larger and the maximum value is up to 0.054 p.u. Correspondingly, the penalty of voltage offset in scenario 2 is higher than that in scenario 1. On the contrast, scenario 1 makes full use of the reactive power regulation capability of the WTs and PV units. In this condition, the active and reactive output of the WTs and PV units are optimized according to the operational constraints in the power system. Moreover, due to the renewables’ participation in reactive power compensation and voltage regulation, the maximum voltage deviation in the power system is reduced by 67%, as shown in Figure 6A. As the voltage offset penalty in scenario 1 is reduced by 597.81$, the total operational cost is also significantly reduced by about 6.4%. In particular, the impact of renewable integration on voltage regulation also varies distinctly according to the different constraints of voltage amplitude and their reference values. For example, the photovoltaic units connected to each bus all act as the reactive load and participate in the voltage regulation. On the contrary, the WTs connected to the bus 5 and bus 30 act as the reactive power sources and then participate in the voltage regulation, as shown in the comparison between Figures 6B, C.
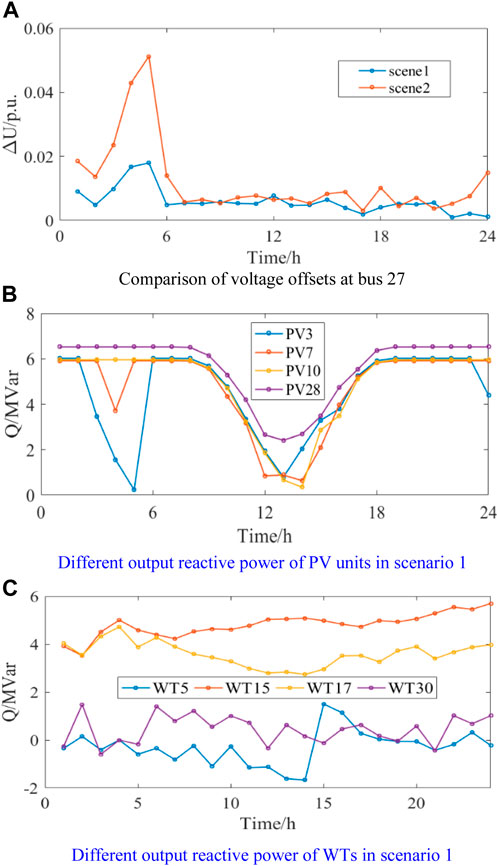
FIGURE 6. Comparisons between scenarios 1 and 2. (A) Comparison of voltage offsets at bus 27. (B) Different output reactive power of PV units in scenario 1. (C) Different output reactive power of WTs in scenario 1.
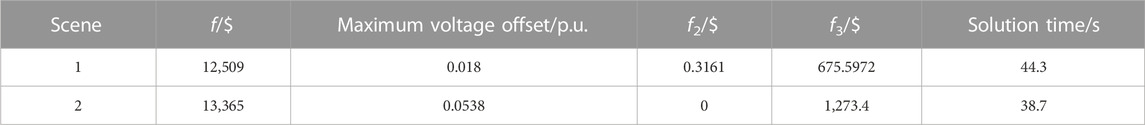
TABLE 1. Results of reactive power optimization.
According to the simulation results, although the large-scale integration of renewable energy will affect the active power distribution in the power system, the rational use of its reactive power regulation ability can effectively improve the overall voltage level, thereby improving operational stability.
As for the solution time, the solver IPOPT takes 44.3 and 38.7 s to solve the problems in scenarios 1 and 2, respectively. Although the non-linearity in the power flow equations will bring some computational burden, the results indicate that the optimization problem can still be solved effectively with IPOPT. Besides, there are no distinct differences between scenarios 1 and 2 in solution time. This is understandable because the reactive power regulation of the renewables only adds several linear constraints into the optimization problem, while the problem scale is slightly influenced.
This section further analyzes the impact of renewable energy participation in reactive power regulation on power system operation by setting different unit penalties of renewable curtailment and voltage offset. Firstly, setting the unit penalty of renewable curtailment as constant, we test how total operational cost varies with the unit penalty of voltage offset. The optimized results are shown in Figure 7.
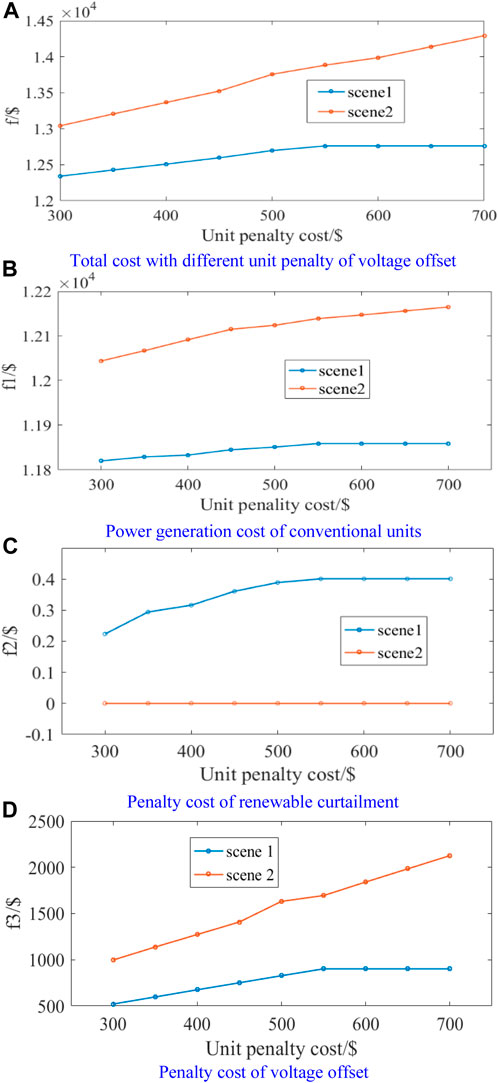
FIGURE 7. Influence of voltage offset penalty cost. (A) Total cost with different unit penalty of voltage offset. (B) Power generation cost of conventional units. (C) Penalty cost of renewable curtailment. (D) Penalty cost of voltage offset.
According to Figure 7, the various operational costs in scenario 1 all gradually increase with the increment of unit penalty of voltage offset. When the unit penalty of voltage offset increases to 550$/p.u., the increment of f3 is greater than the sum of those corresponding to f1 and f2. Therefore, in the subsequent operational optimization, the power system aims to minimize the voltage offset cost, and different state variables mainly remain stable because the traditional generators have reached their maximum ability for regulation. In scenario 2, since the renewable energy is not involved in reactive power optimization, the power system’s ability to regulate the voltage level is limited. As a result, the overall reactive power capacity of conventional units in the power system cannot meet the demand of minimizing voltage offset. Therefore, as the unit penalty of voltage offset increases, all kinds of operational costs continue to increase, and the corresponding growth rates are larger than those in scenario 1. To summarize, large-scale renewable integration provides a certain reactive power capacity for operational optimization and voltage regulation of the power system. This helps to improve the operation economy of the system, and the improvement is gradually obvious with the increasing demand for voltage stability.
Then, we firstly set the unit penalty cost of voltage offset to 400 $/p.u. and keep it constant. By gradually increasing the unit penalty cost of renewable curtailment, the impact of renewable integration on reactive power optimization is studied. The optimization results are shown in Figure 8. It can be seen from the figure that the variation in unit penalty cost of renewable curtailment has little effect on the operational cost in this case. Consequently, its impact on the total operational cost is almost negligible. This is because, in this case, the consumption of solar and wind power does not need to undertake additional costs. In this context, the power system is always in the operation state of 100% renewable energy consumption. Therefore, no matter how the unit penalty cost of renewable curtailment changes, the required output of conventional generating units is almost constant and the total operational cost remains constant. However, as the unit cost of renewable curtailment gradually increases, the power system gradually optimizes its output active and reactive power to reduce the penalty of solar and wind power curtailment in scenario 1. This adjustment affects the voltage level correspondingly, causing the voltage offset penalty in scenario 1 also gradually increases, as shown in Figure 8B. In summary, without considering the cost of renewable energy generation, the voltage offset penalty is the main factor affecting the system operational cost. From this point of view, the participation of renewable energy in reactive power optimization has a significant improvement in the economy and stability of operation as well.
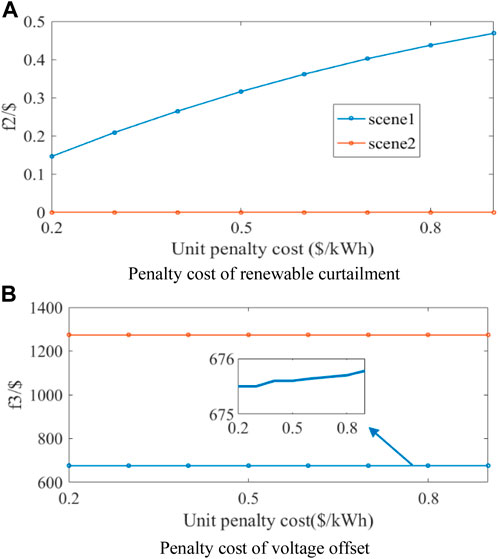
FIGURE 8. Influence of renewables curtailment penalty. (A) Penalty cost of renewable curtailment. (B) Penalty cost of voltage offset.
This paper studies the multi-objective reactive power optimization of power system with large-scale renewable energy integration. Firstly, considering the difference in topology and operation characteristics between the wind turbine and photovoltaic unit, the active and reactive power output capacity of renewable energy is modeled in detail. Then, a multi-objective reactive power optimization model is established to minimize the power generation cost of conventional units, the penalty cost of wind and light curtailment and the voltage offset cost, considering the operational constraints of the power system and various power generation units. Finally, aiming at the strong non-linear characteristics of the optimization model, the improved DC power flow is used to simplify the AC power flow model. According to the characteristics of photovoltaic and wind turbines and grid-connected constraints, the output model is modified, so that the original strong non-linear optimization problem is transformed into a weak non-linear problem, which is easy to solve directly. The simulation shows that renewable energy participating in reactive power optimization can effectively reduce the output of conventional units. Although this in-creases the cost of wind and light curtailment in system operation, it has a significant improvement effect on maintaining the stability of voltage level in the region.
In the next research, the multi-objective and multi-agent problems of multi-regional power system participating in reactive power optimization under the condition of large-scale renewable energy grid connection will be further considered, and the improvement effect of regional interconnection on promoting renewable energy consumption and reactive power optimization will be fully explored.
The original contributions presented in the study are included in the article/supplementary material, further inquiries can be directed to the corresponding author.
XM: programming, drafting the manuscript. ZG: conception and design of study. HS: supervision. CL: data analysis and proofreading. XD: methodology. All authors contributed to the article and approved the submitted version.
This research was funded by the Science and Technology Program of State Grid Gansu Electric Power Company, Grant Number: 52272223001F; Gansu Youth Science and Technology Program, Grant Number: 21JR7RA745.
Authors XM, CL, XD, and YL were employed by State Grid Gansu Electric Power Company.
The authors declare that this study received funding from State Grid Gansu Electric Power Company. The funder had the following involvement in the study: data support and paper supervision.
All claims expressed in this article are solely those of the authors and do not necessarily represent those of their affiliated organizations, or those of the publisher, the editors and the reviewers. Any product that may be evaluated in this article, or claim that may be made by its manufacturer, is not guaranteed or endorsed by the publisher.
Adaryani, M., and Karami, A. (2013). Artificial bee colony algorithm for solving multi objective optimal power flow problem. Int. J. Electr. Power Energy Syst. 53 (11), 219–230. doi:10.1016/j.ijepes.2013.04.021
Ai, Y., and Ding, J. (2020). Study about optimization scheduling method of economic benefit for grid-connected household photovoltaic systems. IEEJ Trans. Elec Electron Eng. 15, 527–535. doi:10.1002/tee.23085
Ai, Y., Du, M., and Pan, Z. (2021). The optimization of reactive power for distribution network with PV generation based on NSGA-III. CPSS Trans. Power Electron. Appl. 6 (3), 193–200. doi:10.24295/cpsstpea.2021.00017
Bolognani, S., Carli, R., and Zampieri, S. (2015). Distributed reactive power feedback control for voltage regulation and loss minimization. IEEE Trans. Autom. Control. 60 (4), 966–981. doi:10.1109/tac.2014.2363931
Duan, J., Xue, B., and Chen, L. (2017). Reactive power optimisation of distribution network with dispersed wind farm. J. Eng. 17 (13), 1983–1987. doi:10.1049/joe.2017.0676
Hui, Q., Yang, J., Yang, X., Chen, Z., Li, Y., and Teng, Y. (2019). A robust control strategy to improve transient stability for AC-DC interconnected power system with wind farms. CSEE J. Power Energy Syst. 5 (2), 259–265. doi:10.17775/cseejpes.2019.00250
Kuang, H., Su, F., Chang, Y., Kai, W., and Zhiyi, H. (2022). Reactive power optimization for distribution network system with wind power based on improved multi-objective particle swarm optimization algorithm. Electr. Power Syst. Res. 213, 108731. doi:10.1016/j.epsr.2022.108731
Li, S., Li, X., Kang, Y., and Gao, Q. (2022). Load capability assessment and enhancement for transformers with integration of large-scale renewable energy: A brief review. Front. Energy Res. 10, 1002973. doi:10.3389/fenrg.2022.1002973
Li, Y., Sun, B., Zeng, Y., Dong, S., Ma, S., and Zhang, X. (2022). Active distribution network active and reactive power coordinated dispatching method based on discrete monkey algorithm. Int. J. Electr. Power Energy Syst. 143, 108425. doi:10.1016/j.ijepes.2022.108425
Li, Z., Wu, L., and Xu, Y. (2021). Risk-averse coordinated operation of a multi-energy microgrid considering voltage/var control and thermal flow: An adaptive stochastic approach. IEEE Trans. Smart Grid 12 (5), 3914–3927. doi:10.1109/tsg.2021.3080312
Li, Z., Xu, Y., Fang, S., Wang, Y., and Zheng, X. (2020). Multiobjective coordinated energy dispatch and voyage scheduling for a multienergy ship microgrid. IEEE Trans. Indus. Appl. 56 (2), 989–999. doi:10.1109/tia.2019.2956720
Lin, S., Huang, Y., and Lia, C. (2023). Wind SRG-based bipolar DC microgrid with grid-connected and plug-in energy supporting functions. Energies 16, 2962. doi:10.3390/en16072962
Mao, W., Zhang, X., Hu, Y., Zhao, T., Wang, F., Li, F., et al. (2019). A research on cascaded h-bridge module level photovoltaic inverter based on a switching modulation strategy. Energies 12, 1851. doi:10.3390/en12101851
Sulc, P., Backhaus, S., and Cherrkov, M. (2014). Optimal distributed control of reactive power via the alternating direction method of multipliers. IEEE Trans. Energy Convers. 29 (4), 968–977. doi:10.1109/tec.2014.2363196'
Tang, Z., Hill, D., and Liu, T. (2019). Fast distributed reactive power control for voltage regulation in distribution networks. IEEE Trans. Power Syst. 34 (1), 802–805. doi:10.1109/tpwrd.2018.2868158
Wang, L., Tao, Z., Zhu, L., Wang, X., Yin, C., Cong, H., et al. (2022). Optimal dispatch of integrated energy system considering integrated demand response resource trading. IET Gener. Transm. Distrib. 16, 1727–1742. doi:10.1049/gtd2.12389
Zhang, S., Gu, W., Zhang, X., Lu, H., Lu, S., Yu, R., et al. (2022). Fully analytical model of heating networks for integrated energy systems. Appl. Energy 327, 120081. doi:10.1016/j.apenergy.2022.120081
Zhang, S., Gu, W., Zhang, X., Lu, H., Yu, R., Qiu, H., et al. (2023). Dynamic modeling and simulation of integrated electricity and gas systems. IEEE Trans. Smart Grid 14 (2), 1011–1026. doi:10.1109/tsg.2022.3203485
Zhao, T., and Chen, D. (2021). A power adaptive control strategy for further extending the operation range of single-phase cascaded H-Bridge multilevel PV inverter. IEEE Trans. Ind. Electron. 69 (2), 1509–1520. doi:10.1109/tie.2021.3060646
Zhao, T., Zhang, X., Mao, W., Wang, F., Xu, J., Gu, Y., et al. (2018). An optimized third harmonic compensation strategy for single-phase cascaded H-bridge photovoltaic inverter. IEEE Trans. Ind. Electron. 65 (11), 8635–8645. doi:10.1109/tie.2018.2813960
Zhong, J., Guan, L., Zhang, J., Gong, Y., and Chung, C. Y. (2020). Distributed reactive power regulation considering load voltage and power loss. IEEE Access 8, 24334–24343. doi:10.1109/access.2020.2969817
Zhou, B., Fang, J., Ai, X., Zhang, M., Yao, W., Chen, Z., et al. (2020). Linear network model for integrated power and gas distribution systems with bidirectional energy conversion. IET Renew. Power Gener. 14, 3284–3291. doi:10.1049/iet-rpg.2020.0215
Keywords: reactive power optimization, multi-objective optimization, wind turbine, photovoltaic unit, voltage offset
Citation: Ma X, Liang C, Dong X and Li Y (2023) Multi-objective reactive power optimization strategy of power system considering large-scale renewable integration. Front. Energy Res. 11:1213154. doi: 10.3389/fenrg.2023.1213154
Received: 27 April 2023; Accepted: 23 May 2023;
Published: 06 June 2023.
Edited by:
Zhengmao Li, Nanyang Technological University, SingaporeReviewed by:
Zhao Luo, Kunming University of Science and Technology, ChinaCopyright © 2023 Ma, Liang, Dong and Li. This is an open-access article distributed under the terms of the Creative Commons Attribution License (CC BY). The use, distribution or reproduction in other forums is permitted, provided the original author(s) and the copyright owner(s) are credited and that the original publication in this journal is cited, in accordance with accepted academic practice. No use, distribution or reproduction is permitted which does not comply with these terms.
*Correspondence: Xiping Ma, bWF4cGdzQDE2My5jb20=
Disclaimer: All claims expressed in this article are solely those of the authors and do not necessarily represent those of their affiliated organizations, or those of the publisher, the editors and the reviewers. Any product that may be evaluated in this article or claim that may be made by its manufacturer is not guaranteed or endorsed by the publisher.
Research integrity at Frontiers
Learn more about the work of our research integrity team to safeguard the quality of each article we publish.