
94% of researchers rate our articles as excellent or good
Learn more about the work of our research integrity team to safeguard the quality of each article we publish.
Find out more
ORIGINAL RESEARCH article
Front. Energy Res., 11 September 2023
Sec. Smart Grids
Volume 11 - 2023 | https://doi.org/10.3389/fenrg.2023.1212304
This article is part of the Research TopicDigital Technologies by Empowered Sustainable Electrical Energy DevelopmentView all 10 articles
 Syed Yasir Ahmad1
 Ghulam Hafeez2*
 Khursheed Aurangzeb3
 Khalid Rehman1
 Taimoor Ahmad Khan4
 Musaed Alhussein3
The development of smart grids has revolutionized modern energy markets, enabling users to participate in demand response (DR) programs and maintain a balance between power generation and demand. However, users’ decreased awareness poses a challenge in responding to signals from DR programs. To address this issue, energy management controllers (EMCs) have emerged as automated solutions for energy management problems using DR signals. This study introduces a novel hybrid algorithm called the hybrid genetic bacteria foraging optimization algorithm (HGBFOA), which combines the desirable features of the genetic algorithm (GA) and bacteria foraging optimization algorithm (BFOA) in its design and implementation. The proposed HGBFOA-based EMC effectively solves energy management problems for four categories of residential loads: time elastic, power elastic, critical, and hybrid. By leveraging the characteristics of GA and BFOA, the HGBFOA algorithm achieves an efficient appliance scheduling mechanism, reduced energy consumption, minimized peak-to-average ratio (PAR), cost optimization, and improved user comfort level. To evaluate the performance of HGBFOA, comparisons were made with other well-known algorithms, including the particle swarm optimization algorithm (PSO), GA, BFOA, and hybrid genetic particle optimization algorithm (HGPO). The results demonstrate that the HGBFOA algorithm outperforms existing algorithms in terms of scheduling, energy consumption, power costs, PAR, and user comfort.
Over the last decade, the energy needs of consumers have risen at an exponential rate (Hafeez et al., 2019; Alzahrani et al., 2023). The development of technology, substantial use in industry, and introduction of electric vehicles on the road have led to an increased demand for electricity. It will continue to rise exponentially. Energy consumption from buildings accounts for approximately one-third of the energy that is generated worldwide (Gul and Sandhya, 2015). The United States Department of Energy projects that energy use will increase by 56% in 2040 (United States Department of Energy, 1225). Traditional power grids cannot cope with the current world’s needs because of the enormous increase in energy demand. The concept of smart grids has been developed as a result of reduced effectiveness, environmental concerns (Yu et al., 2023), distributed economic dispatch (Li et al., 2022), distributed grounding layout (Xiao et al., 2022), harmonic power flow (Xie and Sun, 2022), diverse maintenance needs, and reliability issues in the traditional power network (Li et al., 2022). Conventional networks have become a smart grid due to advances in communication technologies and their integration into the electricity infrastructure. Passive customers have become active consumers because of the smart grid. Due to the elastic nature of loads, the success of smart grids lies in the availability of resources like distributed generation (Ribeiro et al., 2020). Figure 1 represents a model of a smart grid.
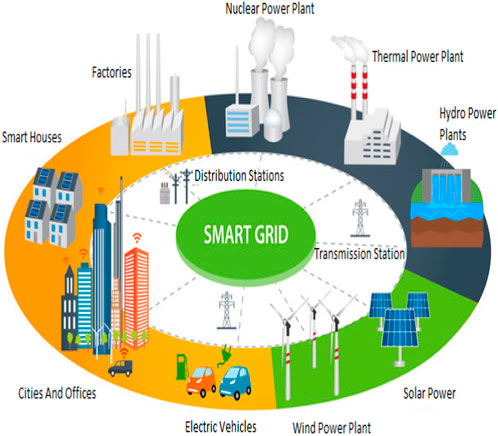
FIGURE 1. Smart grid overview.
Offering incentives in the form of prices revolutionized the traditional power grid and enabled utility companies to change the behavior of consumers in terms of energy consumption (Ma et al., 2016). With the emergence of liberality in the electricity market, efficiency is improved due to better economic solutions provided by the power companies (Ribeiro et al., 2018). Due to smart grids, electric utility companies (EUCs) are able to dispatch price signals to consumers using day-ahead pricing (DAP) signals, time of use (TOU), and real-time pricing (RTP) signals. Therefore, users can modify the load at their own pace. This increases the possibility for electricity consumers to alter their load patterns in accordance with tariffs. However, an intelligent optimization mechanism is extremely necessary in order to prevent peak formation during low hours of the day (Hafeez et al., 2020a). Thus, optimization methods are developed to address various aspects like distribution generation effective utilization (Chen et al., 2022; Sun et al., 2022), reliability improvement (Ma et al., 2021), energy consumption minimization (Min et al., 2023), and industrial applications (Lv et al., 2022). However, electricity theft is a challenge while implementing optimization methods (Yan and Wen, 2021). Load demand management can ensure that consumers’ electricity needs are met. The mechanism for managing the demand mainly consists of demand response (DR) and demand side management (DSM) in particular. A DSM shall be designed with the primary aim of planning consumer load, taking into account the price information provided by the energy companies that use DR. The DSM is a key contributor to the development of various strategies for ensuring grid stability by scheduling electricity generation and the use of renewable resources during periods when peak loads occur in order to balance the load on smart grids. The DSM, through the flexible and diverse development of plans, plays an essential role in ensuring electricity grid stability. In order to reduce the load on the primary grid and prevent the collapse of the whole power system during maximum demand hours, DR encourages consumers to shift their load from peak to off-peak hours (Imran et al., 2020). The DSM’s primary strategy is to move loads through a DR program. Consumers are encouraged to cut their energy consumption at peak times and move loads into cheaper periods of the day through the DSM strategy, which reduces electricity costs and PAR (Gelazanskas and KelumGamage, 2014; Hafeez et al., 2020b). It can be achieved only when bi-directional communication exists between the electricity grid and the energy consumer. Smart meters (SMs), advanced metering infrastructure (AMI), automatically operated appliances (AOAs), energy management controllers (EMC), and renewable energy sources are required for this. The AMI will assist in the exchange of data between a power grid and the consumer’s SM (LiHui and Ho, 2014). Price signals along with time are shared with the consumers so that they can easily adjust their AOAs according to the time slot which suits them. The price changes according to the consumers’ load curve (Barbato and Capone, 2014). DSM must serve many residential, commercial, and industrial consumers to cater to the energy crisis. Nonetheless, residential buildings consume a large amount of energy, so this is a highly preferred research area.
Several techniques and mathematical models have been developed for scheduling residential loads, which helped reduce energy costs and PAR. In order to solve energy problems, optimization techniques such as linear, nonlinear, and mixed-integer programming (MIP) are in use (Huang et al., 2019; Elazab et al., 2021). More efficient solutions for cost reduction are a number of developed mathematical models and other techniques. However, the mathematical model does not seem to be an effective way of scheduling appliances as it demonstrates poor efficiency in solving problems having multiple objectives. Furthermore, taking on a large number of devices that have to be scheduled increases computational time (Albogamy et al., 2022). For instance, to reduce PAR and solve appliance scheduling problems, game theoretic techniques, such as Nash and Stackelberg, are developed. Stackelberg’s method helps smooth out the load curve and fulfill the energy needs of consumers by trading electricity among utility companies (Yu and Ho, 2016; Srinivasan et al., 2017). To address issues of gaming models, control techniques are developed (Wang et al., 2022). For example, an adaptive dynamic control with disturbance observers is developed by Zhang et al. (2022) for energy balancing of a hybrid energy system. Likewise, model predictive control (Wang et al., 2022), distributed power sharing control (Zhao et al., 2022), and finite convergence control (Wang J. et al., 2022) are introduced to solve microgrids’ energy balancing problems. However, battery life prediction, battery utilization for RES, battery charging/discharging scheduling, etc., are ignored (Dang et al., 2023; Gu et al., 2023). Batteries are utilized in renewable energy systems (Cai et al., 2022) to smooth out renewable power generation, and storage technology is cascaded with an energy hub system (Jiang et al., 2022), storage technology-based photovoltaics (Zhang et al., 2022), and solar system development (Huang et al., 2023) for distribution network expansion. However, solar cell-based generation is uncertain and intermittent (Huang et al., 2023). In contrast, grid-connected inverters and composite circuits have power quality issues (Chung et al., 2022; Lin et al., 2022). A methodology for EV tour scheduling in a traffic environment is developed by Zhang et al. (2022). To address such limitations, heuristic algorithms, namely, particle swarm optimization (PSO) along with the genetic algorithm (GA) and bacteria foraging optimization algorithm (BFOA), emerged to resolve the issue of the single-objective optimization problem (Rehman et al., 2021). However, the multi-objective optimization aspect of the energy management problem is ignored (Cao et al., 2020a; Cao et al., 2020b). The authors developed a multi-objective optimization model to decide on the placement of PMU in the power grid (Cao et al., 2022). Likewise, a multi-objective optimization model is developed by Zhang et al. (2023) for a carbon-capturing facility in microgrids. A DSM model is solved using the BFA algorithm by Priya Esther et al. (2016). Similarly, the energy management problem is solved using GA for smart grid cost optimization. However, GA has the relevant characteristics of exploration but is limited only to the local best solution. On the other hand, BFA is more suited to exploitation but has drawbacks of obtaining a personal best solution. We used a hybrid bacteria foraging and genetic algorithm, the HGBFOA, which allows us to achieve a global best solution for multi-objective optimization problems by combining GA and BFA (Sarker et al., 2021).
So far, sufficient research has been carried out to improve energy efficiency in the smart grid. There are also some limits to most of the methods under discussion, which have certain prominent features. The authors were able to solve a lot of objectives with the help of mathematical models in many research works. However, in the case of loads that are spontaneous and have a non-linear effect, it is not possible to use mathematical techniques. Moreover, the techniques are, in essence, complicated and require a long period of time to arrive at an optimum solution. Compared to this, some of the algorithms have suffered from early convergence that leads to the loss of a number of algorithm features such as parameter substitution, population diversity, and ending criteria. However, the aforementioned techniques either cater to PAR, energy cost, user comfort maximization, or scheduling problems, but none of the aforementioned methods catered to all the objectives at the same time. In our research work, a hybrid algorithm (HGBFOA) that addresses all the aforementioned features simultaneously is considered.
The research work is setup in the following manner: Section 2 presents the related work, Section 3 shows the research methodology along with system modeling, and Section 4 presents details of the existing and suggested system models. Simulation and results are discussed in Section 5, while Section 6 provides an idea about future extensions.
In the smart grid field, research is conducted to obtain better energy management by scheduling AOAs. In the study by Samadi et al. (2010), plug-in hybrid electric vehicles are introduced. The demand for energy from consumers is rising as a result of introduction of new and up-to-date electrical equipment with high power demand, leading to interruptions in the entire power system. Two easy ways of meeting users’ requirements are present, i.e., the electricity generation companies must increase generation by building new plants or scheduling consumer appliances for efficient energy management. The foremost method is costlier because to increase generation, we have to construct new power plants along with the current power plants, which needs considerable funding. This will also lead to complexity in power transmission and distribution. In comparison, the second technique will have to manage the current requirement by introducing various pricing techniques for 24 h. A direct load control (DLC) method is presented by Abdollahi et al. (2011). Using the DLC method, the utility can manage the power consumption and demand by providing incentives to consumers for decreasing power usage during high-demand hours while shifting load to low-demand hours. However, an inclining block rate (IBR) with RPT and TOU is initiated to avoid a peak in off-peak hours (Zhao et al., 2013; Rastegar et al., 2016). The home energy management system (HEMS) algorithm is proposed by Abushnaf et al. (2016), which minimizes the electricity cost and power usage through appliance scheduling using TOU pricing criteria. The AOAs are monitored, controlled, and scheduled using HEMS (Zhou et al., 2016). In order to reduce PAR, HEMSs provide timeslots for each device. During these timeframes, automated equipment is scheduled according to various price signals from power companies. However, in many publications, the time allotted to each device is long enough, which some devices, such as kettles, juicers, and blenders, cannot achieve. Ma et al. (2016) considered the drawbacks of large timeframes, but user comfort is already compromised. User comfort is formulated by Zhou et al. (2016) by considering latency minimization and device energy consumption. In the study by Hafeez et al. (2020a), extensive research was conducted, and some exact algorithms were discussed. However, the issue of user convenience is also present if you want to reduce power consumption. One of the major drawbacks of this research is the lack of integration of renewable energy sources into the smart grid. There is no conceivable energy system that does not integrate renewable energy sources (Zafar et al., 2013). In the study by Adika and Wang (2014), MINLP is explained using RTP, which reduces energy consumption by scheduling thermal and electrical devices to minimize energy costs and maximize user comfort. Performance is very effective on different models. However, the computational complexity of this technique is a drawback. The authors addressed user-initiated changes in device scheduling (Jovanovic et al., 2016). However, the specified changes had to be fulfilled the next day, increasing consumer dissatisfaction. Hafeez et al. (2019) solved this problem by allowing the consumer to turn off one device and turn on another at the user’s request. Adika and Wang (2014) considered an energy storage system that reduces electricity costs and peak loads by almost a factor of five through scheduling through linear programming. The evolutionary algorithm (EA) in the study by Azar and Jacobsen (2016) was used to address the three goals of reducing power costs, maximizing power demand, and reducing carbon emissions. Elkazaz et al. (2016) used distributed generation (DG) to enable the bidirectional current flow, effectively reducing device latency and minimizing energy costs. However, installation, maintenance, and operating costs were completely ignored. Lokeshgupta and Sivasubramani (2019) and Muhsen et al. (2019) worked on reducing electricity costs and peak demand using linear programming (LP) and EA, respectively.
The aforementioned model is a valuable source of literature suitable for energy management. Few models are efficient for some specific goals and restraints. For example, one model considered PAR, another considered energy cost, whereas some techniques combined PAR and energy cost. However, other models took into consideration CO2 emissions and user comfort in relation to price. The model described previously does not take advantage of the beneficial aspects of smart grids that simultaneously consider PAR, energy costs, user comfort, and energy consumption. Moreover, coordination between devices has been neglected in most studies, and adding renewable resources and other targets to already installed infrastructure has not been considered in the aforementioned literature. Therefore, we need a system model that integrates renewable energy sources and implements inter-device coordination to simultaneously consider PAR, energy costs, user comfort, and power consumption. With this motivation, an efficient and effective technique is proposed in our research paper. Renewable energy is added to the smart grids for energy management optimization and DR. Considering RES along with other goals of this study allows us to model efficient and cost-effective systems that can meet today’s world’s energy demands.
The suggested HGBFOA-based HEMS model consists of the main components discussed in the following sections. The functions and possible uses of all the components are described in following headings.
The proposed residential energy management system is presented in this section. The energy management scheduling problem is solved with AMI. The EMS consists of the EMC, smart meter, intelligent devices, in-home display (IHD), home area network (HAN), and power company, along with the power station, as presented in Figure 2.
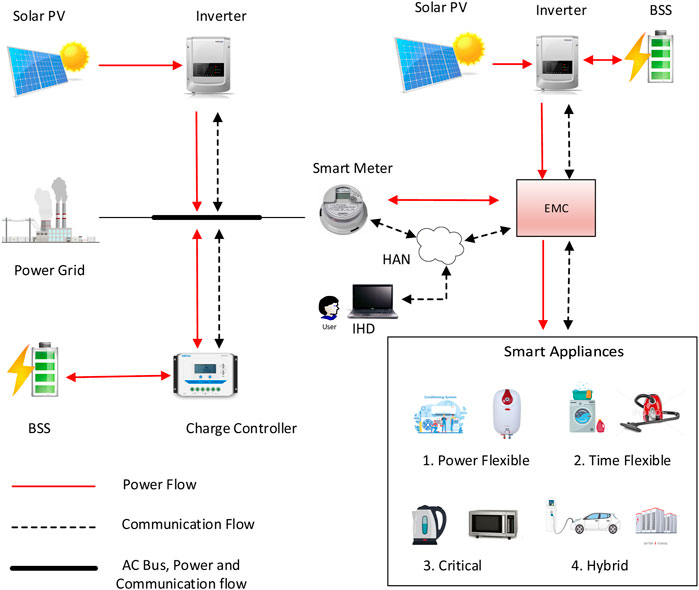
FIGURE 2. Proposed system model.
Smart energy meters collect device energy usage data from the energy management controller. Communication between smart meters and EMC is enabled by HAN. AMI can be considered the backbone of a smart grid. The AMI, present between the SM and the power company, can send price signals from the power company, and accordingly, the consumer can accordingly schedule their smart devices. The consumers’ demand data collected by the smart meter is sent to the power company via AMI (Shirazi and Jadid, 2015). In response, a real-time DR signal from the power company is sent to the smart meter. The IHD helps schedule appliances within EMC, according to the utility company’s demand response signals. Our hybrid algorithm, i.e., HGBFOA, is implemented in EMC to schedule appliance operations according to the power rating and type. This EMC, based on HGBFOA, responds to energy price data, taking into account device operating time, device power rating, and user preferences for device operation.
The inputs to the presented EMS are grid power, the pattern of power consumption with a power rating of AOAs, and the demand response. However, sharing generation and consumption information in advance may create a security issue (Lv and Song, 2019; Lv et al., 2020a; Lv et al., 2020b; Cao et al., 2020c). Detailed description of the system input is as follows.
The residential load is classified into four types, i.e., flexible power appliances, time flexible/elastic appliances, hybrid appliances, and critical appliances. The time of operation of various residential loads is given by Eq. 1.
The time interval during which appliances are in operation is represented by
As the name suggests, devices that operate 24/7 and consume power between the maximum and minimum ranges are power-flexible appliances. For the user’s comfort, delayed operation of these devices is not possible. Instead, these devices always work. Heating, ventilation, and air conditioning (HVAC), electric water heaters (EWHs), and refrigerators (Ref) are examples of energy-flexible appliances considered in this study. The following equations are used to model HVAC, EWHs, and Ref. Modeling of these loads is necessary because they consume power between the minimum and maximum values.
Equation. 2 proves that the temperature of the power-flexible appliances is in the specified range.
To check whether the appliance should be turned on/off, the temperature is determined to see whether it exceeds the consumer’s desired range of when the device will power on. If the temperature is below the required range, the appliance will power off for the initial interval described by Eq. 5. Mathematically, various energy flexible appliances are detailed in the following paragraphs.
HVAC: This equation takes into account the indoor–outdoor temperature differences, activity levels, and occupancy to provide a mathematical model for HVAC systems to maintain temperatures within specified limits.
Here,
Electric water heater: Water heater is used at different times of the day. For maximum user comfort, the water temperature should be kept within certain limits. Usage patterns change depending on the weather and the weekdays. The EWH operating limits are given by Eq. 5.
The temperature of the water heater is expressed by the variation between the initial and hot water temperatures, water usage pattern, the room temperature, and the ON/OFF state of the EWH.
An appliance that is in operation only for certain time intervals is a time-stretchable or time elastic appliance. These appliances should be in operation during low demand or mid-peak hours. We can also slow down the operation of these devices to reduce the consumer’s energy costs and PAR of the utility. Appliances that can be flexible with time are washing machines, dryers, and vacuum cleaners.
Dishwasher, washing machine, and dryer: The constraints of such appliances are shown in Eq. 6:
These are time-flexible devices and should be operated at the most reasonable time according to the user’s demands. Unlike other household appliances, washers and dryers must operate in a specific order, i.e., the dryer should be run after the washing machine run stage. It shall not turn on before the washing machine run stage. Eqs 7, 8 represent the model equations as follows.
The first equation avoids running the washer and dryer in parallel. The second equation ensures that the functions of these devices remain in the correct order and that the dryer starts only after the washer time has expired.
Critical equipment have a short run time and need to start as soon as the consumer wants them to start, so they cannot be delayed. These devices are only used for short periods of time. Examples of this type of equipment include kettles, microwave ovens, juicers, and blenders.
Kettles, ovens, and blenders: These appliances cannot be interrupted during operation and have fixed power requirements. Eq. 9 expresses it.
Critical load is represented by C.L, and
Hybrid devices are a flexible device category in terms of both performance and time. Hybrid devices consume power between the maximum and minimum values, and their operation can also be delayed until a timeslot convenient for consumers and utilities. Examples of such devices are electric vehicles (EVs) and battery storage systems (BSS). Mathematically, these devices are represented as follows:
Electric vehicles and BSS: Due to technological advancement and user convenience, every home consumer has some kind of storage device (Mary and Rajarajeswari, 2014). To minimize the cost and flatten the load curve, such devices charge during low-price hours and discharge during high-demand hours. The batteries’ required initial charge is required to extend the life of the storage system. Therefore, these storage devices must maintain a certain level of energy before being fully discharged. The generalized model for ESS is as follows:
Equation 10 describes the energy stored in the battery and assumes a known charge–discharge interval. Equation 11 states that the stored energy should be within a certain interval to avoid overcharging or over discharging. This is necessary for the storage system life. The EV and BSS energy storage is given by Eq. 12 and relies on the initial charge or discharge in that particular timeslot.
DAP: DAP is a type of DR method. In this process, the electricity supplier, the energy company, and the consumer agree to buy or sell electricity prices 1 day in advance. Once an agreement is reached, whether the actual price is lower or higher than the agreed price, it cannot be changed for the day.
The EMC based on HGBFOA receives the DAP signal from the power company to schedule the operation of residential appliances, which is monitored using IHD.
Electricity is obtained from various resources, including conventional and non-conventional resources. However, non-conventional energy sources, such as solar PV, wind power, and tidal/wave, along with fuel cells, are readily available. Among the mentioned power sources, solar power is very important in today’s world because it is free, widely available, and easy to install. Solar power reduces carbon emissions, minimizes PAR, and helps reduce overall energy costs. The energy produced from photovoltaics is given by Eq. 13 (Zhongming et al., 2019; Dang et al., 2023).
The main purpose of battery storage systems is to provide an alternative power source to minimize CO2 emissions and maximize power reliability. The battery is installed together with the photovoltaic system. During the day, the battery is charged when the power generation is high and the consumption is low. During peak hours and nights, this stored energy powers the load. Powering loads during peak periods and charging during off-peak and mid-peak periods help minimize energy costs (Gu et al., 2023). It also helps maintain the grid stability by powering critical loads. Eq. 14 describes the battery charging and discharging mechanism.
Energy stored in KWH at time t is presented by ES, and the hourly duration is shown by
To optimize power usage, EMC receives the DAP signals from the utility companies, power signals from PV, and consumer priorities. Based on this, the efficient power usage pattern of the house is determined.
The EMC receives input in the form of appliance patterns and generation sources. It processes this input and generates an output in the form of an optimal power consumption pattern for the devices. Depending on the device’s efficient power plan, the results achieved are lower energy costs, lower carbon emissions, minimized PAR, and maximized user comfort. This coordination between appliances helps maintain an optimized schedule for devices. The results are discussed in the following sections.
Energy cost is the bill that the consumers have to pay for electricity consumption. The power company will send the DAP signal to the user, and energy costs will be calculated based on the pricing signal. Research shows that users who followed DR signals and set their devices at different times of the day saw significant reductions in utility bills due to peak hours, mid-peak hours, and off-peak hours. The utility will calculate the DAP signal-related bill based on formula (18).
Here,
In this study, we examined various types of devices and their energy consumption is mathematically represented in Eq. 19.
Time-flexible appliance’s energy consumption in each hour is shown by
Equation 21 shows the energy consumption of power-flexible appliances for a timeslot.
The energy consumed by power-flexible appliances in 24 h is given in Eq. 22.
Here,
The power usage of critical appliances is presented in Eq. 23. The energy and power consumed by these appliances is denoted by
The overall hours of consumption of critical appliances is shown in Eq. 24.
Equation 25 gives the energy consumption of hybrid appliances, and energy consumption of these appliances is represented by
The 24 h energy consumption of hybrid appliances is shown in Eq. 26.
The total 24 h consumption of all appliances is formulated in Eq. 27.
Here,
PAR means the peak to average energy consumption ratio over a specified period. DR shifts loads from peak to off-peak hours by encouraging consumer compliance. As a result, the energy supplier’s load curve is smoothed and peak-free. For this reason, energy providers do not need additional power plants to operate during this time. This greatly reduces the user’s electricity bill. Equation 28 shows the mathematical formula for PAR, where
Consumer comfort is an objective that is computed by device operation delay, indoor/outdoor temperature variation, lighting, etc. (Cai et al., 2022). This work computes comfort using device latency and operation hours with/without scheduling. Correspondingly, if PAR reduction is desired, the load should be shifted to off-peak hours as it reduces user comfort. User comfort and energy costs are two competing goals. To reduce their electricity bills, consumers have to accept that their devices will run a little slower. At the same time, users have to pay higher electricity bills if they want to start using their devices immediately. User comfort, especially waiting time, is calculated by the formula shown in Eq. 29.
The waiting time of an appliance a due to scheduling is shown by ‘
The maximum operational delay due to shifting of an appliance to low-demand hours can be represented by
The aforementioned system outputs are the objective functions of this work, which are separately modeled in the previous subsection. Now, all these objectives are modeled combined in the optimization problem, which is modeled as the minimization problem as follows:
The objective functions in question, namely, energy cost, energy consumption, PAR, and user comfort, are represented by F1, F2, F3, and F4, respectively. The associated weighting factors for these functions are denoted as
Heuristic algorithms have been proposed to solve the energy management problem. Existing techniques for solving the scheduling problem cannot achieve effective energy management. Most of these algorithms require a computationally intensive solution for the scheduling problem of appliances, and the algorithms’ efficiency decreases as the number of devices increases. In order to obtain efficient energy management when resolving scheduling problems, HGBFOA is proposed, which addresses the limitations explained previously.
Genetic algorithm and bacteria foraging algorithm are good optimization methods and have efficient exploration ability. The search steps of the aforementioned optimization methods are divided into two parts: local and global searching ability.
BFOA focuses on local scope searches, whereas genetic algorithms have better global search capabilities. In addition to the benefits of these two techniques, they also have some drawbacks. For example, convergence problems exist in GA due to the maximum number of iterations and large search space requirements. At the same time, the BFOA elimination and dispersal steps may hinder the search for optimal solutions. The HGBFOA, with qualities of both GA and BFOA, is proposed to overcome the aforementioned limitations.
The flowchart of HGBFOA is shown in Figure 3 and explained step-by-step. First, the required parameters are initialized. HGBFOA performs BFOA step-by-step, as described in the flowchart. Furthermore, there is a difference between dispersal and elimination. The BFOA’s elimination and dispersal steps have changed for HGBFOA. BFOA randomly removes and distributes the remaining bacteria after the reproductive stage. In HGBFOA, the elimination and propagation steps are performed through crossover and mutation. Then, GA is started up to a maximum number of iterations. Ultimately, an optimized schedule for devices is achieved by minimizing energy consumption, reducing costs, and lowering PAR values.
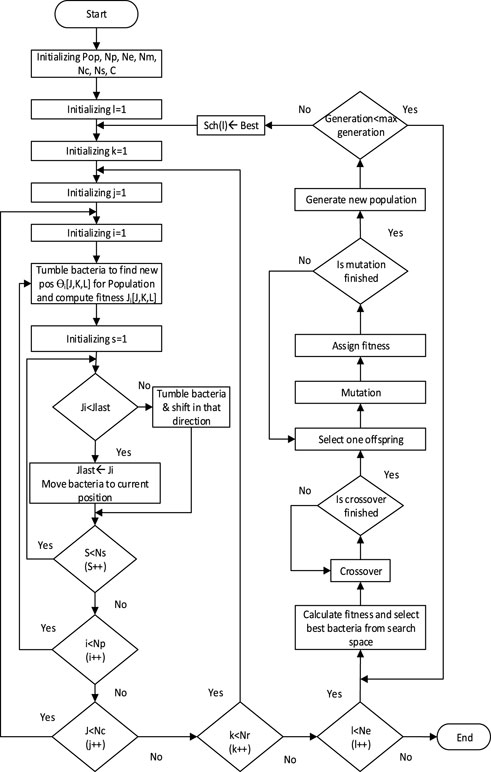
FIGURE 3. Flowchart diagram of HGBFOA.
The simulation of the given model was conducted considering three different scenarios. In Scenario I, the simulation was performed using power solely from the grid. In Scenario II, the simulation incorporated both power from the grid and PV power. Finally, Scenario III involved simulations with the combination of the grid, PV power, and ESS. All simulations are performed in MATLAB, and results are obtained with comparisons to other methods, i.e., PSO, GA, HGPO, mixed PSO and GA, BFO algorithms, and HGBFOA and GA and BFO hybrid algorithms. We used these algorithms because they are similar. Comparisons are made between existing and proposed algorithms in terms of cost savings, power consumption, better peak reduction (PAR), and time delay.
Table 1 gives us an idea of six appliances with their power ratings used in this research, (taken from the work of Jiang et al., 2022).
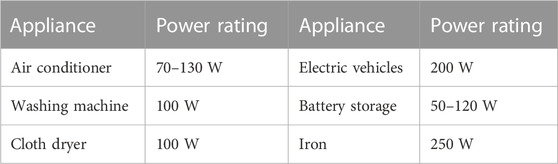
TABLE 1. Different appliances with their power ratings.
The following diagram contains details of the basic data required to initialize the result. Figure 4A shows the day-ahead price signal (DAP) (from the study by Li et al., 2022).
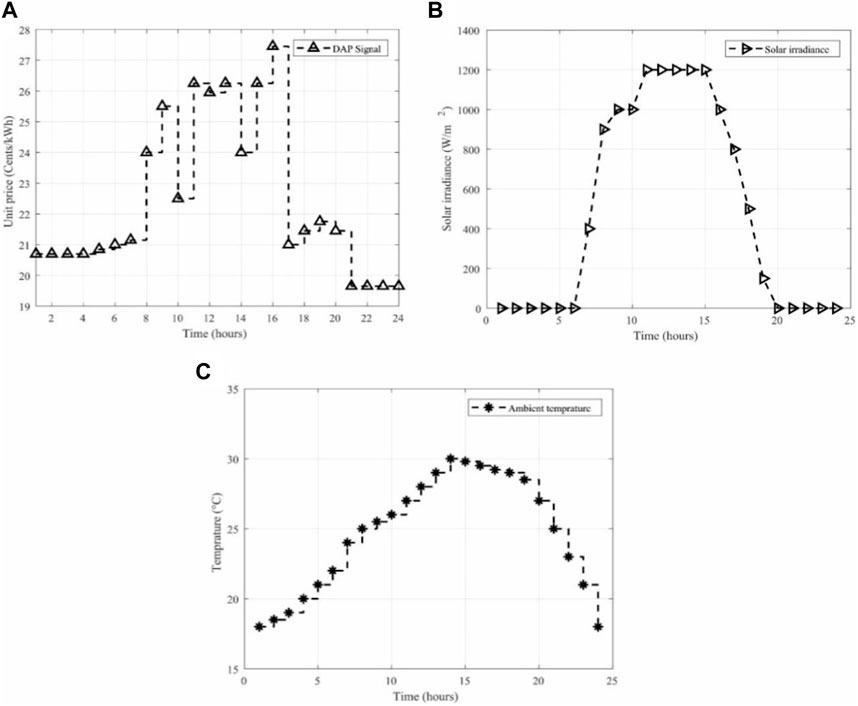
FIGURE 4. Day-ahead pricing signal is presented in (A). Solar irradiance (B) and ambient temperature (C).
Time in hours is measured horizontally, and the vertical value gives the energy price per unit in cents. In day-ahead pricing, an hourly energy price is agreed between the energy supplier and the consumer 1 day in advance. There are no additional costs for such pricing. Unit prices are cheaper at night due to off-peak hours and higher during peak hours. Therefore, the consumers schedule time flexibly and set up their hybrid devices at times when costs are lower.
Figure 4B shows the daily solar irradiance. The times shown on the graph start at 1:00 a.m., and there is no Sun until 6:00 a.m. As the Sun rises after 6 a.m., solar radiation increases exponentially, reaching a peak by 3 p.m. Therefore, PV power generation is currently at its maximum and starts to decrease after this time period as solar radiation decreases. Solar radiation continues to decrease sharply, reaching zero after 7 p.m. After that, no generations occur until the next day and the operation continues. The load consumes the maximum amount of power produced during maximum demand hours of the day. At present, green energy is being produced and used, resulting in lower carbon emissions from fossil fuel power plants.
Figure 4C shows ambient temperature over 24 h, and the temperature has a negative impact on the solar panel efficacy. Environmental temperature and photovoltaic efficiency are inversely proportional. The higher the temperature, the lower the PV yield. The efficiency of solar modules is maximized under STC, i.e., 25°C and 1,000 W/m2. According to the graph, the temperature initially cools down at night and warms up again as the Sun rises. Temperatures are highest between 1:00 and 3:00 p.m. and decrease in the evening.
Figure 5A shows the battery charge status. The battery is initially assumed to be zero and starts charging during the day when solar power begins. The battery level increases hourly and is finally fully charged in the afternoon. According to the figure, the maximum storage capacity is 280 Ah, reaching around 7 p.m. The battery stays in this state until morning and starts charging again when PV starts generation. The battery status is displayed in Ampere hours (Ah). This graph is only for battery charging and does not show the battery discharge status.
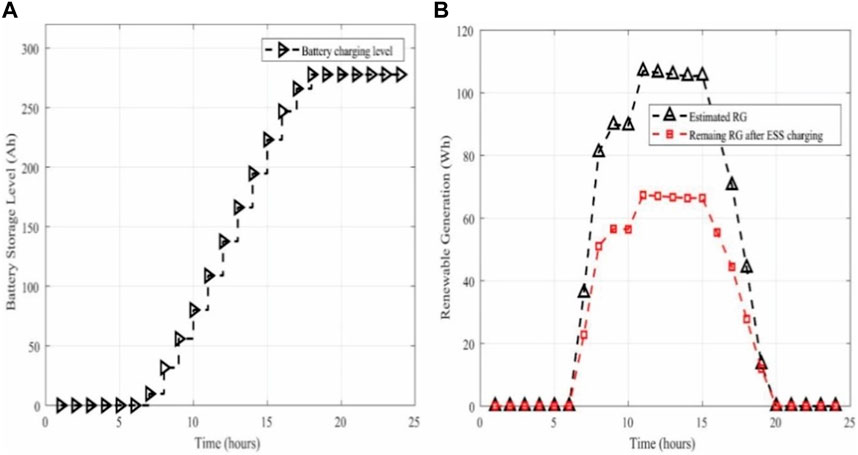
FIGURE 5. (A) Battery charging level is shown, and renewal generation along with remaining RG after charging is presented by (B).
Estimated renewable energy production and the excess renewable energy production after charging the ESS are given in Figure 5B. The Y-axis shows renewable energy production in Watt-hours, and the X-axis shows timeframes in hours. Renewable power generation is estimated to be up to 107 Wh after the 11th timeslot and continues to increase until 3:00 p.m. After that, renewable energy production decreases and approaches zero upon reaching 7:00 p.m. The red graph shows the leftover renewable energy production after charging the ESS. Excess generated power is dispatched directly to the appliances, thus reducing power consumption from the power grid. The battery starts charging after 6:00 a.m. and is fully charged after 7:00 p.m.
The original load curves for all three unplanned cases are shown in Figure 6. This curve shows that the load is unevenly distributed before optimization. In some cases, load power consumption is higher during peak hours, making it more costly than during off-peak hours.
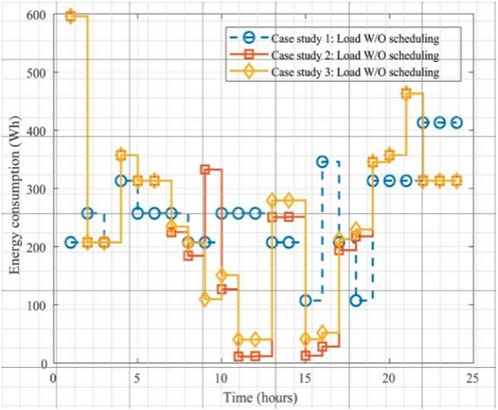
FIGURE 6. Load curve without scheduling.
In this case, we have considered only power from the grid, while other sources like PV and ESS have not been used. Scheduling is obtained for appliances in such a manner that there is minimum load during peak hours, while the maximum load is shifted to off-peak hours of the day, during which the energy price is lower. The existing and HGBFOA algorithms are simulated in MATLAB. The result of our hybrid algorithm is presented in a graph against the existing algorithms. The main goal of our research, i.e., energy consumption, energy cost, PAR, and scheduling, is compared with existing algorithms and our hybrid algorithm for grid power.
Figure 7A represents the energy consumption patterns of different devices at arbitrary times of the day. Comparisons are made between different algorithms. The graph shows that PSO has a maximum energy consumption of 500 Wh, while GA and BFOA have a maximum energy consumption of 760 Wh and 740 Wh, respectively. HGPO has a maximum power of 415 Wh, and HGBFOA has a maximum power of 800 Wh, which is the off-peak time with the lowest energy rates. However, on average, the energy utilization of HGBFOA is more efficient than that of the existing algorithms. From the graph, it can be seen that for 15 h, i.e., 6 a.m. to 9 p.m., the energy consumption is kept below 100 Wh by our proposed algorithm. This shows the efficacy of HGBFOA. These algorithms have gained an optimized power schedule for different kinds of appliances, and power is held within its specified limits (maximum during off-peak and minimum during peak hours).
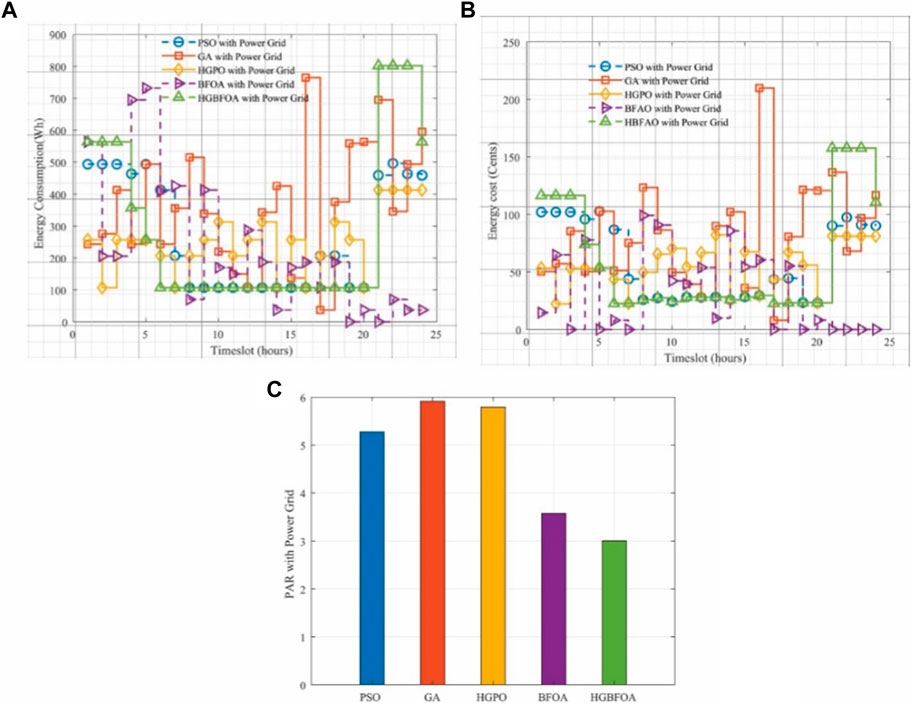
FIGURE 7. Energy consumption, energy cost, and PAR using power from the grid are shown in (A–C), respectively.
As price per unit is very important for the consumers, our objective is to reduce the energy consumption during the high-price hours of the day. The energy cost for all existing algorithms and our proposed algorithm has been compared in Figure 7B. Only a nominal load is turned on during peak hours. The maximum energy cost during 24 h for PSO, GA, HGPO, and BFOA in cents is 105 cents, 215 cents, 83 cents, and 100 cents, respectively. In contrast, the maximum energy consumption of HGBFOA is 165 cents. These 165 cents are only for 3 h during low-demand hours, where the price signal is low, so we have turned on max appliances during these hours. For almost 16 h, the energy price is under 30 cents, and the average energy cost for HGBFOA during 24 h is less than 40 cents, which is lower than that of the other existing algorithms.
Figure 7C shows the PAR of PSO, GA, HGPO, BFOA, and HGBFOA. If PAR is lower, then the peaks will be lower, which means that the power is consumed efficiently. The PAR is the maximum for GA and HGPO, which is 5.9 and 5.8, respectively. A comparison between HGBFOA and other existing algorithms is shown in Table 2. In the first two columns, algorithms are taken along with their PAR value. The third column shows the difference in the existing algorithms from our hybrid algorithm. The last column presents the percentage difference between HGBFOA and the other algorithms. In terms of percentage, HGBFOA shows better performance and is 43.18% more efficient than PSO, 49.15% more efficient than GA, 48.27% more effective than HGPO, and 16.66% better than BFOA.
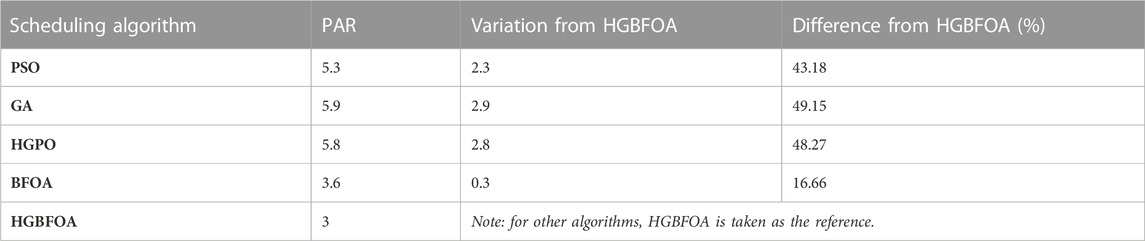
TABLE 2. PAR comparison for the grid.
For scenario II, we considered two power sources, i.e., power from the grid and solar PV. During daytime, the renewable energy from PV is used to operate load or in combination with the grid when PV generation is insufficient. During nighttime, only grid power is in use. In this study, simulations are conducted to analyze the reduction of PAR, minimization of energy bills, and power consumption using the proposed HGBFOA and other algorithms. The results of these simulations and their comparison are described in the following paragraphs.
Figure 8 shows the power consumption, usage time, energy cost, and PAR of the existing algorithms and HGBFOA. The scheduling is designed to reduce overall power consumption and energy costs, especially during maximum-demand hours. During peak hours, HGBFOA showed better performance than other algorithms in terms of energy consumption and price. From Figure 8A, it is clear that minimum energy consumption is maintained during peak hours, i.e., during daytime. For comparison, we have considered 6 to 21 timeslots. The energy consumption of different appliances can be seen, which is below 100 Wh, which results in a lower average energy cost of only 15 cents for HGBFOA. The reason for the energy cost reduction is renewable power from PV during the daytime and the load being operated on this source along with the grid.
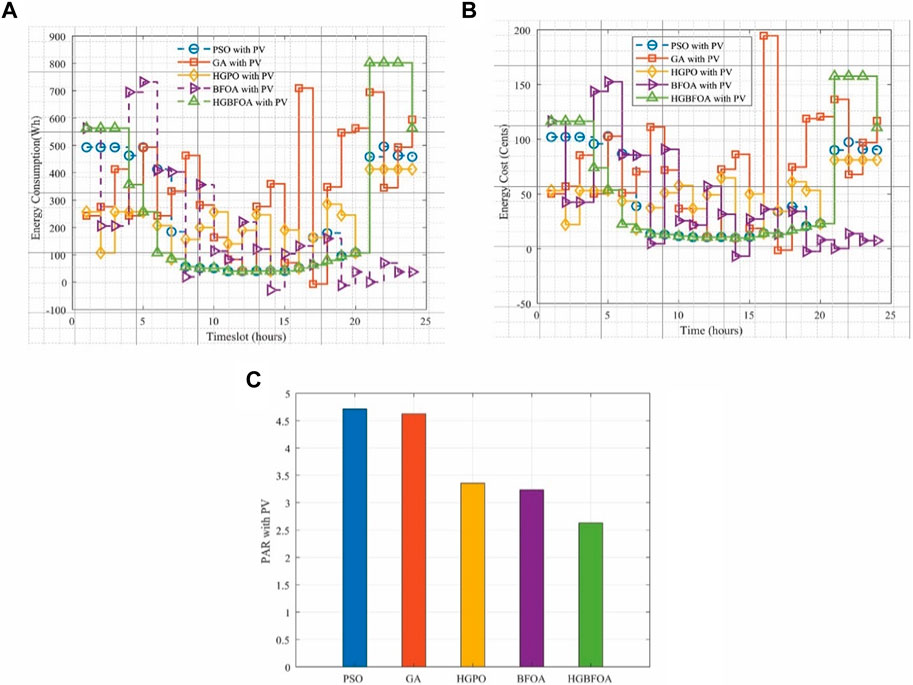
FIGURE 8. Energy consumption, energy cost, and PAR considering power from PV and the grid are shown in (A–C), respectively.
In Figure 8A, energy consumption (Watt-hours) is plotted on the Y-axis, and time in hours is plotted on the X-axis. In the sixth slot, the appliance with PSO consumes 406 Wh, that with GA consumes 495 Wh, that with BFOA consumes 406 Wh, and those with HGPO and HGBFOA consume 203 Wh and 105 Wh, respectively. Comparing the power costs in Figure 8B for the same sixth-hour slot, we get the following prices: energy cost for PSO is 85 cents, and the cost for GA and BFOA is 50 and 83 cents, respectively. Nevertheless, the utility bills for HGBFOA and HGPO are 20 cents and 45 cents, respectively. Thus, HGBFOA results in lower peak energy consumption, leading to a lower net utility bill compared to the existing techniques. Energy consumption and costs have been effectively reduced, specifically during peak time, i.e., timeslots from 6 to 20. In addition, EMC’s HGBFOA-based energy consumption follows a regular pattern, mostly keeping energy costs at a low level.
A quick comparison between HGBFOA and other algorithms is shown in Figure 8C. The PAR scores for PSO, GA, HGPO, BFOA, and HGBFOA are 4.74, 4.7, 3.4, 3.24, and 2.65, respectively. As shown in Table 3, HGBFOA outperformed PSO by 44.1%, GA by 43.6%, HGPO by 22.05%, and BFOA by 18.2%. Effective scheduling reduced the peaks in different timeframes, and HGBFOA shows better performance than other algorithms regarding PAR minimization.
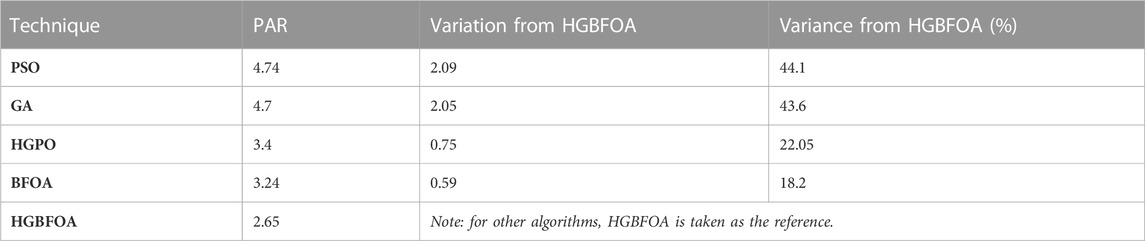
TABLE 3. PAR evaluation with PV and the grid.
In Scenario III, power is utilized from three different sources, namely, the grid, renewable energy systems, and energy storage systems. During daytime, PV and the grid together operate the load, and excess power from PV is used to charge the batteries. Our hybrid and other existing algorithms are applied. A comparison for power consumption, energy cost, PAR and user comfort is made. Further details are as follows.
Figure 9 shows energy consumption, energy cost, and PAR using the algorithm described previously. Our main goal is to reduce energy consumption by scheduling devices during low energy-cost timeslots. This can be attained by lowering energy consumption during peak hours and shifting loads to low-peak hours. On average, the energy consumption of HGBFOA is relatively lower than the other aforementioned algorithms. For simplicity, we examine the energy consumption of the appliances during timeslot no. 10 using the algorithm described previously. The power consumption of the 10th slot for PSO, GA, and BFOA is 180 Wh, 170 Wh, and 110 Wh, respectively, whereas the power consumption while using HGPO is 260 Wh and that of HGBFOA is 50 Wh. This indicates a clear difference in the power consumption of the proposed algorithms.
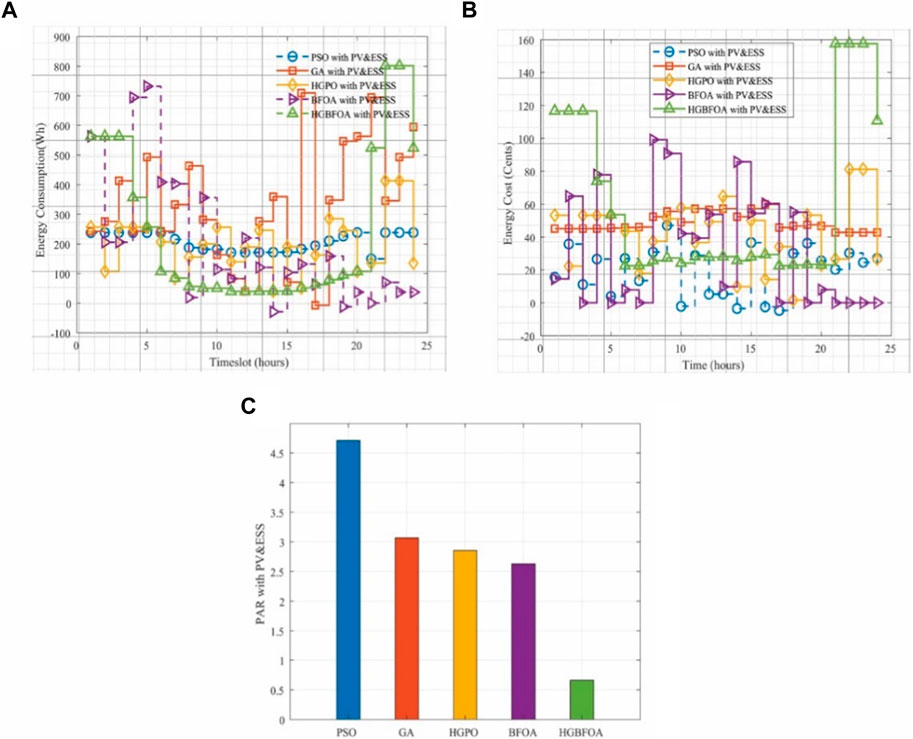
FIGURE 9. Energy consumption, energy cost, and PAR considering power from PV, the grid, and ESS are shown in (A–C), respectively.
Having determined the energy consumption during 10th hour, the energy cost for this timeslot is described in the next row. Energy costs for PSO, GA, and BFOA are −04 cents, 50 cents, and 42 cents, respectively. The energy cost for HGPO is 56 cents, whereas HGBFOA has an energy cost of 23 cents. HGBFOA’s overall performance is better than the other existing algorithms.
Minimization of PAR is an important objective of this study. It is greatly facilitated by our proposed HGBFOA algorithm. PAR comparison with different algorithms is shown in Figure 9C. The PAR for PSO is 4.74, that of GA is 3.07, that of HGPO is 2.88, that of BFOA is 2.65, and that of HGBFOA is 0.7. HGBFOA is 85% more efficient than PSO, 77% better than GA, 75.6% better than HGPO, and 73% finer than BFOA. This is presented in Table 4. The table shows that the appliances are effectively shifted to low peak and mid-peak timeslots, resulting in a significant reduction in the PAR value.
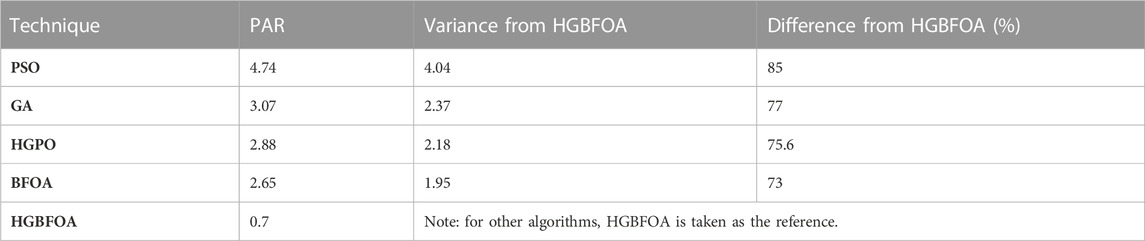
TABLE 4. PAR evaluation utilizing PV, ESS, and the power grid.
Figure 10 determines the user comfort, which is the operational delay of appliances, and the graph is explained in the following paragraph.
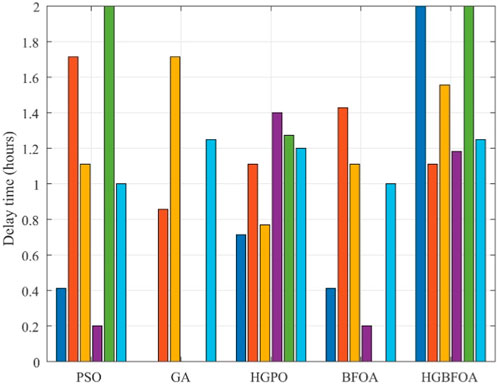
FIGURE 10. User comfort comparison of the algorithms.
For PSO, the air conditioner has a 0.4-h delay, the refrigerator has a 1.72-h delay, the washing machine has a 1.1-h delay, the juicer blender has a 0.2-h delay, and the vacuum cleaner has a 2-h delay. There will be an hour delay in EV/ESS operations. Air conditioners, juicers, vacuum cleaners, and electric cars have no operational delays, while refrigerators and washing machines have delays of 0.85 and 1.72 h, respectively. HGPO lags by 0.72, 1.1, 0.78, 1.4, 1.28, and 1.2 h for air conditioners, refrigerators, washing machines, juicers, vacuum cleaners, and EV/ESS, respectively. When using BFOA, the devices such as air conditioners, refrigerators, washing machines, juicers, vacuum cleaners, and EV/ESS face delays of 0.4 h, 1.42 h, 1.1 h, 0.2 h, 0 h, and 1 h, respectively. In the end, the operating lags of air conditioners, refrigerators, washing machines, juicers, vacuum cleaners, and EV/ESS with HGBFOA are 2 h, 1.1 h, 1.55 h, 1.2 h, 2 h, and 1.24 h, respectively. There is a slight delay when operating devices with HGBFOA. However, the slight delay in operation is to reduce electricity bills, ensure efficient energy management, and maintain minimum PAR values.
User comfort is somewhat limited to achieve important goals such as optimal energy consumption, reduced energy costs, reduced CO2 emissions, and minimum PAR values. Because this research is based on a multi-goal problem, the achievement of one goal depends on the achievement of another. Therefore, there is a trade-off among user comfort, energy costs, and PAR minimization. To avoid peaks, energy consumption costs, and PAR values, a compromise must be made on delays in the operation of some devices during peak hours. Appliances using HGBFOA, especially air conditioners and vacuum cleaners, have a slightly longer latency than those using other existing algorithms. Furthermore, the operational delay of these appliances resulted in lower power consumption, price, and PAR.
Although DR programs can obtain efficient energy utilization and optimal power consumption, but their implementation is complex because of insufficient user knowledge. To achieve this goal, HGBFOA, which combines the GA and BFOA algorithms, was developed. EMC has significantly improved the performance of the DR program. EMC based on HGBFOA schedules home appliances to operate automatically according to the DR signal, enabling energy-efficient, cost-saving, and lower PAR and CO2 emission schemes. Simulations and results show that EMC based on HGBFOA outperforms other existing algorithms and can achieve ongoing goals such as minimizing energy consumption and cost, and reducing PAR while maximizing user comfort.
This research work can be stretched in the following directions in the future.
• For optimal energy management in smart grids, a fog and cloud-based system can be used.
• Coordination of energy suppliers with consumers shall be introduced in load planning to lower energy waste.
• Two-way power trade-off between the utility company and the consumer shall be initiated, taking into account the “vehicle-to-grid” and “grid-to-vehicle” energy optimization.
• For online and real-time energy optimization, a Lyapunov optimization method can be established that considers field demands from both energy suppliers and consumers.
The original contributions presented in the study are included in the article/Supplementary Material; further inquiries can be directed to the corresponding authors.
SYA: conceptualization, technical analysis, formal analysis, methodology, original draft writing, methodology, software. GH: supervision, original draft writing, editing and review, visualization, software, project administration, funding acquisition, formal analysis. MA: Methodology & implementation, Writing-review & editing, Formal analysis & acquisition, Data curation, Funding acquisition, and Resources. TAK: Conceptualization, Data curation, Interpretation, Acquisition, Formal analysis, Methodology, Software, Validation, and Writing-Review & editing; KR: supervision, formal analysis, project administration, methodology, software, review and editing. KA: Visualization, Investigation, Formal Analysis, interpretation, Funding Acquisition, Writing-review & Editing, review. All authors contributed to the article and approved the submitted version.
This research is funded by Researchers Supporting Project Number (RSPD2023R947), King Saud University, Riyadh, Saudi Arabia.
The authors declare that the research was conducted in the absence of any commercial or financial relationships that could be construed as a potential conflict of interest.
All claims expressed in this article are solely those of the authors and do not necessarily represent those of their affiliated organizations, or those of the publisher, the editors, and the reviewers. Any product that may be evaluated in this article, or claim that may be made by its manufacturer, is not guaranteed or endorsed by the publisher.
Abdollahi, A., Parsa Moghaddam, M., Rashidinejad, M., and Sheikh-El-Eslami, M. K. (2011). Investigation of economic and environmental-driven demand response measures incorporating UC. IEEE Trans. smart grid 3 (1), 12–25. doi:10.1109/tsg.2011.2172996
Abushnaf, J., Alexander, R., and Górnisiewicz, W. (2016). Impact on electricity use of introducing time-of-use pricing to a multi-user home energy management system. Int. Trans. Electr. Energy Syst. 26 (5), 993–1005. doi:10.1002/etep.2118
Adika, C. O., and Wang., L. (2014). Smart charging and appliance scheduling approaches to demand side management. Int. J. Electr. Power & Energy Syst. 57, 232–240. doi:10.1016/j.ijepes.2013.12.004
Albogamy, F. R., Khan, S. A., Hafeez, G., Murawwat, S., Khan, S., Haider, S. I., et al. (2022). Real-time energy management and load scheduling with renewable energy integration in smart grid. Sustainability 14 (3), 1792–1828. doi:10.3390/su14031792
Alzahrani, A., Hafeez, G., Rukh, G., Murawwat, S., Iftikhar, F., Ali, S., et al. (2023). Demand response for optimal power usage scheduling considering time and power flexibility of load in smart grid. IEEE Access 11 (2023), 33640–33651. doi:10.1109/access.2023.3263849
Azar, A. G., and Jacobsen, R. H. (2016). Appliance scheduling optimization for demand response. Int. J. Adv. Intelligent Syst. 9 (1&2), 50–64.
Barbato, A., and Capone, A. (2014). Optimization models and methods for demand-side management of residential users: a survey. Energies 7 (9), 5787–5824. doi:10.3390/en7095787
Cai, T., Dong, M., Chen, K., and Gong, T. (2022). Methods of participating power spot market bidding and settlement for renewable energy systems. Energy Rep. 8, 7764–7772. doi:10.1016/j.egyr.2022.05.291
Cao, B., Wang, X., Zhang, W., Song, H., and Lv, Z. (2020a). A many-objective optimization model of industrial internet of things based on private blockchain. IEEE Netw. 34 (5), 78–83. doi:10.1109/MNET.011.1900536
Cao, B., Yan, Y., Wang, Y., Liu, X., Lin, J. C., Sangaiah, A. K., et al. (2022). A multiobjective intelligent decision-making method for multistage placement of PMU in power grid enterprises. IEEE Trans. Industrial Inf. 19, 7636–7644. doi:10.1109/TII.2022.3215787
Cao, B., Zhao, J., Gu, Y., Fan, S., and Yang, P. (2020c). Security-aware industrial wireless sensor network deployment optimization. IEEE Trans. Industrial Inf. 16 (8), 5309–5316. doi:10.1109/TII.2019.2961340
Cao, B., Zhao, J., Yang, P., Gu, Y., Muhammad, K., Rodrigues, J. J. P. C., et al. (2020b). Multiobjective 3-D topology optimization of next-generation wireless data center network. IEEE Trans. Industrial Inf. 16 (5), 3597–3605. doi:10.1109/TII.2019.2952565
Chen, J., Sun, B., Li, Y., Jing, R., Zeng, Y., and Li, M. (2022). Credible capacity calculation method of distributed generation based on equal power supply reliability criterion. Renew. Energy 201, 534–547. doi:10.1016/j.renene.2022.10.129
Chung, K. L., Tian, H., Wang, S., Feng, B., and Lai, G. (2022). Miniaturization of microwave planar circuits using composite microstrip/coplanar-waveguide transmission lines. Alexandria Eng. J. 61 (11), 8933–8942. doi:10.1016/j.aej.2022.02.027
Dang, W., Liao, S., Yang, B., Yin, Z., Liu, M., Yin, L., et al. (2023). An encoder-decoder fusion battery life prediction method based on Gaussian process regression and improvement. J. Energy Storage 59, 106469. doi:10.1016/j.est.2022.106469
Elazab, R., Saif, O., Metwally, A. M. A., and Daowd, M. (2021). Mixed integer smart off-grid home energy management system. Energy Rep. 7 (2021), 9094–9107. doi:10.1016/j.egyr.2021.11.227
Elkazaz, M. H., Hoballah, A., and Azmy, A. M. (2016). Artificial intelligent-based optimization of automated home energy management systems. Int. Trans. Electr. Energy Syst. 26 (9), 2038–2056. doi:10.1002/etep.2195
Gelazanskas, L., and KelumGamage, A. A. (2014). Demand side management in smart grid: A review and proposals for future direction. Sustain. Cities Soc. 11, 22–30. doi:10.1016/j.scs.2013.11.001
Gu, Q., Tian, J., Yang, B., Liu, M., Gu, B., Yin, Z., et al. (2023). A novel architecture of a six degrees of freedom parallel platform. Electronics 12 (8), 1774. doi:10.3390/electronics12081774
Gul, Mehreen S., and Sandhya, Patidar. (2015). Understanding the energy consumption and occupancy of a multi-purpose academic building. Energy Build. 87, 155–165. doi:10.1016/j.enbuild.2014.11.027
Hafeez, G., Islam, N., Ali, A., Ahmad, S., Usman, M., and Khurram Saleem, A. (2019). A modular framework for optimal load scheduling under price-based demand response scheme in smart grid. Processes 7 (8), 499. doi:10.3390/pr7080499
Hafeez, G., Khurram Saleem, A., Wadud, Z., Khan, I., Usman, M., Abdul Baseer, Q., et al. (2020b). An innovative optimization strategy for efficient energy management with day-ahead demand response signal and energy consumption forecasting in smart grid using artificial neural network. IEEE Access 8, 84415–84433. doi:10.1109/access.2020.2989316
Hafeez, G., Wadud, Z., Ullah Khan, I., Khan, I., Shafiq, Z., Usman, M., et al. (2020a). Efficient energy management of IoT-enabled smart homes under price-based demand response program in smart grid. Sensors 20 (11), 3155. doi:10.3390/s20113155
Huang, N., Zhao, X., Guo, Y., Cai, G., and Wang, R. (2023a). Distribution network expansion planning considering a distributed hydrogen-thermal storage system based on photovoltaic development of the Whole County of China. Energy 278, 127761. doi:10.1016/j.energy.2023.127761
Huang, X., Chen, N., Ye, D., Zhong, A., Liu, H., Li, Z., et al. (2023b). Structurally complementary star-shaped unfused ring electron acceptors with simultaneously enhanced device parameters for ternary organic solar cells. Sol. RRL 7, 2300143. doi:10.1002/solr.202300143
Huang, Y., Wang, W., and Hou, B. (2019). A hybrid algorithm for mixed integer nonlinear programming in residential energy management. J. Clean. Prod. 226, 940–948. doi:10.1016/j.jclepro.2019.04.062
Imran, A., Hafeez, G., Khan, I., Usman, M., Shafiq, Z., Baseer Qazi, A., et al. (2020). Heuristic-based programable controller for efficient energy management under renewable energy sources and energy storage system in smart grid. IEEE Access 8, 139587–139608. doi:10.1109/access.2020.3012735
Jiang, J., Zhang, L., Wen, X., Valipour, E., and Nojavan, S. (2022). Risk-based performance of power-to-gas storage technology integrated with energy hub system regarding downside risk constrained approach. Int. J. Hydrogen Energy 47 (93), 39429–39442. doi:10.1016/j.ijhydene.2022.09.115
Jovanovic, R., Bousselham, A., and Islam Safak, B. (2016). Residential demand response scheduling with consideration of consumer preferences. Appl. Sci. 6 (1), 16. doi:10.3390/app6010016
Li, J., Deng, Y., Sun, W., Li, W., Li, R., Li, Q., et al. (2022b). Resource orchestration of cloud-edge–based smart grid fault detection. ACM Trans. Sen. Netw. 18 (3), 1–26. doi:10.1145/3529509
Li, P., Hu, J., Qiu, L., Zhao, Y., and Ghosh, B. K. (2022a). A distributed economic dispatch strategy for power–water networks. IEEE Trans. Control Netw. Syst. 9 (1), 356–366. doi:10.1109/TCNS.2021.3104103
LiHui, X., and Ho, S. (2014). User-expected price-based demand response algorithm for a home-to-grid system. Energy 64, 437–449. doi:10.1016/j.energy.2013.11.049
Lin, X., Liu, Y., Yu, J., Yu, R., Zhang, J., and Wen, H. (2022). Stability analysis of Three-phase Grid-Connected inverter under the weak grids with asymmetrical grid impedance by LTP theory in time domain. Int. J. Electr. Power & Energy Syst. 142, 108244. doi:10.1016/j.ijepes.2022.108244
Lokeshgupta, B., and Sivasubramani, S. (2019). Multi-objective home energy management with battery energy storage systems. Sustain. Cities Soc. 47, 101458. doi:10.1016/j.scs.2019.101458
Lv, Z., Chen, D., Lou, R., and Song, H. (2020a). Industrial security solution for virtual reality. IEEE Internet Things J. 8 (8), 6273–6281. doi:10.1109/JIOT.2020.3004469
Lv, Z., Qiao, L., Li, J., and Song, H. (2020b). Deep-learning-enabled security issues in the internet of things. IEEE Internet Things J. 8 (12), 9531–9538. doi:10.1109/JIOT.2020.3007130
Lv, Z., and Song, H. (2019). Mobile internet of things under data physical fusion technology. IEEE Internet Things J. 7 (5), 4616–4624. doi:10.1109/JIOT.2019.2954588
Lv, Z., Wu, J., Li, Y., and Song, H. (2022). Cross-layer optimization for industrial internet of things in real scene digital twins. IEEE Internet Things J. 9 (17), 15618–15629. doi:10.1109/JIOT.2022.3152634
Ma, K., Yao, T., Yang, J., and Guan, X. (2016). Residential power scheduling for demand response in smart grid. Int. J. Electr. Power & Energy Syst. 78, 320–325. doi:10.1016/j.ijepes.2015.11.099
Ma, K., Li, Z., Liu, P., Yang, J., Geng, Y., Yang, B., et al. (2021). Reliability-Constrained throughput optimization of industrial wireless sensor networks with energy harvesting relay. IEEE Internet Things J. 8 (17), 13343–13354. doi:10.1109/JIOT.2021.3065966
Mary, G. A., and Rajarajeswari, R. (2014). Smart grid cost optimization using genetic algorithm. Int. J. Res. Eng. Technol. 3 (07), 282–287. doi:10.15623/ijret.2014.0319051
Min, C., Pan, Y., Dai, W., Kawsar, I., Li, Z., and Wang, G. (2023). Trajectory optimization of an electric vehicle with minimum energy consumption using inverse dynamics model and servo constraints. Mech. Mach. Theory 181, 105185. doi:10.1016/j.mechmachtheory.2022.105185
Muhsen, D. H., Haider, H. T., Al-Nidawi, Y., and Khatib, T. (2019). Optimal home energy demand management based multi-criteria decision making methods. Electronics 8 (5), 524. doi:10.3390/electronics8050524
Priya Esther, B., Shivarama Krishna, K., Sathish Kumar, K., and Ravi, K. (2016). “Demand side management using bacterial foraging optimization algorithm,” in Proceedings of the Information Systems Design and Intelligent Applications Proceedings of Third International Conference INDIA, Berlin, Germany, February 2016 (Springer India), 657–666.
Rastegar, M., Fotuhi-Firuzabad, M., and Zareipour, H. (2016). Home energy management incorporating operational priority of appliances. Int. J. Electr. Power & Energy Syst. 74, 286–292. doi:10.1016/j.ijepes.2015.07.035
Rehman, A. U., Wadud, Z., Elavarasan, R. M., Hafeez, G., Khan, I., Shafiq, Z., et al. (2021). An optimal power usage scheduling in smart grid integrated with renewable energy sources for energy management. IEEE Access 9 (2021), 84619–84638. doi:10.1109/access.2021.3087321
Ribeiro, C., Pinto, T., Vale, Z., and Baptista, J. (2018). “Data mining for prosumers aggregation considering the self-generation,” in Distributed computing and artificial intelligence, 14th international conference (Berlin, Germany: Springer International Publishing), 96–103.
Ribeiro, C., Pinto, T., Vale, Z., and Baptista, J. (2020). “Data mining for remuneration of consumers demand response participation,” in Highlights in practical applications of agents, multi-agent systems, and trust-worthiness. The PAAMS collection: International workshops of PAAMS 2020 (L'Aquila, Italy: Springer International Publishing), 326–338.
Samadi, P., Amir-Hamed, M. R., Robert, S., Wong, V. W. S., and Juri, J. (2010). “Optimal real-time pricing algorithm based on utility maximization for smart grid,” in Proceedings of the 2010 First IEEE International Conference on Smart Grid Communications, Gaithersburg, MD, USA, October 2010 (IEEE).
Sarker, E., Halder, P., Seyedmahmoudian, M., Jamei, E., Horan, B., Mekhilef, S., et al. (2021). Progress on the demand side management in smart grid and optimization approaches. Int. J. Energy Res. 45 (1), 36–64. doi:10.1002/er.5631
Shirazi, E., and Jadid, S. (2015). Optimal residential appliance scheduling under dynamic pricing scheme via HEMDAS. Energy Build. 93, 40–49. doi:10.1016/j.enbuild.2015.01.061
Srinivasan, D., Rajgarhia, S., Radhakrishnan, B. M., Sharma, A., and Khincha, H. (2017). Game-Theory based dynamic pricing strategies for demand side management in smart grids. Energy 126, 132–143. doi:10.1016/j.energy.2016.11.142
Sun, B., Li, Y., Zeng, Y., Chen, J., and Shi, J. (2022). Optimization planning method of distributed generation based on steady-state security region of distribution network. Energy Rep. 8, 4209–4222. doi:10.1016/j.egyr.2022.03.078
United States Department of Energy Energy information administration. Washington: Government agency. Available at: https://www.eia.gov/todayinenergy/detail.cfm?id=12251 (Accessed December 17, 2015).
Wang, B., Zhang, Y., and Zhang, W. (2022a). A composite adaptive fault-tolerant attitude control for a quadrotor UAV with multiple uncertainties. J. Syst. Sci. Complex. 35 (1), 81–104. doi:10.1007/s11424-022-1030-y
Wang, H., Zheng, X., Yuan, X., and Wu, X. (2022b). Low-complexity model predictive control for a nine-phase open-end winding PMSM with dead-time compensation. IEEE Trans. power Electron. 1, 8895–8908. doi:10.1109/TPEL.2022.3146644
Wang, J., Tian, J., Zhang, X., Yang, B., Liu, S., Yin, L., et al. (2022c). Control of time delay force feedback teleoperation system with finite time convergence. Front. NEUROROBOTICS 16, 877069. doi:10.3389/fnbot.2022.877069
Xiao, S., Cao, Y., Wu, G., Guo, Y., Gao, G., Chen, S., et al. (2022). Influence of the distributed grounding layout for intercity trains on the ‘train-rail’ circumflux. IEEE Trans. Circuits Syst. II Express Briefs 70, 1194–1198. doi:10.1109/TCSII.2022.3223984
Xie, X., and Sun, Y. (2022). A piecewise probabilistic harmonic power flow approach in unbalanced residential distribution systems. Int. J. Electr. Power & Energy Syst. 141, 108114. doi:10.1016/j.ijepes.2022.108114
Yan, Z., and Wen, H. (2021). Electricity theft detection base on extreme gradient boosting in AMI. IEEE Trans. Instrum. Meas. 70, 1–9. doi:10.1109/TIM.2020.3048784
Yu, D., Duan, C., and Gu, B. (2023). Design and evaluation of a novel plan for thermochemical cycles and PEM fuel cells to produce hydrogen and power: application of environmental perspective. Chemosphere 334, 138935. doi:10.1016/j.chemosphere.2023.138935
Yu, M., and Ho, S. (2016). Supply–demand balancing for power management in smart grid: a Stackelberg game approach. Appl. energy 164, 702–710. doi:10.1016/j.apenergy.2015.12.039
Zafar, S., Nawaz, K., Naqvi, S. A. R., and Malik, T. N. (2013). Integration of renewable energy sources in smart grid: A review. Nucl. 50 (4), 311–327.
Zhang, S., Zhou, Z., Luo, R., Zhao, R., Xiao, Y., and Xu, Y. (2022c). A low-carbon, fixed-tour scheduling problem with time windows in a time-dependent traffic environment. Int. J. Prod. Res. 61, 6177–6196. doi:10.1080/00207543.2022.2153940
Zhang, W., Zheng, Z., Liu, H., Yang, P., Wang, J., Chen, Y., et al. (2022b). Global characterization of megakaryocytes in bone marrow, peripheral blood, and cord blood by single-cell RNA sequencing. CSEE J. Power Energy Syst. 8 (6), 1636–1647. doi:10.1038/s41417-022-00476-z
Zhang, X., Wang, Y., Yuan, X., Shen, Y., Lu, Z., and Wang, Z. (2022a). Adaptive dynamic surface control with disturbance Observers for battery/supercapacitor-based hybrid energy sources in electric vehicles. IEEE Trans. Transp. Electrification, 1. doi:10.1109/TTE.2022.3194034
Zhang, Z., Altalbawy, F. M. A., Al-Bahrani, M., and Riadi, Y. (2023). Regret-based multi-objective optimization of carbon capture facility in CHP-based microgrid with carbon dioxide cycling. J. Clean. Prod. 384, 135632. doi:10.1016/j.jclepro.2022.135632
Zhao, P., Ma, K., Yang, J., Yang, B., Guerrero, J. M., Dou, C., et al. (2022). Distributed power sharing control based on adaptive virtual impedance in seaport microgrids with cold ironing. IEEE Trans. Transp. Electrification 9, 2472–2485. doi:10.1109/TTE.2022.3211204
Zhao, Z., WonLee, C., Shin, Y., and Song, K. B. (2013). An optimal power scheduling method for demand response in home energy management system. IEEE Trans. smart grid 4 (3), 1391–1400. doi:10.1109/tsg.2013.2251018
Zhou, B., Li, W., Chan, K. W., Cao, Y., Kuang, Y., Liu, X., et al. (2016). Smart home energy management systems: concept, configurations, and scheduling strategies. Renew. Sustain. Energy Rev. 61, 30–40. doi:10.1016/j.rser.2016.03.047
Keywords: smart grid, renewable energy sources, demand response, day-ahead scheduling, energy management controller, electric vehicles, energy storage system
Citation: Ahmad SY, Hafeez G, Aurangzeb K, Rehman K, Khan TA and Alhussein M (2023) A sustainable approach for demand side management considering demand response and renewable energy in smart grids. Front. Energy Res. 11:1212304. doi: 10.3389/fenrg.2023.1212304
Received: 26 April 2023; Accepted: 08 August 2023;
Published: 11 September 2023.
Edited by:
Yushuai Li, University of Oslo, NorwayReviewed by:
José Baptista, University of Trás-os-Montes and Alto Douro, PortugalCopyright © 2023 Ahmad, Hafeez, Aurangzeb, Rehman, Khan and Alhussein. This is an open-access article distributed under the terms of the Creative Commons Attribution License (CC BY). The use, distribution or reproduction in other forums is permitted, provided the original author(s) and the copyright owner(s) are credited and that the original publication in this journal is cited, in accordance with accepted academic practice. No use, distribution or reproduction is permitted which does not comply with these terms.
*Correspondence: Ghulam Hafeez, Z2h1bGFtaGFmZWV6MzkzQGdtYWlsLmNvbQ==
Disclaimer: All claims expressed in this article are solely those of the authors and do not necessarily represent those of their affiliated organizations, or those of the publisher, the editors and the reviewers. Any product that may be evaluated in this article or claim that may be made by its manufacturer is not guaranteed or endorsed by the publisher.
Research integrity at Frontiers
Learn more about the work of our research integrity team to safeguard the quality of each article we publish.