 Gang Wu
 Na Luo*
- College of Automotive and Mechanical Engineering, Changsha University of Science and Technology, Changsha, China
This paper aims to combine grey correlation analysis and response surface method to propose a fast and effective performance optimization method for PEMFC. First, based on orthogonal test data, grey correlation analysis method is used to select four variables that have significant influence on PEMFC’s comprehensive performance from eight common parameters. Secondly, based on grey correlation analysis, the multi-objective optimization problem is transformed into a single objective optimization problem about correlation degree, and applying the response surface method to build the key parameters and the correlation between the second order prediction model. Therefore, the current density, system efficiency and oxygen distribution uniformity on cathode catalyst layer of PEMFC were optimized as a whole. Finally, the optimal parameter combination was obtained by optimizing the prediction model. The simulation results show that the optimized operating conditions are significantly improved in the three performance indexes compared with the basic model, which confirms the feasibility of this method in solving the multi-objective optimization problem, and can provide some reference for the optimal design of hydrogen fuel cells.
1 Introduction
Due to the growing demand for energy, the consumption of fossil fuels and the total amount of CO2 emissions are rising rapidly, and “clean, low-carbon, safe and efficient” energy reform has become the general trend (Yang et al., 2023). Fuel cell is a device that directly converts chemical energy in fuel into electrical energy through electrochemical reaction without combustion, which has the advantages of high energy conversion efficiency, no pollution and no noise compared with traditional internal combustion engine, etc. Proton exchange membrane fuel cell (PEMFC) has become one of the hot spots of research in the energy field because of its advantages of low operating temperature, fast starting and high specific power (Kurnia et al., 2019). Many researchers are committed to promoting the development of hydrogen fuel cell technology from the aspects of improving performance, extending life and reducing cost (Parekh, 2022). Performance optimization has always been an important work to promote the development of fuel cells. However, the performance and stability of fuel cells are closely related to various operating parameters. Improper working conditions will seriously affect the output performance of the cell and even cause irreversible degradation inside the cell, thus greatly shortening the cell life. Therefore, it is important to study the influence of operating parameters on cell performance and determine the optimal combination of parameters for efficient and long-life operation of PEMFC.
So far, this has been studied by a number of scholars and some results have been obtained. Dehsara et al. showed that increasing the operating pressure and temperature can improve the net transport of reactants through the porous layer to the catalyst layer (CL) and improve the performance of the proton exchange membrane (Dehsara & Kermani, 2013). Lu et al. divided the pressure increase into the contribution of increasing the partial pressure of reactants and the contribution of increasing the water content of the membrane, further revealing that the improvement of cell performance is mainly due to the increase in membrane conductivity rather than enhancing the partial pressure of the reactants (Lu et al., 2019). Hasheminasab et al. pointed out that increasing the anode stoichiometric would reduce the water content of the cathode channel and the cell performance, and increase the sensitivity of generating power to changes in other operating parameters. However, increasing the cathode stoichiometric and temperature would reduce the water content in the cathode channel and increase the cell power. The sensitivity of cell power to changes in other operating parameters is reduced (Hasheminasab et al., 2020). Zhang et al. indicated that adjusting the relative humidity (RH) is an important way to influence the water management of fuel cells, and that the cells have better overall and local response current density and spatial performance uniformity when the relative humidity is 70% (Zhang et al., 2016). Xu et al. noted that the cell output performance is worst at 90°C with both cathode and anode RH at 90%. Under the condition of high current density, the lower the RH value is, the better the operation performance is, and the influence of the change of cathode RH on the cell output performance is better than that of anode RH (Xu et al., 2021). Xia et al. noted that increasing GDL porosity improves performance by increasing flow uniformity and diffusion flux, but effective electron conductivity decreases with increasing porosity. Since the cell performance depends on the combination of these three factors, the final current density will decrease with further increase in porosity (Lingchao Xia & 2021). Abraham et al. improved the cell performance by 12.5% by optimizing GDL porosity and CL porosity, as cells with optimized porosity increase the membrane water content and promote the diffusion of reactants, ultimately leading to higher current densities (Abraham B & Murugavel K, 2021).
Uneven distribution of reaction gases can lead to uneven current density and temperature distribution, which can reduce the overall cell performance and even cause local reaction gas starvation, thus enhancing carbon corrosion and loss of Pt catalyst layer. Current research on the uniformity of fuel cell reactant distribution focuses on the effects of different flow field structures and current densities. Sauermoser et al. summarized and reviewed many studies in recent years to improve the uniformity of gas distribution in the catalytic layer and the uniformity within GDL by optimizing the flow field structure (Sauermoser et al., 2020). Chen et al. designed a stepped flow field. Compared with the ordinary parallel flow field, the stepped flow field can improve the uniformity of gas concentration and current density distribution, alleviate the water flooding phenomenon, and increase the net power by 21.5% (Chen et al., 2021). Zhang et al. the degradation mechanism and mitigation measures of vehicle fuel cells under the condition of frequent start-stop are reviewed. It is concluded that the local gas starvation caused by the uneven distribution of reactive gas is one of the important reasons for the start-stop degradation of fuel cells (Zhang et al., 2018). Lim et al. summarized and reviewed the influence of flow field design on water management and reactant distribution. They pointed out that the uniform distribution of reaction gas is one of the main criteria for improving performance. In addition to the design of fuel cell pack, operating conditions such as flow rate, pressure, temperature and humidity also affect the distribution of reactants (Lim et al., 2016). Cheng et al. proposed the mass fraction difference coefficient as a uniformity evaluation index, and pointed out that hydrogen humidification has a hydrogen distribution significantly and it is appropriate to control at 25%–50%, while air humidification has less effect on oxygen distribution (Cheng et al., 2021). Zhang et al. found that the concentration distribution of anode gas tends to be more uniform than that of cathode gas, and the concentration gradually increases with the increase of channel distance with a maximum error of 15.6% (Yong et al., 2022). Therefore, it is important to improve the uniform distribution of the cathode reaction gas.
Sheila et al. used a weighting method to optimize the fuel cell system efficiency and size trade-off (Ang et al., 2010). Mehrdad et al. optimized the cell voltage and power density by response surface methodology (RSM) combined with non-dominated sorting genetic algorithm (NSGA ii) using operational parameters as design variables (Ghasabehi et al., 2021). Zeng et al. with flow power consumption and output power as optimization objectives, genetic algorithm (GA) was used to optimize the width of the bottom and top sides of the flow channel, and the optimal structure was trapezoidal channel (Zeng et al., 2017). Liu et al. based on the neural network proxy model and non-dominated sorting genetic algorithm (NSGA ii), the porosity of the catalytic layer (CL), the electrolyte volume fraction (CL) and the gas diffusion layer (GDL) were optimized to improve the output power density and reduce the electrolyte volume fraction (Liu et al., 2022). Liu et al. used a multi-objective genetic algorithm to optimize both the operating conditions and the channel structure of the cell, and the results showed that the optimal channel shape under optimal operating conditions was conical (Liu et al., 2017).
According to the review of previous studies, it is not found that the combination of gray correlation analysis and response surface method to achieve multi-objective optimization of PEMFC, and there is little consideration of the uniformity of reaction gas distribution in performance optimization, and almost no research on the effect of operating parameters on reaction gas distribution. Many scholars often only consider the improvement of current density or power density when performing performance optimization, without considering the influence of gas distribution. However, the uniformity of reaction gas distribution has an important impact on the improvement of cell performance and life, so it is not advisable to improve the output power by losing other performance indicators.
In view of the above deficiencies, this paper first established a three-dimensional CFD model of PEMFC with three-channel serpentine flow fields as the basic optimization model. Secondly, according to a lot of literature reading, eight common influence parameters were selected as the initial decision variables, among which six operating parameters and two diffusion layer structure parameters were included. Several parameters which have great influence on the call comprehensive performance were selected by grey correlation analysis for subsequent optimization. Then the Box-Benhnken design (BBD) is used to design a simulation scheme for the key parameters. Based on the gray correlation theory, the multi-objective optimization about the cell performance is transformed into a single-objective gray correlation degree optimization problem, and the response surface method is applied to construct a second-order regression model between the key parameters and the gray correlation degree. Finally, the optimal parameter combination is obtained by seeking the solution that satisfies the maximum gray correlation degree, and the feasibility of the optimization results is verified by simulation.
2 PEMFC model development
2.1 Model description and assumptions
In this paper, a three-dimensional geometric model of PEMFC was established based on solidworks, as shown in Figure 1. The PEMFC consists of nine parts: anode and cathode collectors, flow channels, gas diffusion layers (GDLs), catalyst layers (CLs) and proton exchange membrane. The flow field type is three-channel serpentine, and the specific geometric parameters of this model are shown in Table 1.
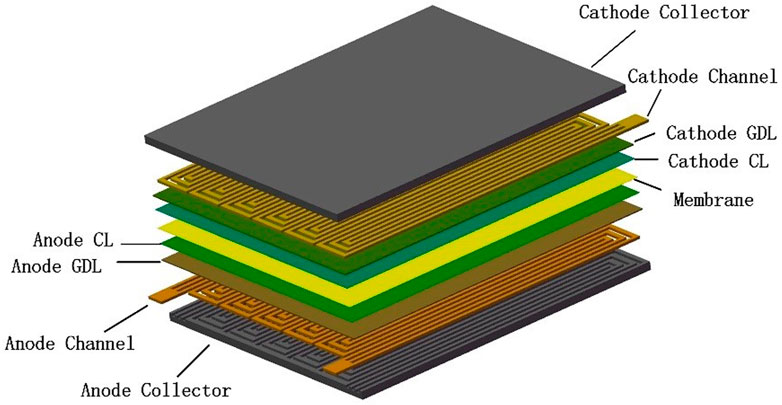
FIGURE 1. Geometric model of PEMFC.
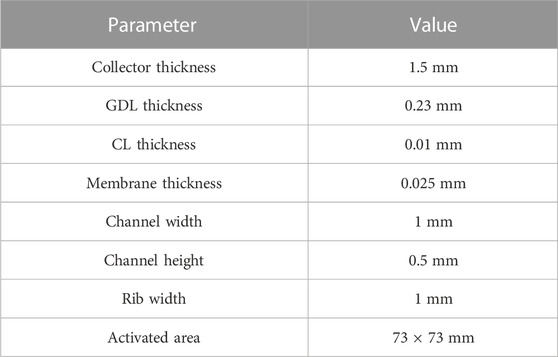
TABLE 1. Main geometric parameters of PEMFC model.
Due to the complexity of the actual operating process of PEMFC. On the premise of fully describing the main reaction process of PEMFC, several assumptions were made in the numerical simulations in order to simplify the model and calculations as follows (Li et al., 2017; Chen et al., 2019; Liu et al., 2022; Yao et al., 2022).
1) PEMFC operation state is steady state;
2) The initial temperature of the fuel cell is constant, and the thermal effect caused by the temperature gradient is not considered;
3) The reactant gases are ideal and incompressible, and the gas flow in the flow channel is laminar;
4) The gas diffusion layers, catalyst layers and membrane are homogeneous models with isotropic porous media;
5) Only protons can permeate the proton exchange membrane, but not the reaction gases.
2.2 Governing equations
2.2.1 Mass conservation equation
Where M and F represent molar mass and Faraday’s constant, respectively,
2.2.2 Momentum conservation equation
Where K is the absolute permeability.
2.2.3 Energy conservation equation
Where
2.2.4 Species conservation equation
2.2.5 Current conservation equation
The Butler-Volmer equations of anode and cathode in the CLs can be respectively expressed as follows:
Where
2.3 Model verification
2.3.1 Grid independence test
Grid independence test can check whether the simulation results will be affected by the number of grids, so as to determine the appropriate number of grids. This paper uses the grid division software ICEM to divide the PEMFC model with four different numbers of grids, and then the four models are simulated and calculated under the same boundary conditions. The error between simulation results and experimental results is shown in Figure 2. When the number of grids is 3,470,688 and 5,958,942, the error is 2.4% and below. Considering the time cost and simulation accuracy, 3,470,688 mesh quantities are selected, and the whole calculation domain is shown in Figure 3.
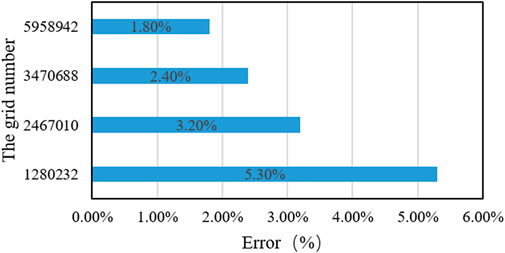
FIGURE 2. Simulation accuracy of different mesh numbers.
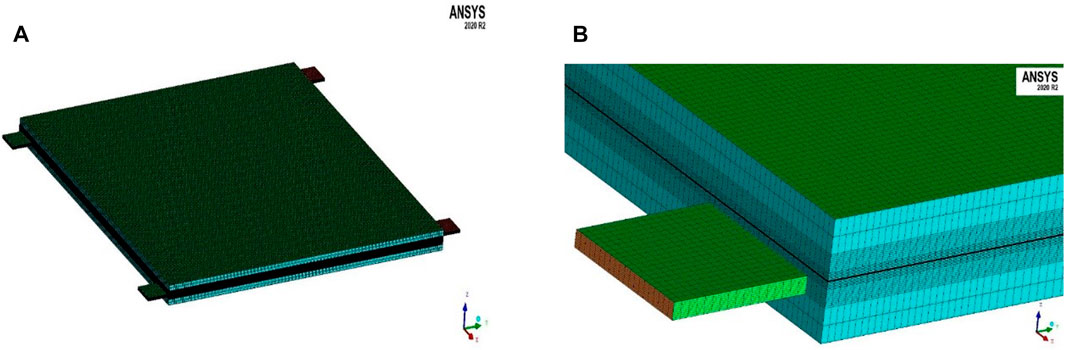
FIGURE 3. (A) Diagram of the overall computing domain (B) Partial diagram of the entrance.
2.3.2 Experimental verification
The mesh file of the PEMFC model is imported into ANYSY FLUENT 2020R2 and the add-on PEMFC module is called to solve the model. The relevant parameters in the model were set as shown in Table 2. The type of inlet boundary was mass-flow inlet, and the type of outlet boundary was pressure-out. The inlet mass flow rate was calculated according to the anode and cathode stoichiometric ratio of 2, relative humidity of 100%, temperature of 80 °C and operating pressure of 1atm.The output current density under different working voltages was calculated under constant voltage. The structure and numerical simulation conditions of the PEMFC used in this paper are basically consistent with the experimental conditions of Li et al. (Li et al., 2017), so the model in this paper is verified by the experimental data of Li et al. The comparison between simulation results and experimental results is shown in Figure 4. At low to medium current densities, the numerical calculation results agree well with the experimental data. When the current density increases to 0.9A/cm2, the simulation results begin to deviate from the experimental results. And the simulation results are always slightly larger than the experimental results. This is because this paper uses a single-phase model for numerical simulation, and the generated water exists in gaseous form by default. In fact, when the current density is larger, the liquid water tends to accumulate in the flow channel, and the liquid water tends to block the pores in the gas diffusion layer and catalyst layer, thus hindering oxygen transport and eventually leading to performance degradation at high current densities. Overall, the numerical simulations are consistent with the trend of experimental results, and the PEMFC model used can be considered effective.
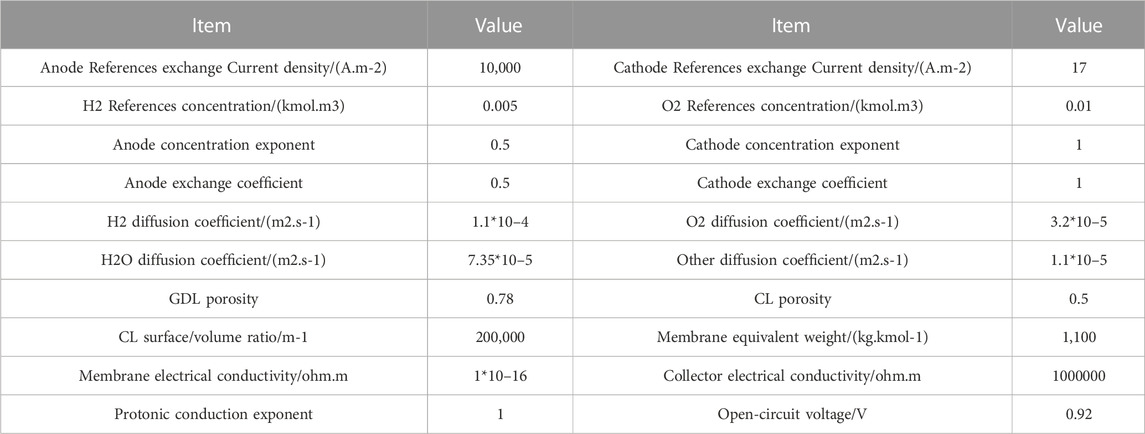
TABLE 2. Parameter Settings of PEMFC numerical model.
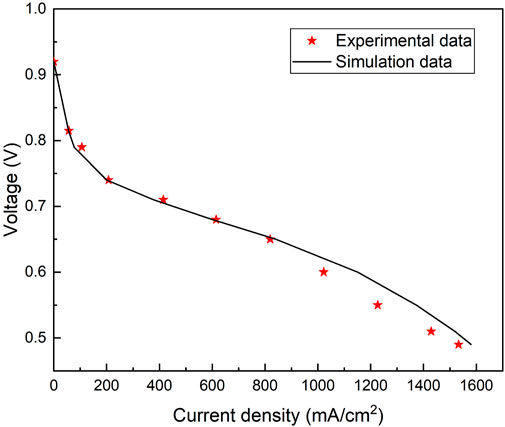
FIGURE 4. Polarization curves of model simulation and experimental data.
3 Research method
3.1 Analysis of significance
In previous parametric optimization studies, people usually select three to six optimization parameters based on experience, without stating the reasons for the selection, so it is somewhat subjective. In this study, we use gray correlation analysis to analyze the significance of the variables before optimization, and select the variables that have a greater impact on the optimization target, which not only can improve the optimization efficiency, but also can get more accurate results.
Gray correlation analysis, a systematic scientific theory first proposed by Jurong Deng in 1982, is feasible for analyzing the degree of influence of multiple variable factors on a specific quality indicator by analyzing the degree of similarity between the geometry of the reference sequence and the comparative sequence to determine the closeness of the association (Yin et al., 2015). Since the units and ranges of each series are different, the original data need to be normalized by dimensionless preprocessing before performing gray correlation analysis. The normalization process can be performed with the following two equations depending on the type of quality characteristics (Lian et al., 2022). If the actual data series has the quality characteristic of “bigger is better”, then equation (13) is used for preprocessing. If the actual data series has the quality characteristic of “smaller is better”, then equation (14) is used for preprocessing (Xu et al., 2020).
Where
After normalizing the test results, the gray correlation coefficient ξ corresponding to each comparison sequence and the reference sequence (all response reference sequence are 1) can be calculated by (Eq. 15).
Where
The gray correlation degree is a weighted sum of gray correlation coefficients, which can be calculated by (Eq. 16), and here the weight of all three indicators is considered to be 0.3333.
Where
Eight common operating parameters and gas diffusion layer structure parameters, namely, temperature, pressure, anode and cathode stoichiometry, anode and cathode relative humidity, anode and cathode gas diffusion layer porosity, were selected for significance analysis to investigate the extent of their effects on three performance indexes, namely, current density, oxygen distribution uniformity and system efficiency of the PEMFC. In order to reduce the calculation time and improve the calculation efficiency, eight factor and three level tests were designed based on the orthogonal design method. The setting of factor levels was shown in Table 3. The three levels of these eight parameters were selected based on the general range and experience of PEMFC parameters (Öztürk et al., 2017; Abraham B & Murugavel K, 2021), and the specific test arrangement is shown in Table 4.

TABLE 3. Parameter settings of orthogonal test.
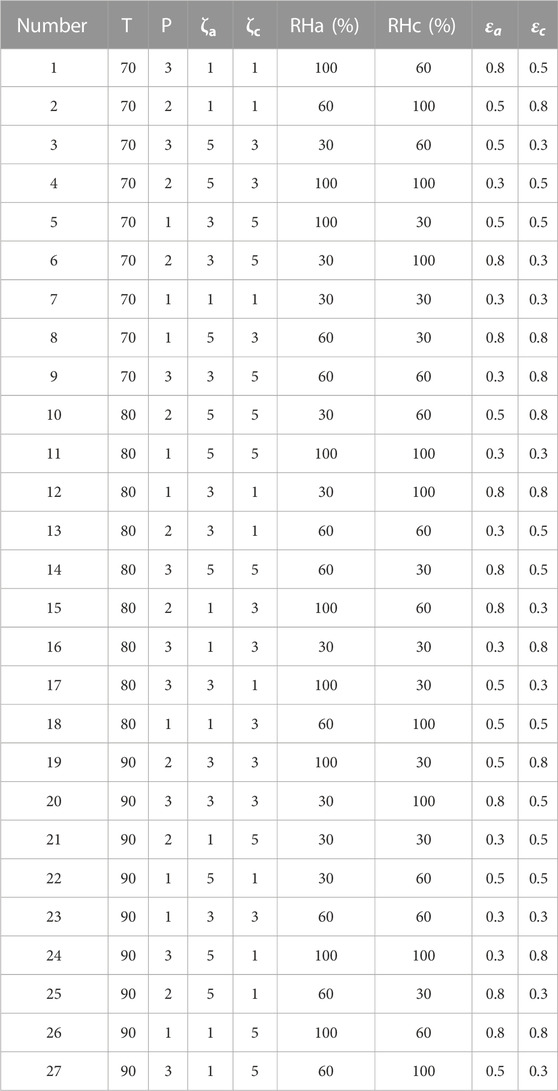
TABLE 4. L27 (38) Orthogonal test table.
3.2 Multi-objective optimization method
Response surface method is a mathematical statistical method commonly used to solve multivariate problems, which can construct a functional relationship between the target and the variables based on the existing measured data, and further solving can obtain the best combination of parameters to satisfy the conditions. Before response surface analysis, the central combination design or BBD method is usually used to design the simulation cases and simulate to get certain data. In this paper, we use BBD method to design simulation cases as shown in Table 7. This method not only can avoid extreme conditions at the test point, but also can perform continuous analysis of the test at all levels. According to the results of significance analysis, the four key influencing parameters of cathode and anode stoichiometry, pressure and cathode relative humidity are used as independent variables, and the optimization objectives are current density, system efficiency and oxygen distribution uniformity. Current density could be directly obtained through simulation calculation, the system efficiency can be calculated by the following formula:
Where
Where
The oxygen distribution uniformity is expressed using the standard deviation of the molar concentration of oxygen at the interface between the cathodic gas diffusion layer and the catalyst layer, and its expression can be defined as (Chen et al., 2019):
Where
The sub-objectives of multi-objective optimization problems are often contradictory to each other. It is impossible to make multiple sub-objectives reach the optimal value together at the same time, only coordination and compromise between them, and the optimization solution is not unique. If a final solution is to be sought. The relative importance degree of each objective, namely, the weight, can be decided in advance. Based on this, the algorithm converts the multi-objective problem into a single-objective problem for solving. For different practical applications, each objective has different weights. In this study, the three indicators are considered equally important. The multiple responses of current density, system efficiency and oxygen distribution uniformity are first transformed into a single objective gray correlation based on gray correlation analysis. Then a second-order prediction model between the Key influencing parameters and the gray correlation is constructed, and the final optimized solution is obtained by solving for the solution that satisfies the maximum gray correlation.
4 Results and discussion
4.1 Key influence parameter selection
The results of the three performance indexes are listed in Table 5 by simulating 27 different sets of working conditions in the orthogonal design. Then according to Eqs 13–16, the grey correlation analysis is carried out on the statistical results, and the grey correlation coefficient and correlation degree are calculated, as shown in Table 5.
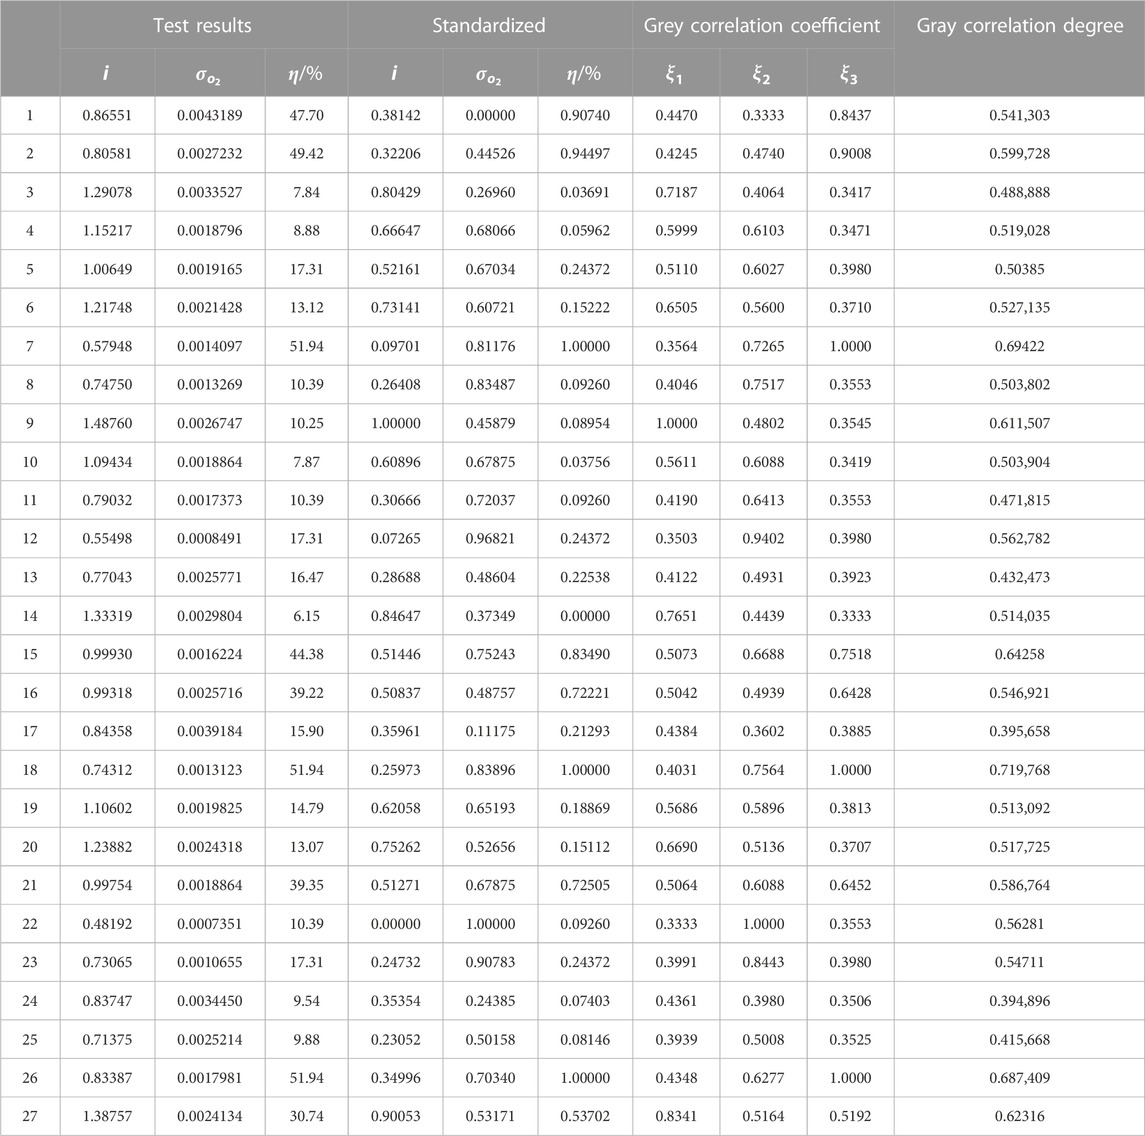
TABLE 5. Results of orthogonal test and grey correlation analysis.
According to the grey correlation analysis theory, the greater the grey correlation degree, the closer the corresponding target sequence is to the optimal (Guo et al., 2019). Figure 5 shows the average grey correlation degree of each parameter level. It can be seen from Figure 5 that the parameter combination with the maximum grey correlation degree, that is, the parameter combination close to the better cell performance, is:T = 70,p = 1,
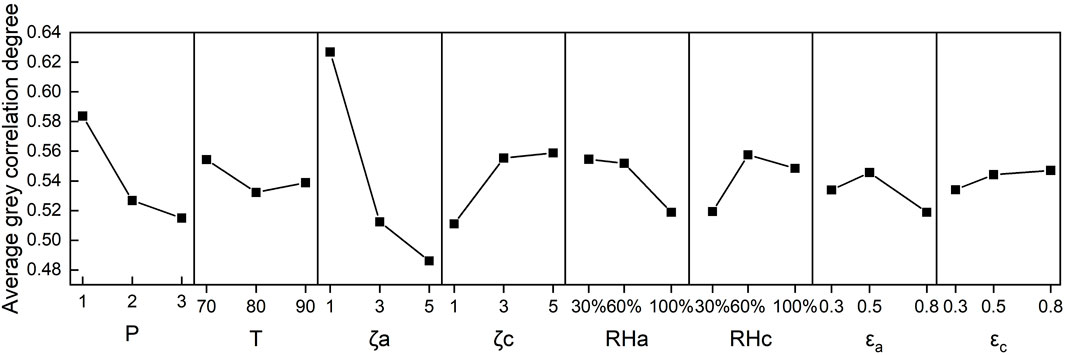
FIGURE 5. Average grey correlation degree of each parameter level.
4.2 Optimization model building and verification
In this section, the optimization model between the key parameters and the response target is mainly combined with the gray correlation analysis method and the response surface method, and the model is validated. In order to reasonably select the test site, BBD was used to design the four-factor and three-level test arrangement, as shown in Table 6. According to the test arrangement, the three performance indicators were numerically simulated and calculated, and then the grey correlation degree was calculated by using the above grey correlation analysis method. The results were collected in Table 6. In order to obtain the optimal parameter combination, it is necessary to accurately construct the mapping relationship between the grey correlation degree and the key influencing parameters. Therefore, Design-expert software is applied to construct the second-order regression model between the response value of the grey correlation degree and the input variables by using the response surface method. The response function is shown in Eq. 25.
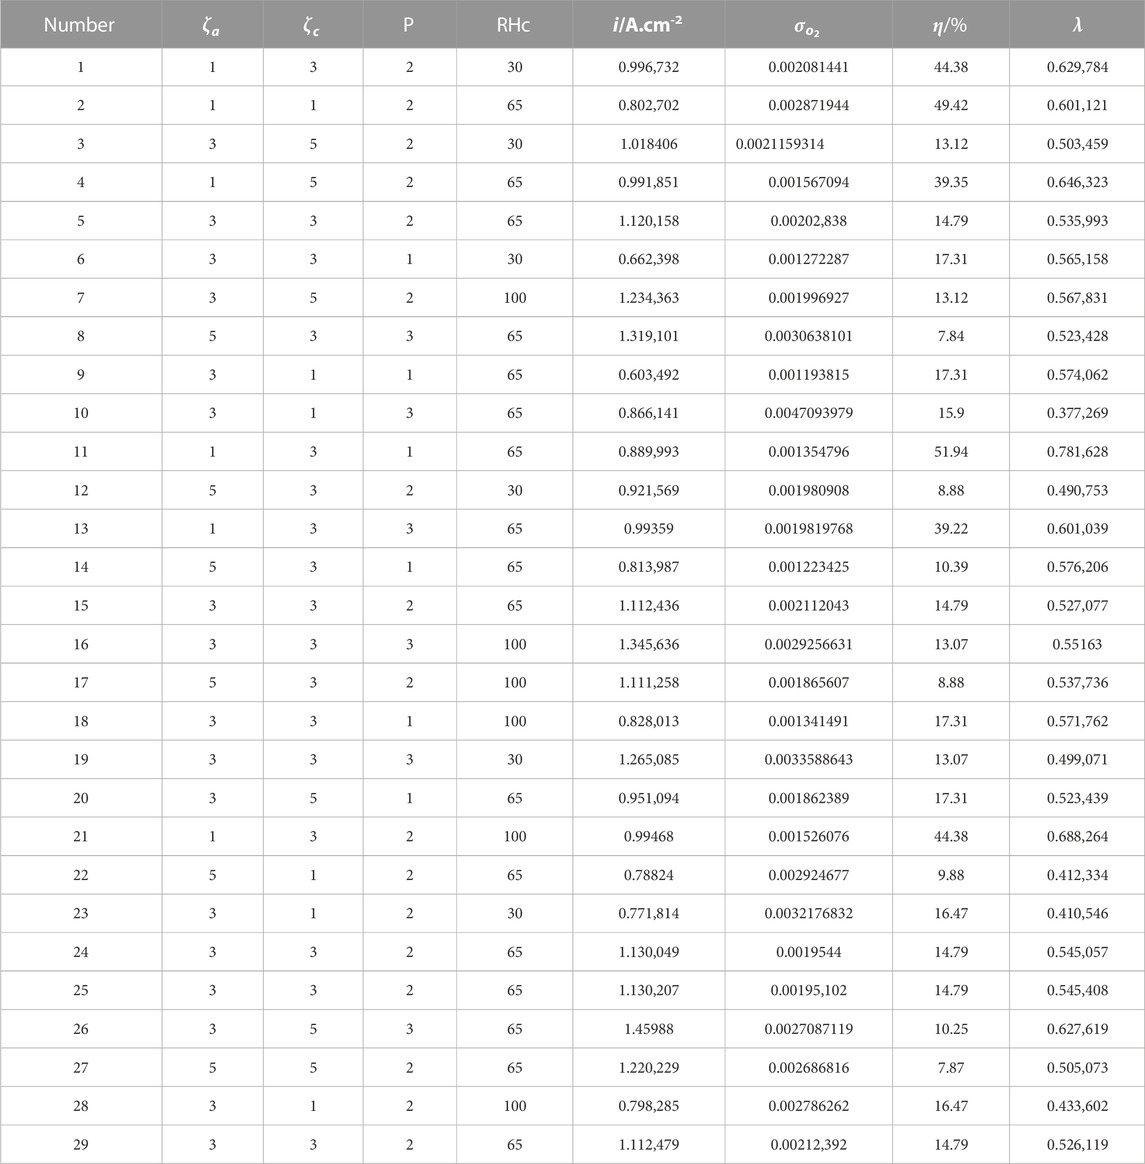
TABLE 6. BBD test arrangement and grey correlation analysis results.
Applying the resulting regression model for data prediction, the results of comparing the experimental and predicted values of gray correlation degree are shown in Figure 6. As shown in the figure, the model predicted values and calculated values are in high agreement, and the average relative error is only 2.23%. Figure 7 is the residual diagram of the prediction model. All data points in the figure are randomly distributed around the 0 value, indicating that the predicted value has a good fit with the sample value. Meanwhile, the ANOVA results of the regression equation in Table 7 show that p < 0.0001, indicating that the prediction model is very significant. R-Sq indicates the fit between the established model and the experimental data, R-Sq of the established model is 96.7%, indicating that the prediction model fits the experimental data very well. R-Sq (adj) is the adjusted R-Sq. R-Sq (adj) = 94.23% is very close to R-Sq, indicating that the prediction model is very reliable. In summary, the regression model established based on gray correlation analysis has a good fitting goodness and predictive ability, and can be solved by the next step of parameter optimization.
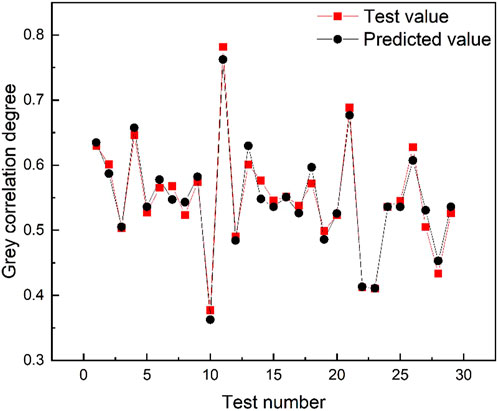
FIGURE 6. Comparison of model predicted value and test value of grey correlation degree.
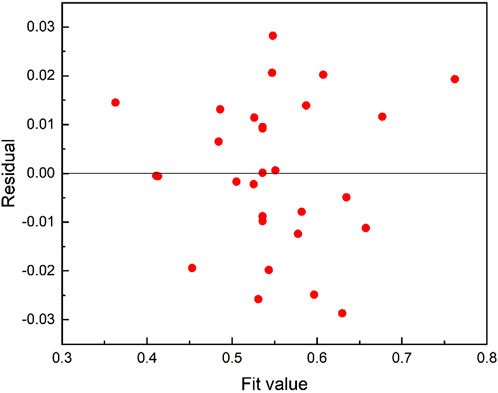
FIGURE 7. Residual diagram of grey relational degree model.
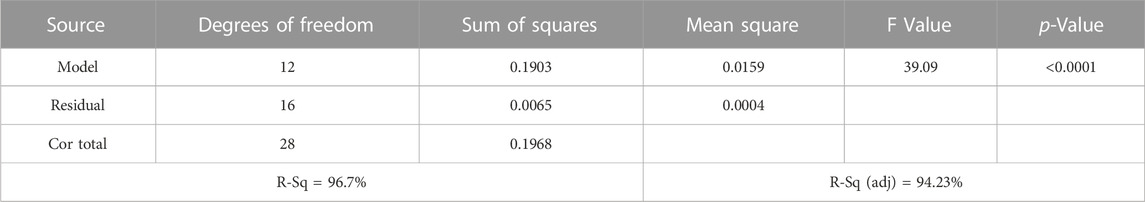
TABLE 7. Results of variance analysis of regression model.
4.3 Optimization results and verification
The influence of key parameters on different targets is reflected by the change of grey correlation degree, so the overall optimization of different targets can be achieved by optimizing the grey correlation degree. The response surface optimizer in Design-expert software is used to optimize and solve the established second-order prediction model within the range of each parameter, and the optimal solution is λ = 0.773. The corresponding parameter combination is as follows:
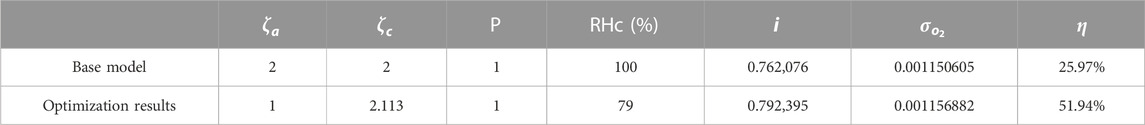
TABLE 8. Performance comparison between the optimization results and the base model.
The polarization curve comparison before and after optimization is shown in Figure 8 It can be clearly seen from the figure that the output current density of the optimized model is higher than that of the basic model in the whole voltage range. Performance improvement is more obvious under low pressure conditions, with better polarization performance. Under the condition of high current density, obvious concentration polarization appears in the basic model, but this phenomenon is not obvious in the optimized model, mainly because the optimized model has a higher concentration of reactants in the catalytic layer, resulting in less concentration polarization loss.

FIGURE 8. Comparison of polarization curves between the basic model and the optimized model.
Figure 9 shows the current flux nephogram of the cathode membrane interface before and after optimization. It can be seen from the figure that the optimized model has a higher current density. This in turn confirms the results of Figure 8. Figure 10 represents the cloud plot of oxygen distribution at the cathode GDL-CL interface of the two models. From the figure, it can be seen that the oxygen distribution uniformity of the optimized model is almost the same as that of the basic model, but the molar concentration of oxygen in the optimized model is higher than that of the basic model. This is mainly because the cathode inlet air stoichiometric increases, and more reactants are added to the cell. Moreover, the mass fraction of oxygen increases with the decrease of relative humidity, resulting in more oxygen being transported to the catalyst layer. Thus enabling the optimized model to generate more current, which is also consistent with Figure 9. On the basis of ensuring the uniformity of oxygen distribution on CL, increasing the molar concentration of oxygen can not only improve the output performance of the cell, but also alleviate the aging of PEMFC. The system efficiency increases because the anode stoichiometric decreases while the output power increases, which can be deduced from equations 17–23.
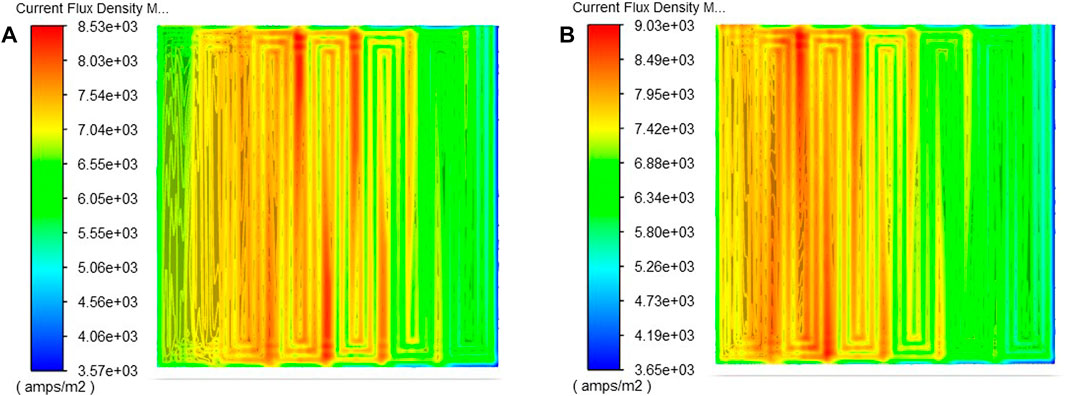
FIGURE 9. Current density distribution nephogram at the m-cl interface of cathode: (A) Basic model; (B) The optimization model.
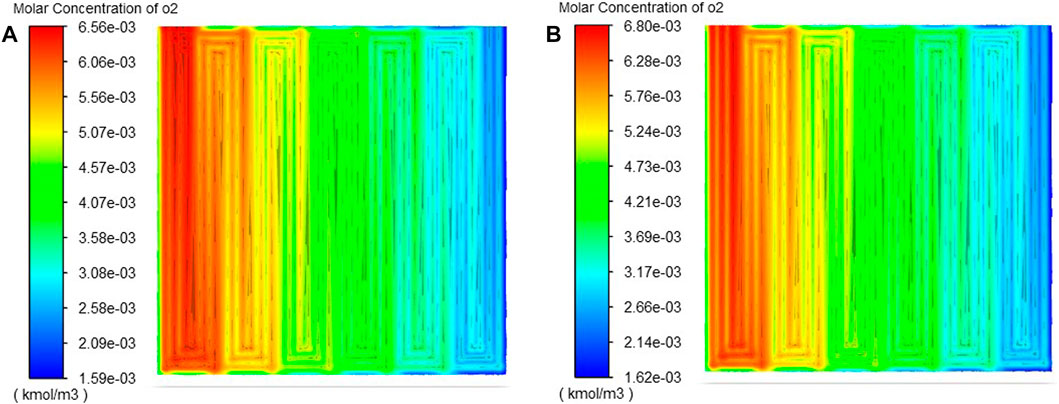
FIGURE 10. Oxygen distribution nephogram at the gdl-cl interface of cathode (A) Basic model; (B) The optimization model.
5 Conclusion
In this paper, a multi-objective performance optimization design method of PEMFC based on gray correlation analysis and response surface method is proposed with current density, oxygen distribution uniformity and system efficiency as optimization objectives. Firstly, the parameters that have significant influence on the comprehensive objectives are selected as decision variables by using gray correlation analysis. Then the influence of key parameters on different objectives is reflected as a whole through the gray correlation degree by assigning weights. The second-order model between the key influence parameters and the gray correlation degree is constructed by applying the response surface method, so as to seek the optimal combination of parameters. The following conclusions are drawn.
1) The influence of the eight influencing parameters considered in this paper on the comprehensive performance of PEMFC is ranked as:
2) The established gray correlation prediction model shows by ANOVA that its prediction accuracy is high and can better describe the response of the gray correlation degree on the design variables.
3) The optimal combination of operating parameters was obtained as:
4) The optimization method combining grey correlation analysis and response surface method can transform multi-objective optimization into single-objective optimization, and quickly find a suitable unique optimal solution. It can provide a better reference for the optimization of PEMFC parameters because the multi-objective optimization solution is unique and the overall performance is improved compared with previous studies.
Data availability statement
The original contributions presented in the study are included in the article/supplementary material, further inquiries can be directed to the corresponding author.
Author contributions
GW provided research ideas and participated in the revision and finalization of the paper. NL participated in the entire research process and the writing and revision of the first draft. All authors contributed to the article and approved the submitted version.
Acknowledgments
This work is supported by National Natural Science Foundation of China (Grant No. 51976016) and supported by the Natural Science Foundation of Hunan Province, China (Grant No. 2023JJ10043).
Conflict of interest
The authors declare that the research was conducted in the absence of any commercial or financial relationships that could be construed as a potential conflict of interest.
Publisher’s note
All claims expressed in this article are solely those of the authors and do not necessarily represent those of their affiliated organizations, or those of the publisher, the editors and the reviewers. Any product that may be evaluated in this article, or claim that may be made by its manufacturer, is not guaranteed or endorsed by the publisher.
References
Abraham, B. P., and Murugavel, K. K. (2021). Influence of catalyst layer and gas diffusion layer porosity in proton exchange membrane fuel cell performance. Electrochimica Acta 389, 138793–138806. doi:10.1016/j.electacta.2021.138793
Ang, S. M. C., Brett, D. J. L., and Fraga, E. S. (2010). A multi-objective optimisation model for a general polymer electrolyte membrane fuel cell system. J. Power Sources, 195 (9), 2754–2763. doi:10.1016/j.jpowsour.2009.10.095
Chen, H., Liu, B., Zhang, T., and Pei, P. (2019). Influencing sensitivities of critical operating parameters on PEMFC output performance and gas distribution quality under different electrical load conditions. Appl. Energy 255, 113849–113862. doi:10.1016/j.apenergy.2019.113849
Chen, X., Chen, Y., Liu, Q., Xu, J., Liu, Q., Li, W., et al. (2021). Performance study on a stepped flow field design for bipolar plate in PEMFC. Energy Rep., 7, 336–347. doi:10.1016/j.egyr.2021.01.003
Cheng, Z., Luo, L., Huang, B., and Jian, Q. (2021). Effect of humidification on distribution and uniformity of reactants and water content in PEMFC. Int. J. Hydrogen Energy 46 (52), 26560–26574. doi:10.1016/j.ijhydene.2021.05.129
Dehsara, M., and Kermani, M. J. (2013). The effects of operating parameters on the performance of proton exchange membrane fuel cells. Mechanics 19 (6), 649–656. doi:10.5755/j01.mech.19.6.5989
Ghasabehi, M., Shams, M., and Kanani, H. (2021). Multi-objective optimization of operating conditions of an enhanced parallel flow field proton exchange membrane fuel cell. Energy Convers. Manag. 230, 113798–113819. doi:10.1016/j.enconman.2020.113798
Guo, J., Shi, Y., Chen, Z., Yu, T., Zhao, P., and Shirinzadeh, B. (2019). Optimal parameter selection in robotic belt polishing for aeroengine blade based on GRA-RSM method. Symmetry 11 (12), 1526–1538. doi:10.3390/sym11121526
Hasheminasab, M., Kermani, M. J., Nourazar, S. S., and Khodsiani, M. H. (2020). A novel experimental based statistical study for water management in proton exchange membrane fuel cells. Appl. Energy 264, 114713–114729. doi:10.1016/j.apenergy.2020.114713
Kurnia, J. C., Sasmito, A. P., and Shamim, T. (2019). Advances in proton exchange membrane fuel cell with dead-end anode operation: A review. Appl. Energy 252, 113416–113434. doi:10.1016/j.apenergy.2019.113416
Li, H., Xu, B., Lu, G., Du, C., and Huang, N. (2021). Multi-objective optimization of PEM fuel cell by coupled significant variables recognition, surrogate models and a multi-objective genetic algorithm. Energy Convers. Manag. 236, 114063–114075. doi:10.1016/j.enconman.2021.114063
Li, W., Zhang, Q., Wang, C., Yan, X., Shen, S., Xia, G., et al. (2017). Experimental and numerical analysis of a three-dimensional flow field for PEMFCs. Appl. Energy 195, 278–288. doi:10.1016/j.apenergy.2017.03.008
Lian, G., Liu, Z., Zhang, Y., Que, L., Chen, C., and Yue, K. (2022). Grey relational analysis–based composite coating property optimization fabricated by laser cladding. Int. J. Adv. Manuf. Technol. 120, 7985–7996. doi:10.1007/s00170-022-09305-x
Lim, B. H., Majlan, E. H., Daud, W. R. W., Husaini, T., and Rosli, M. I. (2016). Effects of flow field design on water management and reactant distribution in PEMFC: A review. Ionics 22 (3), 301–316. doi:10.1007/s11581-016-1644-y
Lingchao Xia, M. N., Xu, Q., Cheng, C., and Cheng, C. (2021). Optimization of gas diffusion layer in high temperature PEMFC with the focuses on thickness and porosity. Appl. Energy 300, 117357–117369. doi:10.1016/j.apenergy.2021.117357
Liu, S., Chen, C., Tan, J., Hu, H., and Xuan, D. (2022). Multi-objective optimization of porous layers for proton exchange membrane fuel cells based on neural network surrogate model. Int. J. Energy Res. 46 (14), 19796–19813. doi:10.1002/er.8503
Liu, Z., Zeng, X., Ge, Y., Shen, J., and Liu, W. (2017). Multi-objective optimization of operating conditions and channel structure for a proton exchange membrane fuel cell. Int. J. Heat Mass Transf. 111, 289–298. doi:10.1016/j.ijheatmasstransfer.2017.03.120
Lu, J. B., Wei, G. H., Zhu, F. J., Yan, X. H., and Zhang, J. L. (2019). Pressure effect on the PEMFC performance. Fuel Cells 19 (3), 211–220. doi:10.1002/fuce.201800135
Na, W., and Gou, B. (2007). The efficient and economic design of PEM fuel cell systems by multi-objective optimization. J. Power Sources 166 (2), 411–418. doi:10.1016/j.jpowsour.2007.01.022
Öztürk, A., Fıçıcılar, B., Eroğlu, İ., and Bayrakçeken Yurtcan, A. (2017). Facilitation of water management in low Pt loaded PEM fuel cell by creating hydrophobic microporous layer with PTFE, FEP and PDMS polymers: Effect of polymer and carbon amounts. Int. J. Hydrogen Energy 42 (33), 21226–21249. doi:10.1016/j.ijhydene.2017.06.202
Parekh, A. (2022). Recent developments of proton exchange membranes for PEMFC: A review. Front. Energy Res. 10. doi:10.3389/fenrg.2022.956132
Sauermoser, M., Kizilova, N., Pollet, B. G., and Kjelstrup, S. (2020). Flow field patterns for proton exchange membrane fuel cells. Front. Energy Res. 8. doi:10.3389/fenrg.2020.00013
Wang, Z., and Li, L. (2021). Optimization of process parameters for surface roughness and tool wear in milling TC17 alloy using Taguchi with grey relational analysis. Adv. Mech. Eng. 13 (2), 168781402199653–168781402199658. doi:10.1177/1687814021996530
Xu, M., Zhou, C., Huang, X., Zhang, Z., and Wang, T. (2020). Multiobjective optimization of 316L laser cladding powder using gray relational analysis. J. Mater. Eng. Perform. 29 (12), 7793–7806. doi:10.1007/s11665-020-05278-8
Xu, Y., Chang, G., Zhang, J., Li, Y., and Xu, S. (2021). Investigation of inlet gas relative humidity on performance characteristics of PEMFC operating at elevated temperature. World Electr. Veh. J. 12 (3), 110–121. doi:10.3390/wevj12030110
Yang, Y., Chen, Z., Sun, X., Yao, S., Zhang, X., and Liu, W. (2023). Li4SiO4 adsorbent derived from industrial biomass fly ash for high-temperature CO2 capture. Fuel 337, 126853–126862. doi:10.1016/j.fuel.2022.126853
Yao, J., Wu, Z., Wang, H., Yang, F., Xuan, J., Xing, L., et al. (2022). Design and multi-objective optimization of low-temperature proton exchange membrane fuel cells with efficient water recovery and high electrochemical performance. Appl. Energy 324, 119667–119685. doi:10.1016/j.apenergy.2022.119667
Yin, Y.-m., Cui, H.-y., Hong, M., and Zhao, D.-y. (2015). Prediction of the vertical vibration of ship hull based on grey relational analysis and SVM method. J. Mar. Sci. Technol. 20 (3), 467–474. doi:10.1007/s00773-014-0299-5
Yong, Z., Shirong, H., Xiaohui, J., Yuntao, Y., Mu, X., and Xi, Y. (2022). Performance study on a large-scale proton exchange membrane fuel cell with cooling. Int. J. Hydrogen Energy 47 (18), 10381–10394. doi:10.1016/j.ijhydene.2022.01.122
Zeng, X., Ge, Y., Shen, J., Zeng, L., Liu, Z., and Liu, W. (2017). The optimization of channels for a proton exchange membrane fuel cell applying genetic algorithm. Int. J. Heat Mass Transf. 105, 81–89. doi:10.1016/j.ijheatmasstransfer.2016.09.068
Zhang, Q., Lin, R., Técher, L., and Cui, X. (2016). Experimental study of variable operating parameters effects on overall PEMFC performance and spatial performance distribution. Energy 115, 550–560. doi:10.1016/j.energy.2016.08.086
Keywords: PEMFC, grey correlation analysis, response surface method, performance optimization, multi-objective optimization
Citation: Wu G and Luo N (2023) Multi-objective optimization of PEMFC performance based on grey correlation analysis and response surface method. Front. Energy Res. 11:1206418. doi: 10.3389/fenrg.2023.1206418
Received: 15 April 2023; Accepted: 16 May 2023;
Published: 25 May 2023.
Edited by:
Xiaohuan Zhao, Jinan University, ChinaCopyright © 2023 Wu and Luo. This is an open-access article distributed under the terms of the Creative Commons Attribution License (CC BY). The use, distribution or reproduction in other forums is permitted, provided the original author(s) and the copyright owner(s) are credited and that the original publication in this journal is cited, in accordance with accepted academic practice. No use, distribution or reproduction is permitted which does not comply with these terms.
*Correspondence: Na Luo, TE5BNDMxNkAxNjMuY29t