 Mimi Li
 Juchuan Dai1*
- 1School of Mechanical Engineering, Hunan University of Science and Technology, Xiangtan, China
- 2Key Laboratory of Knowledge Processing and Networked Manufacture, Hunan University of Science and Technology, Xiangtan, China
In large-scale wind turbines, the force state of the pitch system greatly influences safe operation and service life. This paper provides a novel method to estimate blade pitch load, bearing friction torque, and motor pitch torque. In this method, the force equilibrium equations are established by investigating the force of the pitch system under multiple operating conditions. The multidimensional BIN method is employed to classify the supervisory control and data acquisition (SCADA) data of wind turbines into several intervals. The multidimensional scatter data is processed in a single-valued way. Then, the estimating model of the pitch system forces is established by combining the obtained data and the equilibrium equations. Taking a 2 MW wind turbine as an example, the variation characteristics of blade pitch load, bearing friction torque, and motor pitch torque under multiple operating conditions are analyzed. Some interesting and valuable conclusions are obtained. For example, when the wind speed increases, the blade pitch load increases significantly in the maximum wind energy tracking region, but there is no obvious change in the observed constant power output region. The wind speed and azimuth have little effect on the bearing friction torque. The variation trend of motor pitch torque is consistent with that of blade pitch load in the maximum wind energy tracking region.
1 Introduction
Wind energy is renewable energy with the prospect of large-scale development. The research and development (R&D), installation, and operation of large wind turbines are booming all over the world. Optimizing the design and operation of large wind turbines has become a hot issue in the industry. The pitch system is one of the key components of large-scale wind turbines (Rosemeier et al., 2016). During the operation of wind turbines, the pitch system bears complex loads and has multiple working conditions, which causes frequent failures (Dai et al., 2022), for example, the pitch brake failure and the pitch bearing breakage (He et al., 2021; Li and Wang, 2021). Relevant statistical data show that the failures of pitch systems account for more than 40% of all wind turbine failures, resulting in more than 30% of wind turbine downtime (Bi et al., 2014). The failure of the pitch control system is closely related to its force state. However, in the process of wind turbine operation, the force state of the pitch system is very complex, and it is difficult to measure with sensors. Obtaining a clear understanding of the force state of the pitch system will be beneficial to the design, operation, and maintenance of wind turbines.
Recently, the force state of the pitch system has received considerable attention in academic and engineering circles. A lot of relevant theoretical research works have been carried out. Dai et al. deduced the blade pitch load expression considering the aerodynamics, centrifugal force, and gravity (Dai et al., 2010; Dai et al., 2011). Liu et al. applied the Fourier transform formula to calculate the gear meshing stress (Liu et al., 2019). There are also some studies to improve the force through control. Xu et al. used the improved fuzzy proportional control strategy to reduce the ultimate load at the blade root (Xu et al., 2020). Jiao et al. designed a novel adaptive pitch controller to predict the aerodynamic load of wind turbines (Jiao et al., 2018). Abdelbaky et al. established a nonlinear mathematical model to achieve optimal control based on the MPC (Abdelbaky et al., 2020). Yuan et al. adopted a robust multivariate pitch strategy to analyze periodic variations of blade load (Yuan et al., 2020). Some studies are also carried out through experiments and simulation (Wang and Chiang, 2016; Cheon et al., 2019; Wang et al., 2019). Despite these research works, the actual force state of the wind turbine pitch system has not been completely determined. This is because large wind turbines are installed and debugged on-site, and the actual performance can only be obtained after operation. The pitch system includes blade, pitch bearing, pitch gearbox, pitch drive motor, and other components. So, the blade pitch load, bearing friction torque, and motor pitch torque can only be obtained through the analysis of on-site operation data. At present, the on-site SCADA data of wind turbines are widely used, mainly for performance analysis, condition evaluation, and fault diagnosis (Chen et al., 2013). For example, Zeng et al. quantitatively described the oil tank temperature of wind turbine gearboxes based on SCADA data (Zeng et al., 2022). Astolfi conducted support vector regression analysis for power monitoring based on SCADA data (Astolfi, 2021). Wei et al. established a wind turbine aging evaluation model based on SCADA data by introducing four aging evaluation indicators (Wei et al., 2021). Neshat et al. estimated the power output of Swedish onshore wind turbines by optimizing the historical SCADA data (Neshat et al., 2021). Bhargava et al. analyzed the aerodynamic load of a 2.1 MW wind turbine based on blade element momentum (BEM) and SCADA data (Bhargava et al., 2020). Wei et al. detected faults in encoders and pitch motors based on an improved RVM neural network algorithm and SCADA data (Wei et al., 2020). McKinnon et al. used the isolated forest machine learning method to process SCADA data for pitch system fault predicting (McKinnon et al., 2021). Korkos et al. used ANFIS technology to analyze 10-year SCADA data and established a fault detection model for the pitch system (Korkos et al., 2022). Correa-Jullian et al. employed a quantum kernel classification method to detect faults in the pitch system (Correa-Jullian et al., 2022). Yin et al. detected high-temperature faults of the pitch motor by using the ensemble learning-based method (Yin et al., 2022).
In theory, the SCADA data includes wind speed, rotational speed, power, pitch angle, pitch motor current, and other information, covering various working conditions of wind turbines. Therefore, it is a new idea to reconstruct the pitch system load from SCADA data. How to establish a connection between SCADA data and pitch load is the key to solve this problem. A simple analysis of SCADA data is also not feasible, and it needs to be combined with the physical model of the pitch system. On the other hand, SCADA data contains a lot of noise data, so how to preprocess the data is also an important issue. Starting from these scenarios, this paper creatively proposes solutions, and the main contributions are as follows.
• All the blade pitch load, bearing friction torque, and motor pitch torque are investigated.
• The force equilibrium equations of the blade are established.
• The multidimensional BIN method is employed to preprocess SCADA data.
• The estimating model of the pitch system forces is established.
• The variation characteristics of pitch load under multiple operating conditions are analyzed.
The remaining part is organized as follows. In Section 2, the theoretical analysis of the forces acting on the pitch system is carried out, including the theoretical forces analysis of the pitch system and the force equilibrium equations. In Section 3, the force estimation model of the pitch system is established, including SCADA data preparation, use of the multidimensional BIN method, and force estimation model of the pitch system. The force characteristic investigation of the pitch system based on SCADA data is shown in Section 4. In this section, all the blade pitch load, bearing friction torque, and motor pitch torque are investigated. Finally, Section 5 ends the paper by summarizing the main achievements.
2 Theoretical analysis of forces acting on pitch system
2.1 Structure of pitch system
The pitch system structure of a 2 MW wind turbine is shown in Figure 1. A three-stage planetary reducer connects the pitch motor to the drive gear. The drive gear engages with the inner gear ring, and the blade is bolted onto the inner gear ring. When the pitch controller gives a pitch control command, the pitch motor will produce output torque. It passes through the transmission shaft and reduction mechanism and finally, through the drive gear
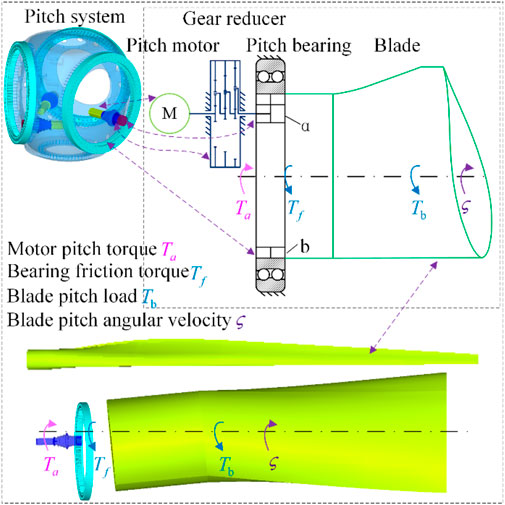
FIGURE 1. Pitch system of wind turbines.
The forces acting on the pitch system are very complex. Here, three main forces that affect the behavior of the pitch system are discussed, namely, motor pitch torque (
In SCADA data, motor pitch torque, blade pitch load, and bearing friction torque are not directly recorded. However, the current of the pitch motor is collected and stored at all times. This provides the possibility for indirect calculation of motor pitch torque. Neglecting the motor’s empty torque
where,
2.2 Force equilibrium equations
Maximum wind energy tracking region
When the wind speed is greater than the cut-in wind speed and less than the rated wind speed, wind turbines usually capture the wind energy to output electric energy under the condition of a constant pitch angle. In this region, wind turbines are expected to maximize the use of wind energy, which is called the maximum wind energy tracking region. Since the pitch angle is constant, the bearing friction torque is static friction torque. Then, motor pitch torque
If the influence of bearing friction moment is ignored, the blade pitch load can be calculated from the motor pitch torque in the maximum wind energy tracking region.
Constant power output region
When the wind turbine runs in the constant power output region, the wind speed reaches or exceeds the rated wind speed, and the blade pitch angle is controlled by feedback. In this region, the wind speed may remain constant at some time, which means that the pitch angle is also constant. Then, the mechanical equilibrium equation is also written as
In the constant power output region, if the wind speed continues to decrease, the blade pitch angle will be driven to decrease to increase the windward area, which is called the open-pitch state, as shown in Figure 2. Motor pitch torque
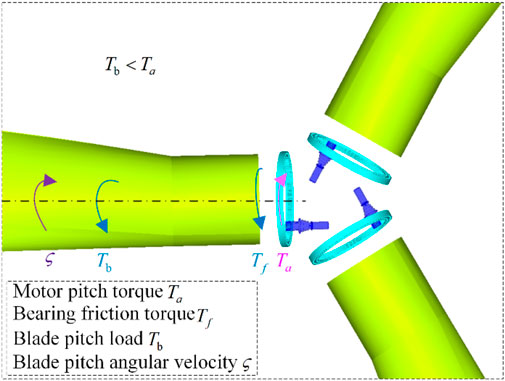
FIGURE 2. Open-pitch state of wind turbines.
When wind speed tends to increase, the blade pitch angle turns in the direction of becoming larger to reduce the windward area, which is called the smooth-pitch state, as shown in Figure 3. Blade pitch load
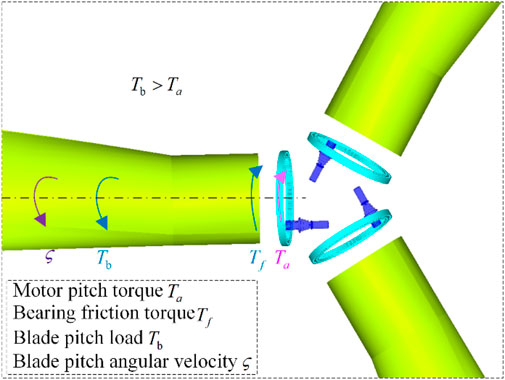
FIGURE 3. Smooth-pitch state of wind turbines.
When operating in the constant power output region, the blade rotation direction is different when the blade is in the open-pitch and smooth-pitch state, and the motor pitch torque is different. If the blades have the same windward surface and aerodynamic force, the blade pitch load and bearing friction moment are the same regardless of the rotation direction. Therefore, from Eqs 1, 3, it is easy to obtain blade pitch load when the pitch system is at a standstill state in the constant power output region. Combined with Eqs 4, 5 the blade pitch load and bearing friction torque can be obtained from the motor pitch torque when the blade is in the state of open-pitch and smooth-pitch. In other words, the blade pitch load and bearing friction torque can be calculated from the motor pitch torque in the constant power output region. It must be pointed out that in the process of blade movement, there is inertia force generated by acceleration start and deceleration stop. Considering that the blade is a large inertia body, in order to minimize the dynamic load of the pitch system, the blade angular acceleration is controlled below
For a certain wind turbine, its rotor hub structure, blade geometry and its mass distribution, and blade aerodynamic characteristics are unchanged. If the influence of wind direction, yaw, and other factors is not considered, the blade pitch load depends on wind speed, rotor speed, blade azimuth, and pitch angle. When the wind turbine is in the maximum wind energy tracking region, the wind speed is lower than the rated wind speed, the blade will not be started to pitch, and the pitch angle remains unchanged. By controlling rotor speed
3 Force estimation model of pitch system
3.1 Data preparation
In the raw SCADA data, even though it is standard operating state data, it will have both null and zero values because of the influence of external interference in the sensing test and the communication transmission process. The raw field data must be processed, including outlier elimination, null value supplement, etc. These works are collectively referred to as data preprocessing (Zhang et al., 2019).
After processing the raw SCADA data of wind turbines, wind speed, rotor speed, blade azimuth (hub angle), output power, pitch motor current, pitch angle, and other wind turbine state data are extracted. If the number of wind turbine state parameters is
Since the data is sampled and recorded at a fixed frequency, each time corresponds to a particular moment. If the sampling frequency is set to
For a specific parameter data, its corresponding data is a column of the matrix. Here, for the convenience of later discussion, the wind speed, rotor speed, blade azimuth angle, pitch angle, and pitch motor current parameters are listed as follows
The motor pitch torque
The average angular velocity and average acceleration of blade pitch can be calculated by using the pitch angle data of each moment as follows.
where,
3.2 Multidimensional BIN method
Due to many SCADA data samples, it is difficult to observe the relationship between parameters from the raw data scatter plots. Figure 4 shows a scatter plot of the relationship between motor pitch torque and wind speed obtained from SCADA raw data. It can be seen from the figure that the change in motor pitch torque is very complex, predominantly when the wind turbine operates in an area with high wind speed. Moreover, since the wind speed dimension of SCADA raw data is m/s, and one decimal place is reserved, it is inevitable that the same wind speed value corresponds to multiple motor pitch moments, as shown in the small figure. Therefore, in SCADA data analysis, the BIN method is usually used to simplify the processing, find out the relationship between parameters, and then put forward a mathematical model reflecting the relationship.

FIGURE 4. Effect of wind speed on motor pitch torque.
The BIN method is to divide a parameter range into the data set into several small intervals. Then, the relevant parameters of each small interval data sample are statistically analyzed, and the statistical average value of each parameter is taken as the relevant parameter value of the new sample (small interval). In this way, the relatively stable relationship between parameters can be more clearly observed and obtained by analyzing these new samples with a small number. In essence, the BIN method is a smoothing method to eliminate noise and average filtering to obtain a simpler and single-valued parameter relationship while ignoring the influence of parameter changes between small intervals.
Taking the relationship between wind speed and motor pitch torque as an example, wind speed is an independent variable, and motor pitch torque is a dependent variable. The wind speed distribution range or value range obtained from SCADA data is
To obtain more stable results, the abnormal samples can also be eliminated according to the PauTa criterion, and then the average value of the new sample parameters can be recalculated using Eq. 11. In fact, the SCADA data samples are very large, and some so-called abnormal samples have little impact on the statistical mean value. Generally, abnormal samples are not removed. Moreover, because the data sample is very large, it is assumed that the wind speed in each small interval is approximately uniformly distributed. Thus, Eq. 11 is simplified to
Subsequently, the BIN method used above to analyze the effects of a single parameter is extended to a multidimensional space. The multidimensional BIN method is applied to analyze problems with complex effects of multiple parameters. Firstly, these parameters are divided into small intervals within their value domain at certain intervals, ignoring parameter effects within each small interval. Then, the small interval BIN method is used for statistical analysis of the concerned parameters in their intervals. At this time, other parameters are within a fixed range, which means that other parameters remain unchanged. Finally, the small interval BIN method can be used for statistical analysis of all parameters in their intervals to obtain the influence rules of these parameters. To put it vividly, this is to mine a small multidimensional space from a large multidimensional data sample space composed of multiple parameters and carry out statistical analysis on the data samples existing in this small multidimensional space. Then, according to the research purpose, the BIN method can be carried out on the concerned parameters to obtain the influence and relationship of the concerned parameters, as shown in Figure 5. In the figure, wind speed
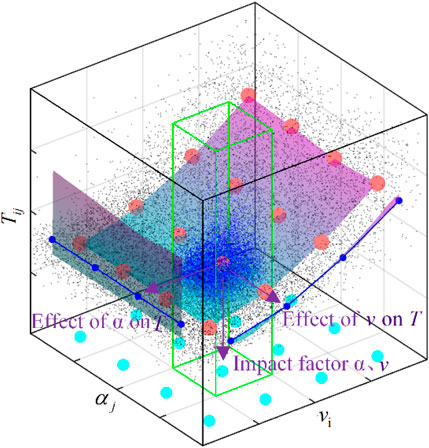
FIGURE 5. Multidimensional BIN method visualization.
3.3 Force estimation model of pitch system
The generation process of wind turbines consists of two operating zones: the maximum wind energy tracking region and the constant power output region. Therefore, the pitch system has two stages: constant pitch and variable pitch. In addition, with the change of wind speed, the pitch stage has three states: smooth-pitch state, open-pitch state, and standstill state. Therefore, corresponding to the generation process of wind turbines, the pitch system exists in four different states: entire constant pitch state, smooth-pitch state, open-pitch state, and standstill state. As mentioned before, the force equilibrium equations of the blade are different for each state. Therefore, the force analysis of the pitch system based on field SCADA data should first obtain the data subset corresponding to the four states, that is, the SCADA data set should be decomposed.
The pitch system’s operating state is essentially the blade’s rotating state. According to the size and direction of the blade pitch angle, the running state of the pitch system can be determined. Because of the installation and test errors of wind turbines and the disturbance caused by the dynamic characteristics of wind energy and wind turbines, in the SCADA data, even when the wind speed is low, and the pitch system does not change, the pitch angle is not 0° but has a certain initial value of
Let
In this way, the data sample set is decomposed into four subsets of state data. According to the four state data subsets, the blade pitch load, bearing friction torque, and motor pitch torque of the four states of the variable pitch system can be obtained respectively by using the multidimensional BIN method and based on the previous force equilibrium equation.
In the constant pitch state, the corresponding wind turbine operation is in the maximum wind energy tracking region. According to the value range of wind speed and azimuth, it is divided into m and n intervals, and then the sample set
In this case, the corresponding is
According to the force equilibrium equation (Eq. 2) of the blade, the corresponding blade pitch load can be obtained from the motor pitch torque of Eq. 1 as
In the pitch state, the corresponding wind turbine operation is in the constant power output region. According to the value range of wind speed and azimuth, it is divided into m and n small intervals respectively, so that
In the pitch system standstill state, from the data set
When the pitch system is in the smooth-pitch or open-pitch state, the blades are in the rotating phase, and the bearing friction torque could be considered. The pitch system force analysis shows that the motor pitch torque depends on the blade pitch load, bearing friction torque, and blade rotation direction. The blade pitch load and bearing friction torque depend on the wind speed and blade azimuth. When the wind speed and blade azimuth are the same, the blade pitch load and the bearing friction torque are the same in the smooth-pitch or open-pitch state. Therefore, from the data sets
Then, the corresponding blade pitch loads and bearing friction torque are obtained according to Eqs. 4, 5 as
In this way, the blade pitch load and bearing friction torque during wind turbine operation can be estimated from the motor pitch torque obtained in Eq. 1, which also facilitates the analysis of the effect of wind speed and blade azimuth on the motor pitch torque, blade pitch load, and bearing friction torque.
3.4 Analysis process of force estimation of pitch system
When estimating and analyzing the forces acting on the pitch system, first of all, it is necessary to clarify the research object and establish the force equilibrium equation of the wind turbine pitch system under various operating conditions. Then, the multidimensional BIN method is applied to estimate the blade pitch load, bearing friction torque, and motor pitch torque at the corresponding moment based on the field SCADA data. Finally, using wind speed and azimuth as influencing factors, the variation of blade pitch load, bearing friction torque, and motor pitch torque in four states, including constant pitch state in the maximum wind energy tracking region, and smooth-pitch, standstill and open-pitch state in the constant power output region, are analyzed. The specific analysis process is shown in Figure 6.
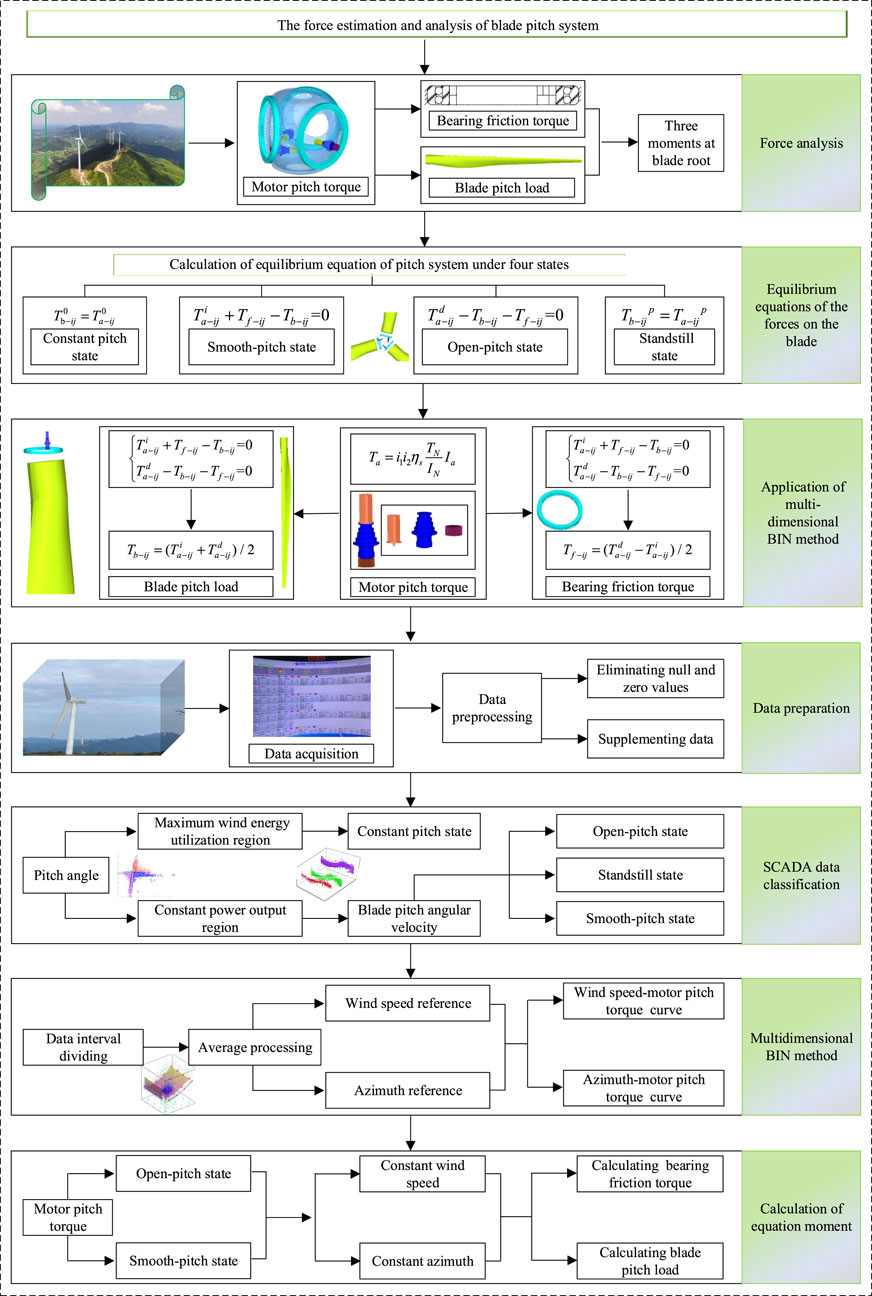
FIGURE 6. Flow chart of force estimation and analysis of pitch system.
4 Force characteristic investigation of the pitch system
4.1 Data observation and parameter setting
An entire year SCADA data of a 2 MW wind turbine are collected to conduct the research. The wind turbine locates at a mountainous wind farm in southern China. The technical performance parameters of the wind turbine and the pitch system are shown in Table 1 (Zhang et al., 2019). The SCADA system stores the operation parameters with an interval of 1 s (sampling frequency is 1 Hz). Table 2 shows the raw SCADA data form of the SCADA system. From the SCADA system, the operating parameters of the wind turbine are extracted for subsequent investigation, such as wind speed, rotor speed, blade azimuth, output power, pitch motor current, pitch motor power, and pitch angle. Considering the symmetry of the wind turbine, only one of the three blades is selected for analysis.
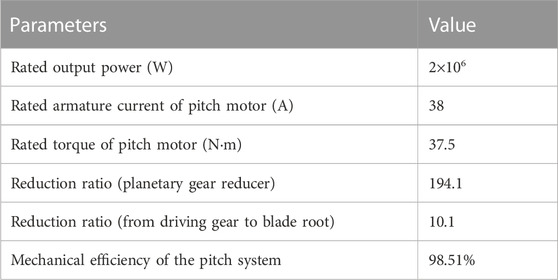
TABLE 1. Main technical parameters of the 2 MW wind turbine.
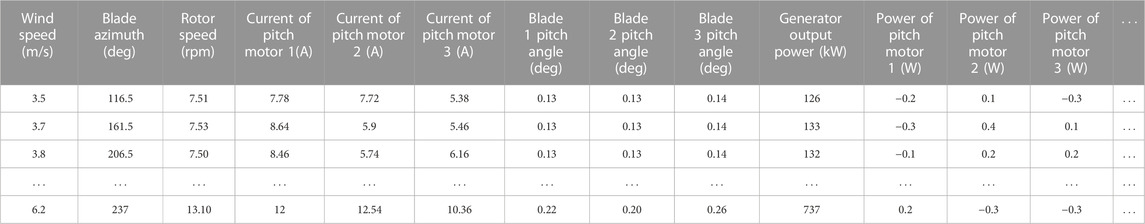
TABLE 2. Raw form of SCADA data.
The pitch angle of the extracted parameters is obtained by the angle sensor installed near the inside of the blade inner gear ring. The pitch angle data are divided into four typical periods to analyze the change with wind speed, as shown in Figure 7. When wind speed is lower than the rated value, the wind turbine operates in the maximum wind energy tracking region, and the blade does not pitch. However, the pitch angle is not zero due to installation, testing, and the pitch system’s dynamic characteristics. As shown in Figures 7A–E, when the wind speed is about
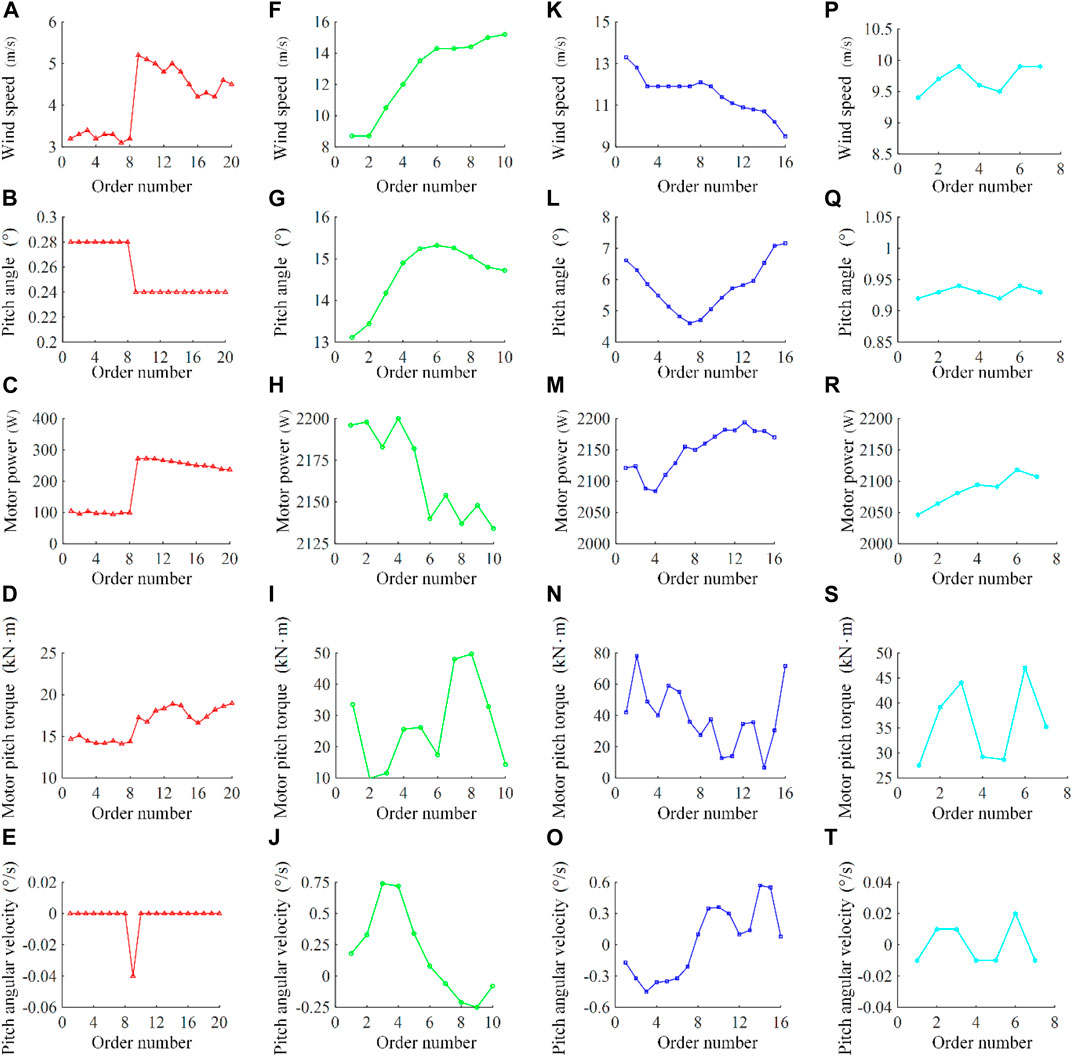
FIGURE 7. Four field data recording periods (A–E) the variation of wind speed, pitch angle, motor power, motor pitch torque and pitch angular velocity during low wind speed stage; (F–J) the variation of wind speed, pitch angle, motor power, motor pitch torque and pitch angular velocity during wind speed increases from low to high; (K–O) the variation of wind speed, pitch angle, motor power, motor pitch torque and pitch angular velocity during wind speed decreases from high to low; (P–T) the variation of wind speed, pitch angle, motor power, motor pitch torque and pitch angular velocity during minor changes in wind speed.
According to a comprehensive observation and analysis of SCADA data, the threshold of pitch angle value is selected as 0.5° (
4.2 Blade pitch load analysis
The combined action of aerodynamic forces generates the blade pitch load, centrifugal forces, and gravity. To conduct the analysis of the influence of wind speed and blade azimuth on the pitch load, the azimuths 0°, 90°, 180°, and 270° are selected to investigate the effect of wind speed, and the wind speed 4 m/s, 7 m/s, 9 m/s and 12 m/s are also selected to examine the impact of the blade azimuth. Then, the pitch load can be obtained for different wind speeds and azimuth angles by applying the proposed force estimation method of the pitch system, as shown in Figure 8.
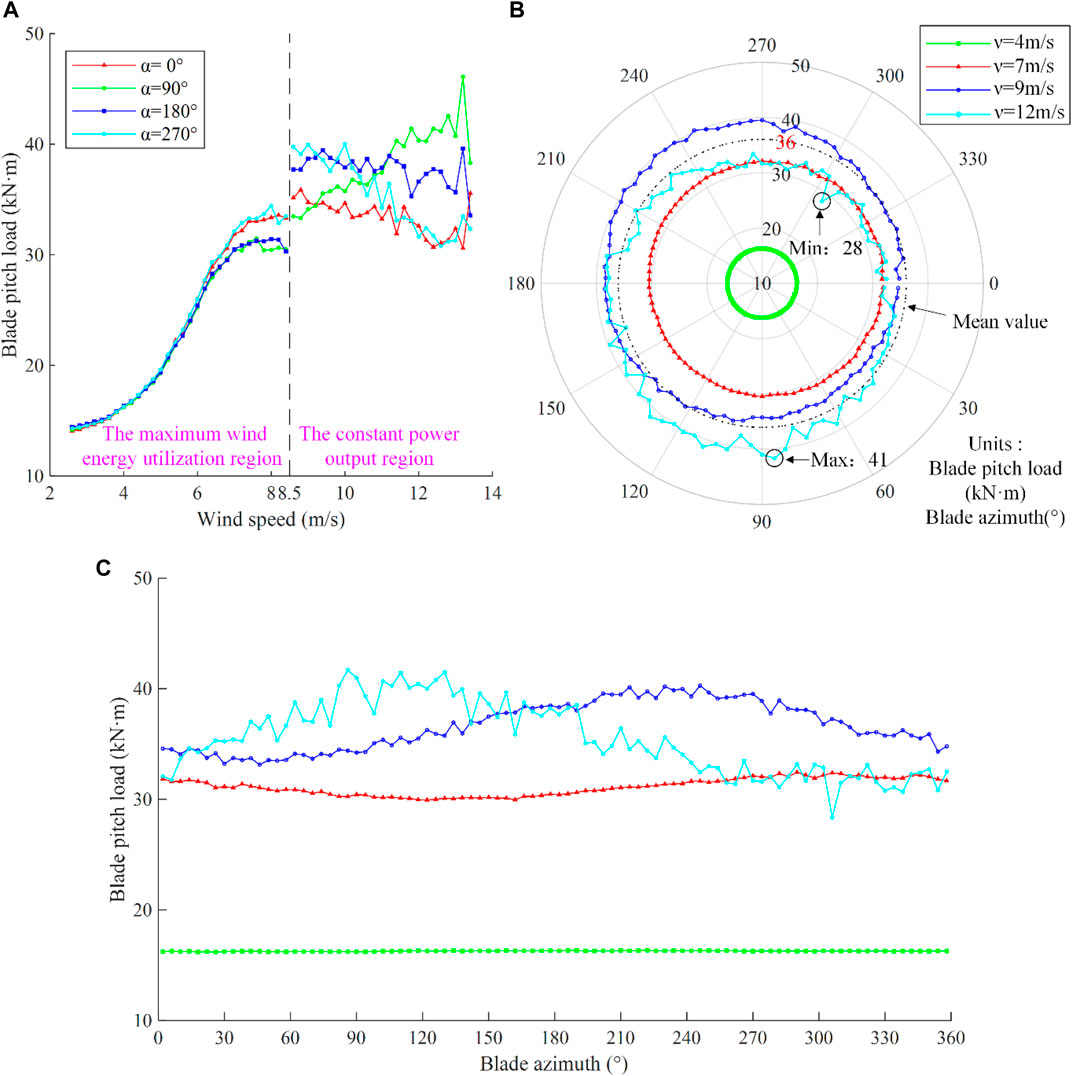
FIGURE 8. Relationship of blade pitch load with wind speed and azimuth angle (A) Influence of wind speed on blade pitch load; (B,C) Influence of azimuth on blade pitch load.
As shown in Figure 8, when the wind speed is relatively low, the blade pitch load first increases slowly with the wind speed and then rapidly increases with the wind speed. When the wind speed reaches about 7 m/s, the blade pitch load increases slowly with the wind speed or no longer increases until the wind speed reaches the rated wind speed. During this period, the wind turbine and its pitch system enter the state-switching phase, and the blade pitch load and wind speed undergo a very complex nonlinear jump change process. When the wind speed exceeds the rated speed, the blade pitch load does not change significantly with the wind speed. There is an interesting phenomenon, the blade pitch load first increases and then remains constant with wind speed. The reasons cause the phenomenon mainly has the following aspects. Firstly, when the wind turbine operates in the maximum wind energy tracking region, the blade does not pitch, the blade windward surface is the largest, and the aerodynamic force acting on the blade increases with wind speed. Meanwhile, the rotational speed of the wind wheel increases with wind speed; aerodynamic and centrifugal forces lead to an increase in blade pitch load. Secondly, when the wind turbine operates in the constant output power region, the rotational speed of the wind wheel is stable at the rated speed. At the same time, the centrifugal force remains unchanged. The blade pitch angle increases with wind speed which results in the decrease of the blade windward surface. Since the aerodynamic force acting on the blade depends on the wind pressure (wind speed) and the windward surface area, the two increase and decrease to cause the blade pitch load to remain unchanged. In general, the blade pitch control is designed to keep the output power constant and the blade pitch load from varying with wind speed.
It also can be seen from Figure 8 that the blade pitch load varies periodically with the blade azimuth., Taking the wind speed of 7 m/s as an example, when the azimuth changes from 0° to 90°, the pitch load decreases with azimuth. The pitch load is almost unchanged when the azimuth changes from 90° to 180°. When the azimuth changes from 180° to 270°, the pitch load increases with azimuth, and when the azimuth changes from 270° to 360° (0°), the pitch load first increases and then decreases. The wind wheel rotates in one circle, and the pitch load changes periodically. The periodicity of blade pitch load change with azimuth angle is closely related to wind speed. When the wind speed is relatively low
4.3 Analysis of bearing friction torque
The bearing friction torque prevents the blade from rotating. When the blades are in the pitch state in the constant output power stage of the wind turbine, and the pitch system is in the state of smooth-pitch or open-pitch, the bearing friction torque can be estimated. The sample data near 0°, 90°, 180°, and 270° are extracted to investigate the relationship between bearing friction torque and wind speed. The sample data near wind speeds 4 m/s, 7 m/s, 9 m/s and
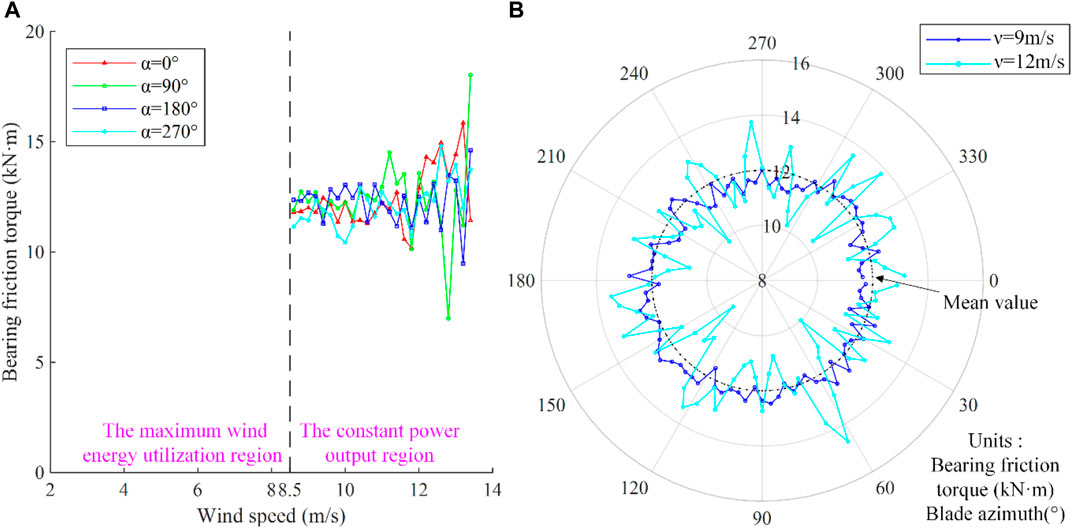
FIGURE 9. The relationship between bearing friction torque and wind speed and azimuth angle (A) Influence of wind speed on bearing friction torque; (B) Influence of azimuth on bearing friction torque.
It can be seen from Figure 9 that when the wind turbine operates in the constant output power region, the bearing friction torque fluctuates around 12
4.4 Analysis of motor pitch torque
The motor pitch torque is the main force driving the blade to rotate or keep the blade stationary. Its magnitude depends on the blade pitch load and bearing friction torque and is also related to the blade rotation direction. The sample data near azimuth of
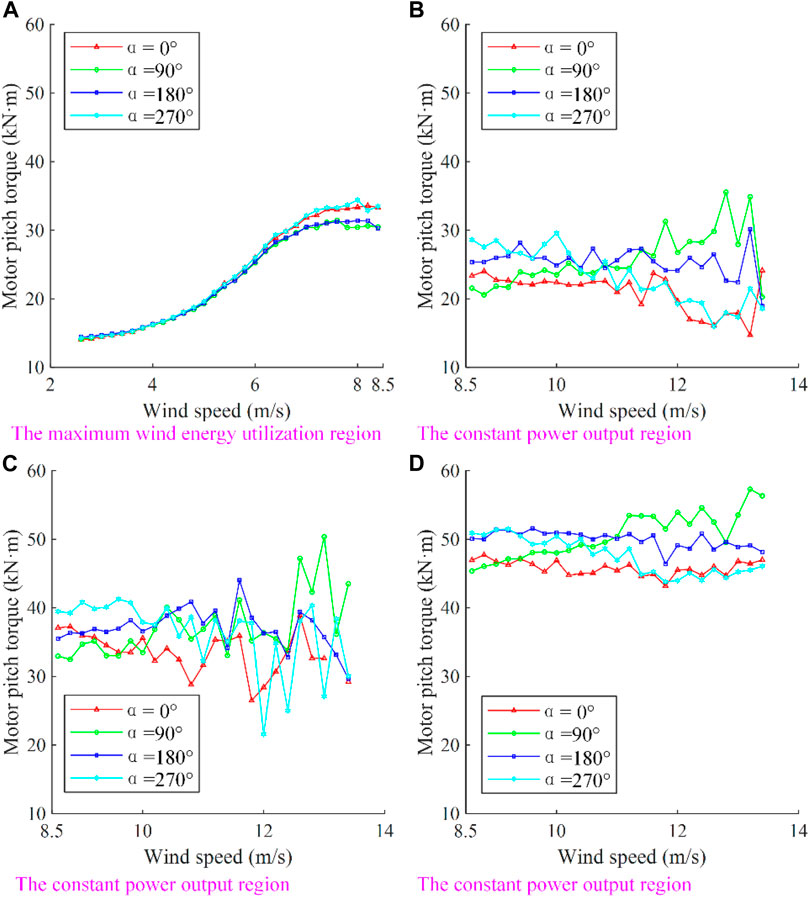
FIGURE 10. Relation between motor pitch torque and wind speed (A) The maximum wind energy utilization region; (B–D) The smooth-pitch state, standstill state, and open-pitch state in the constant power output region of wind turbines.
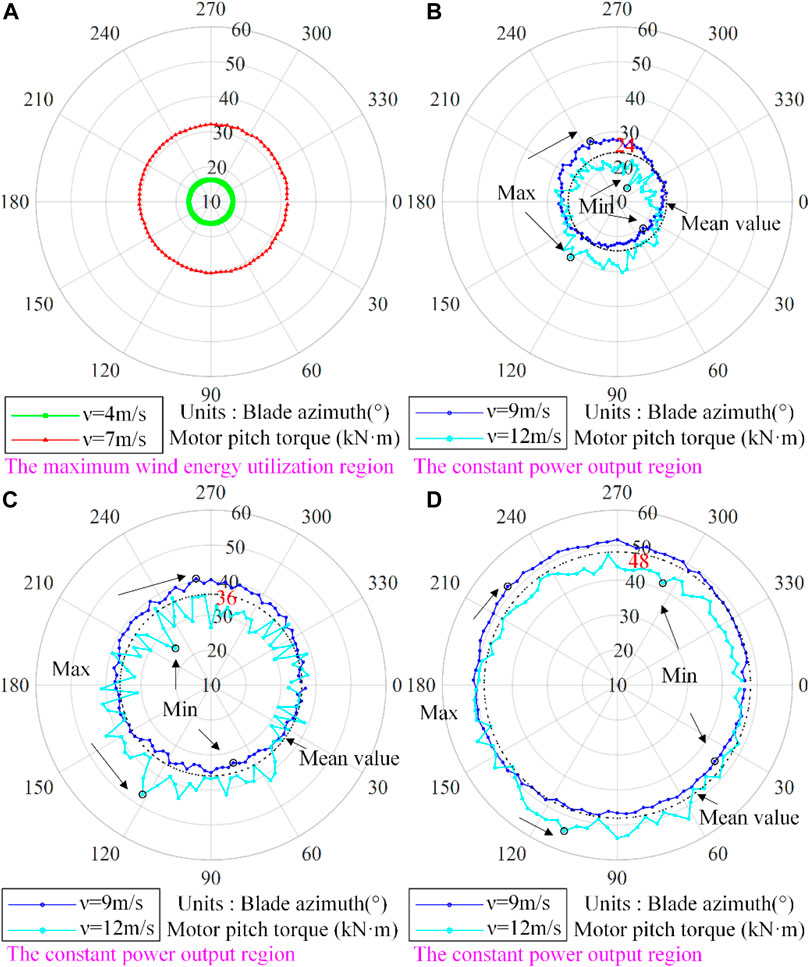
FIGURE 11. Relation between motor pitch torque and azimuth (A) The maximum wind energy utilization region; (B–D) The smooth-pitch state, standstill state, and open-pitch state in the constant power output region of wind turbines.
When wind turbines operate in the maximum wind energy utilization region, according to the force equilibrium equation mentioned above, if the friction torque is ignored, the motor pitch torque is equal to the blade pitch load. They all increase with the increase of wind speed and show periodic changes with the rotation of the wind rotor and the change of azimuth, as shown in Figure 10. Due to the constant pitch angle, the blade forces are relatively stable, and regression fitting can be performed as shown in Figure 12. The mathematical relationship is
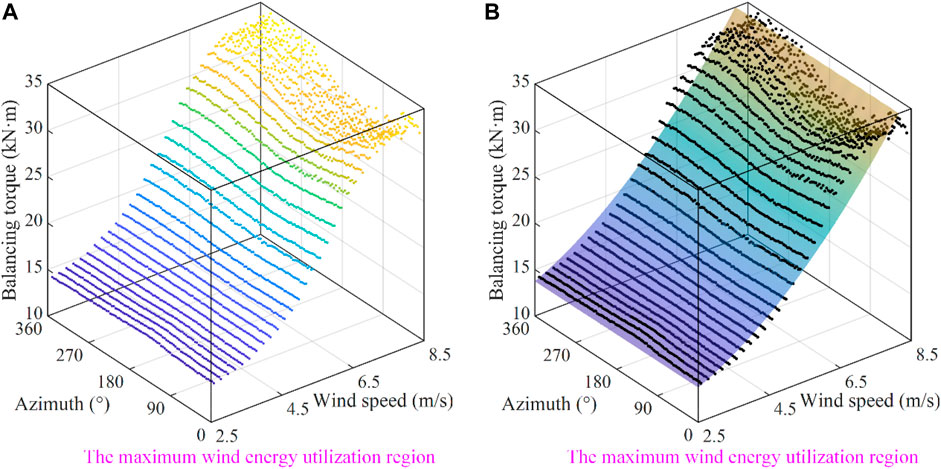
FIGURE 12. Regression fitting model of equilibrium torque in the maximum wind energy tracking region (A) Scatter plot of equilibrium torque; (B) Surface fitting of equilibrium torque.
From the model, if the influence of wind speed is not considered, that is, assuming that the wind speed is 0 and the blade pitch load is 11.53
In summary, for the investigated 2 MW wind turbine, when operating in a constant power output region, the blade pitch load is approximately 36
5 Conclusion
In this paper, the blade pitch principle of a 2 MW direct-drive wind turbine is analyzed. By investigating the force of the pitch system under multiple operating conditions, the force equilibrium equations of the wind turbine blade are established. Based on SCADA data, a method for estimating the blade pitch load, bearing friction moment, and motor pitch torque is proposed by using the multidimensional BIN method. Many interesting phenomena have been observed. When the wind turbine operates in the maximum wind energy tracking region, the blade pitch load and motor pitch torque are proportional to the square of the wind speed and show periodic changes with the wind rotor rotation and azimuth changes. When the wind turbine operates in the constant power output region, the blade pitch load is about 36
Data availability statement
The original contributions presented in the study are included in the article/supplementary material, further inquiries can be directed to the corresponding author.
Author contributions
Conceptualization, JD and DL; data curation, ML and FZ; funding acquisition, JD and FZ; investigation, ML; software, ML and DL; validation, JD and DL; visualization, ML, DL, and JD; writing-original draft, ML; writing-review and editing, JD and DL. All authors contributed to the article and approved the submitted version.
Funding
This work is supported by the National Natural Science Foundation of People’s Republic of China (Grant Nos 52075164 and 52205098) and the science and technology innovation Program of Hunan Province (Grant No. 2021RC4038).
Conflict of interest
The authors declare that the research was conducted in the absence of any commercial or financial relationships that could be construed as a potential conflict of interest.
Publisher’s note
All claims expressed in this article are solely those of the authors and do not necessarily represent those of their affiliated organizations, or those of the publisher, the editors and the reviewers. Any product that may be evaluated in this article, or claim that may be made by its manufacturer, is not guaranteed or endorsed by the publisher.
References
Abdelbaky, M. A., Liu, X., and Jiang, D. (2020). Design and implementation of partial offline fuzzy model-predictive pitch controller for large-scale wind-turbines. Renew. Energy 145, 981–996. doi:10.1016/j.renene.2019.05.074
Astolfi, D. (2021). Wind turbine operation curves modelling techniques. Electronics 10 (3), 269. doi:10.3390/electronics10030269
Bhargava, V., Kasuba, S., Maddula, S. P., Jagadish, D., Khan, M. A., Padhy, C. P., et al. (2020). A case study of wind turbine loads and performance using steady-state analysis of BEM. Int. J. Sustain. Energy 40 (1), 22–40. doi:10.1080/14786451.2020.1787411
Bi, R., Qian, K., Zhou, C., Hepburn, D. M., and Rong, J. (2014). A survey of failures in wind turbine generator systems with focus on a wind farm in China. Int. J. Smart Grid Clean Energy 3, 373. doi:10.12720/sgce.3.4.366-373
Chen, B., Matthews, P. C., and Tavner, P. J. (2013). Wind turbine pitch faults prognosis using a-priori knowledge-based ANFIS. Expert Syst. Appl. 40 (17), 6863–6876. doi:10.1016/j.eswa.2013.06.018
Cheon, J., Kim, J., Lee, J., Lee, K., and Choi, Y. (2019). Development of hardware-in-the-loop-simulation testbed for pitch control system performance test. Energies 12 (10), 2031. doi:10.3390/en12102031
Correa-Jullian, C., Cofre-Martel, S., San Martin, G., Lopez Droguett, E., de Novaes Pires Leite, G., and Costa, A. (2022). Exploring quantum machine learning and feature reduction techniques for wind turbine pitch fault detection. Energies 15 (8), 2792. doi:10.3390/en15082792
Dai, J., Hu, Y., Liu, D., and Long, X. (2010). Calculation and characteristics analysis of blade pitch loads for large scale wind turbines. Sci. China Technol. Sci. 53 (5), 1356–1363. doi:10.1007/s11431-010-0058-8
Dai, J., Li, M., Chen, H., He, T., and Zhang, F. (2022). Progress and challenges on blade load research of large-scale wind turbines. Renew. Energy 196, 482–496. doi:10.1016/j.renene.2022.07.017
Dai, J. C., Hu, Y. P., Liu, D. S., and Long, X. (2011). Aerodynamic loads calculation and analysis for large scale wind turbine based on combining BEM modified theory with dynamic stall model. Renew. Energy 36 (3), 1095–1104. doi:10.1016/j.renene.2010.08.024
Hameed, Z., Hong, Y. S., Cho, Y. M., Ahn, S. H., and Song, C. K. (2009). Condition monitoring and fault detection of wind turbines and related algorithms: A review. Renew. Sustain. Energy Rev. 13 (1), 1–39. doi:10.1016/j.rser.2007.05.008
He, L., Hao, L., and Qiao, W. (2021). Remote monitoring and diagnostics of pitch-bearing defects in an MW-scale wind turbine using pitch symmetrical-component analysis. IEEE Trans. Industry Appl. 57 (4), 3252–3261. doi:10.1109/tia.2021.3079221
Jiao, X., Meng, W., Yang, Q., Fu, L., and Chen, Q. (2018). Adaptive continuous neural pitch angle control for variable-speed wind turbines. Asian J. Control 21 (4), 1966–1979. doi:10.1002/asjc.1963
Korkos, P., Linjama, M., Kleemola, J., and Lehtovaara, A. (2022). Data annotation and feature extraction in fault detection in a wind turbine hydraulic pitch system. Renew. Energy 185, 692–703. doi:10.1016/j.renene.2021.12.047
Li, J., and Wang, S. (2021). Dual multivariable model-free adaptive individual pitch control for load reduction in wind turbines with actuator faults. Renew. Energy 174, 293–304. doi:10.1016/j.renene.2021.04.080
Liu, D., Zhang, F., Dai, J., Xiao, X., and Wen, Z. (2021). Study of the pitch behaviour of large-scale wind turbines based on statistic evaluation. IET Renew. Power Gener. 15 (11), 2315–2324. doi:10.1049/rpg2.12166
Liu, H., Liu, H., Zhu, C., Sun, Z., and Bai, H. (2019). Study on contact fatigue of a wind turbine gear pair considering surface roughness. Friction 8 (3), 553–567. doi:10.1007/s40544-019-0277-3
McKinnon, C., Carroll, J., McDonald, A., Koukoura, S., and Plumley, C. (2021). Investigation of isolation forest for wind turbine pitch system condition monitoring using SCADA data. Energies 14 (20), 6601. doi:10.3390/en14206601
Neshat, M., Nezhad, M. M., Abbasnejad, E., Mirjalili, S., Groppi, D., Heydari, A., et al. (2021). Wind turbine power output prediction using a new hybrid neuro-evolutionary method. Energy 229, 120617. doi:10.1016/j.energy.2021.120617
Rosemeier, M., Berring, P., and Branner, K. (2016). Non-linear ultimate strength and stability limit state analysis of a wind turbine blade. Wind Energy 19 (5), 825–846. doi:10.1002/we.1868
Wang, C-S., and Chiang, M-H. (2016). A novel pitch control system of a large wind turbine using two-degree-of-freedom motion control with feedback linearization control. Energies 9 (10), 791. doi:10.3390/en9100791
Wang, W., Liu, H., Zhu, C., Tang, J., and Jiang, C. (2019). Evaluation of contact fatigue risk of a carburized gear considering gradients of mechanical properties. Friction 8 (6), 1039–1050. doi:10.1007/s40544-019-0317-z
Wei, L., Qian, Z., and Zareipour, H. (2020). Wind turbine pitch system condition monitoring and fault detection based on optimized relevance vector machine regression. IEEE Trans. Sustain. Energy 11 (4), 2326–2336. doi:10.1109/tste.2019.2954834
Wei, L., Qian, Z., Zareipour, H., and Zhang, F. (2021). Comprehensive aging assessment of pitch systems combining SCADA and failure data. IET Renew. Power Gener. 16 (1), 198–210. doi:10.1049/rpg2.12281
Xu, B., Yuan, Y., Liu, H., Jiang, P., Gao, Z., Shen, X., et al. (2020). A pitch angle controller based on novel fuzzy-PI control for wind turbine load reduction. Energies 13 (22), 6086. doi:10.3390/en13226086
Yin, X., Fan, Y., Qin, Y., Jiang, H., Jiang, H., and Ye, X. (2022). fault detection of wind turbine pitch motors based on ensemble learning approach. J. Phys. Conf. Ser. 2401 (1), 012086. doi:10.1088/1742-6596/2401/1/012086
Yuan, Y., Chen, X., and Tang, J. (2020). Multivariable robust blade pitch control design to reject periodic loads on wind turbines. Renew. Energy 146, 329–341. doi:10.1016/j.renene.2019.06.136
Zeng, H., Dai, J., Zuo, C., Chen, H., Li, M., and Zhang, F. (2022). Correlation investigation of wind turbine multiple operating parameters based on SCADA data. Energies 15 (14), 5280. doi:10.3390/en15145280
Keywords: wind turbines, pitch system, equilibrium equation, SCADA data, force
Citation: Li M, Dai J, Zhang F and Liu D (2023) Research on force model and characteristics of large wind turbine pitch system based on SCADA data. Front. Energy Res. 11:1203158. doi: 10.3389/fenrg.2023.1203158
Received: 10 April 2023; Accepted: 30 May 2023;
Published: 13 June 2023.
Edited by:
Paolo Schito, Polytechnic University of Milan, ItalyCopyright © 2023 Li, Dai, Zhang and Liu. This is an open-access article distributed under the terms of the Creative Commons Attribution License (CC BY). The use, distribution or reproduction in other forums is permitted, provided the original author(s) and the copyright owner(s) are credited and that the original publication in this journal is cited, in accordance with accepted academic practice. No use, distribution or reproduction is permitted which does not comply with these terms.
*Correspondence: Juchuan Dai, ZGFpanVjaHVhbkBobnVzdC5lZHUuY24=