 Yingrui Wang
 Shengjie Huang2*
- 1Nanjing Vocational Institute of Railway Technology, Institute of Architecture and Art Design, Nanjing, China
- 2Nari Technology Co., Ltd., Nanjing Electric Control Branch, Nanjing, China
Introduction: In the wave of urbanization, the increase of public lighting equipment in buildings has brought about more prominent problems of energy saving and consumption reduction.
Methods: In order to solve the above problems, this paper designs a set of intelligent lighting solutions for digital buildings by combining the smart grid and non-dominant sorting genetic algorithms. Firstly, an intelligent lighting monitoring solution is constructed through ZigBee ad hoc network and sensor technology to monitor the relevant environment and lighting control of the laboratory building. Secondly, this paper uses the DIALux software network to build a public lighting light distributiona public lighting light distribution model in the building, and deeply studies the dimming control strategy of the system under the principle of making full use of sunlight and natural light.
Results: The purpose ofself-adaptive intelligent control of desktop illuminance, finally using this scheme to achieve the optimal balance of desktop lighting.
Discussion: The simulation experiment counts the power data of the intelligent lighting system under different weather conditions. The experimental results verify that the intelligent lighting control scheme can effectively reduce the output luminous flux of the lamps, thereby reducing power consumption.
1 Introduction
Building a resource-saving and environment-friendly society is an inevitable requirement for maintaining sustained and healthy economic development and promoting social harmony and stability (Özçelik, 2018). With the anti-war of science and technology and the gradual improvement of human living standards (Zhang et al., 2021), the people’s requirements for modern intelligent buildings, smart homes, and intelligent lighting are not only limited to ordinary lighting needs, but also need modern intelligent lighting systems to meet the different comfort and energy-saving requirements of different groups of people. Improving the efficiency and use time of electric light sources and developing energy-efficient lamps are the main methods of energy-saving technology in early lighting (Ning et al., 2023). Lee et al. first proposed to control shutters and lights to reduce energyconsumption (Cai et al., 2022), and then many scholars conducted a lot of research on the blade angle control method of shutters He and Ye (2022), such as pure fuzzy control methods (Zhang et al., 2023), genetic algorithms (Long et al., 2023) and BP neural networks Zhong et al. (2023). David et al. used the light sensor calibration prior information to control daylight adaptive lighting, in order to reasonably introduce natural light to achieve energy saving, and corresponding scholars have also studied natural lighting. They also started from the intelligent control method of shutters, and adopted fuzzy neural networks (Fei and Yang, 2023), adaptive fuzzy control (Chen et al., 2022) and other methods. Xiao Hui of Tongji University and others combined artificial lighting and natural lighting, proposed a joint control model, and formulated a joint control strategy. In addition, starting from the principle of illuminance, reduce the indoor light reduction coefficient, improve the illuminance of the working area, and also improve the light distribution effect to achieve the purpose of energy saving. With the improvement of people’s light distribution design level in light environment, the benefits of energy saving will become higher and higher. Alice et al. used wireless integrated dimming ballast technology to develop wireless command reception from the central control server and convert it into ballast control signal for lighting adjustment, realizing the personalized dynamic design of energy-saving network lighting in open office (Antoine et al., 2021).
In the adaptive energy-saving control of architectural lighting, the smart grid can provide more energy information and management capabilities, making the lighting system more intelligent and efficient. For example, real-time monitoring and control of lighting equipment can be achieved through smart grids to adjust according to energy prices and load demand. Non-dominated sorting genetic algorithms can optimize multiple objective functions of lighting equipment, such as the balance between energy saving and comfort. Using this algorithm, a set of optimal solutions can be found that do not have a dominance relationship, resulting in more efficient lighting control.
In this paper, we will mainly use smart grid based and non-dominated ranking genetic algorithm, which has developed from the original univariate theory to multivariate theory, from continuous-time system to discrete-time system, and has been applied in many fields (Rehman et al., 2023). And we combine it with the smart grid to apply it to the control of lighting energy efficiency, we can design a new cognitive lighting control system, that is, a type of PID controller for stable setting of the appropriate illumination, while using a genetically optimized controller to minimize power consumption. We also compared our model with other models, and the results show that our model performs better than other models and can effectively control energy savings.
The contribution points of this paper are as follows.
• Compared with pure fuzzy control methods, and genetic algorithms, this paper uses the smart grid as the basis for a higher degree of automation. Good flexibility can effectively improve energy utilization efficiency and economic benefits;
• Compared with the BP neural network model, our model has a simpler structure, less computation, and can provide adaptive solutions faster. It adopts a modular design, convenient for flexible combination and expansion, and can be customized according to different needs. The application needs in various complex environments;
• Compared with adopted fuzzy neural networks, and adaptive fuzzy control methods, our method can effectively solve complex optimization problems with multiple objective functions; by effectively preserving the diversity and convergence speed in the population, we can obtain a The optimal solution of the group is more applicable to the problem.
In the rest of this paper, we present recent related work in Section 2. Section 3 offers our proposed methods: overview, convolutional neural networks; long and short-term memory networks; transfer learning. Section 4 presents the experimental part, details, and comparative experiments. Section 5 concludes.
2 Related work
2.1 BP neural networks
BP neural network is a widely used feed-forward artificial neural network known as multilayer perceptron (Multilayer Perceptron, MLP). The BP neural network implements tasks such as pattern recognition, classification, and regression by passing input data from the input layer to the hidden layer and output layer and then adjusting the weight and bias of each layer according to the error signal (Han et al., 2021).
BP neural network usually has three or more layers: an input layer, a hidden layer (there may be more than one) and an output layer. Each neuron is connected to other neurons in the upper and lower adjacent layers, and the corresponding weight value determines the connection strength between them. The input data enters from the input layer and passes through the nonlinear transformation of the hidden layer to the output layer to calculate the final result. The BP neural network training usually uses a backpropagation algorithm (Backpropagation, BP). The algorithm uses the gradient descent method to minimize the error function (usually the mean square error function). It updates the weights of all connections by calculating the error between the output layer and the target value to reduce the error. This process iterates until the error reaches a preset threshold or other stopping conditions are met (Wu et al., 2022).
BP neural network has the following advantages: It has a strong nonlinear fitting ability and can handle complex pattern recognition problems; It has good generalization ability and can accurately predict unknown data; It can further improve the network performance by increasing the number of hidden layers. Flexibility and performance (Niu et al., 2022). However, the BP neural network also has the following disadvantages: the training process requires a large amount of data and calculations, and it is easy to fall into a local minimum; for different types of data, different preprocessing and feature selection processes are required; the number of hidden layers, the number of neurons, etc. The parameters need to be adjusted manually, affecting the network’s learning efficiency and performance (Li et al., 2023).
2.2 The fuzzy logic model
The fuzzy logic model is an artificial intelligence model based on fuzzy set theory and fuzzy reasoning method, mainly used to deal with complex, uncertain information and fuzzy information. Compared with the traditional binary logic model, the fuzzy logic model can better deal with fuzzy, uncertain and contradictory problems in real life (Ge et al., 2019).
2.2.1 Fuzzy logic models typically include the following components
Fuzzy set: A fuzzy concept that describes a variable or object, which can be a real number interval, a function, or a formalized mathematical structure; Fuzzy relationship:used to describe the relationship between two or more fuzzy sets, such as fuzzy equality, fuzzy inclusion, fuzzy intersection, fuzzy union, etc.; Fuzzy rule: The law used to map fuzzy input to fuzzy output, usually expressed as a statement in the form of ”IF-THEN”, where the IF part represents the condition of the input variable, and the THEN part represents the value of the output variable; Fuzzy reasoning: Carry out fuzzy reasoning on the input according to the fuzzy rules and obtain the corresponding output results, usually using fuzzy logic operators (such as fuzzy AND, fuzzy OR, fuzzy NOT, etc.) for calculation (Yang et al., 2023).
In practical applications, fuzzy logic models can be used for decision-making and control problems in various fields, such as intelligent transportation, industrial control, financial forecasting, medical diagnosis, etc. Its main advantage is that it can deal with fuzzy and uncertain information and has good adaptability and flexibility; the disadvantage is that it needs to model the input variables and output results mathematically, and the model structure is complex and difficult to explain and understand Cheng et al. (2023).
2.3 SVM model
Support Vector Machine (SVM) is a supervised learning algorithm widely used in classification, regression and anomaly detection, which divides data into different categories by finding the optimal hyperplane. The basic idea of SVM is to map low-dimensional input data to high-dimensional space so that the data can be more easily divided linearly or nonlinearly (Wei et al., 2022).
The core of SVM is to select the appropriate kernel function, commonly used kernel functions include linear kernel, polynomial kernel, radial basis kernel (RBF) and so on. For linearly separable datasets, SVM uses a linear kernel function; for nonlinearly separable datasets, SVM uses a nonlinear kernel function to map the original data space to a high-dimensional space for segmentation. During training, SVM tries to find an optimal hyperplane to split the data. This hyperplane has the largest margin and the furthest distance from the support vectors. Support vectors refer to some points closest to the hyperplane, which determine the position and direction of the hyperplane. Since SVM focuses on the points closest to the hyperplane, it is less susceptible to noise. The advantages of SVM include: its the number of support vectors is small, the memory usage is small, and it suitable for high-dimensional data Zhu et al. (2020); It can handle nonlinear data sets and adapt to various complex problems flexibly through the selection of kernel functions; it has strong generalization ability and good prediction performance for new data. The disadvantages of SVM include: for large-scale data sets, the training time is long, and the calculation complexity is high; selecting an appropriate kernel function and performing parameter tuning is necessary, and it is not easy to deal with the noise brought by the input data (Nazari et al., 2020).
In conclusion, SVM is a powerful, flexible, supervised learning algorithm with wide application.
3 Intelligent lighting monitoring solution based on smart grid
3.1 Indoor light distribution model
The system adopts a 3-layer network structure, in which the perception layer uses low-power ZigBee ad hoc network and sensor technology to achieve state data acquisition. The transport layer forms an ARM-5G gateway through ARM embedded technology and 5G mobile communication technology to realize the remote transmission of sensing and control data (Xiang et al., 2019). The application-layer client monitors the experimental building-related environment and lighting control through the PC or mobile phone. In order to achieve the purpose of environmental monitoring and lighting control, the system should have the capabilities of data acquisition, data transmission, storage management and analysis decision-making (Song et al., 2020). Thus, the system designs the overall scheme of intelligent experimental building environment monitoring system, as shown in Figure 1. As can be seen from the figure, the system adopts three levels of network structure, which are the perception layer, the transport layer and the application layer. Schematic diagram of intelligent lighting monitoring scheme based on smart grid is shown in Figure 1.
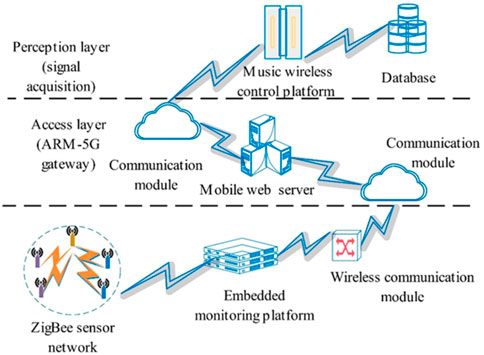
FIGURE 1. Schematic diagram of intelligent lighting monitoring scheme based on smart grid.
Among them, the perception layer consists of a ZigBee network, various sensor modules, alarm modules and relay modules to build a wireless sensor network. This layer mainly solves the problem of interconnec-tion of the underlying wireless sensor network, which is responsible for collecting data on ambient tempera-ture, humidity, and smoke concentration and monitoring lighting facilities Song et al. (2021). Among them, the sensor module and the ZigBee module form an endpoint node, ZigBee routes and forwards data, and the coordina-tor collects and manages data, and sends the data to the ARM-5G gateway at the transport layer (Yang et al., 2023).
4 Smart lighting overall control strategy
This topic discusses the intelligent control of indoor lighting, so we need to consider the direct illumination of the lighting source and the reflected illuminance generated by the mutual reflection between the various surfaces, so as to obtain the closest calculation results. Suppose there are two diffuse surfaces with an area of a1 and a2 with average luminous intensities of L1 and L2, respectively. According to the corresponding photometric calculation method in electrical lighting technology, the Lambert’s cosine law and the inverse theorem of luminous flux transfer are followed when diffuse reflection surfaces are followed. Based on the illumination flux transfer function matrix, that is, the illuminance of each point in the room is calculated when the direct illumination of each light source and the mutual reflection illuminance of each surface in the room are considered at the same time. Luminous flux transfer schematic is shown in Figure 2.
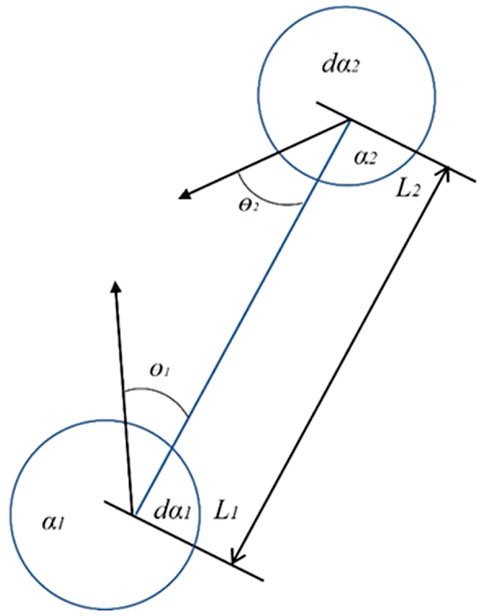
FIGURE 2. Luminous flux transfer schematic.
Assuming that there are two points a and b in the room, it can be seen from the linear correlation between the illuminance of the indoor point and the luminous flux of each light source, and the illuminance of point a and point b are respectively:
The ratio of illuminance is:
Since the luminous flux matrix of two points a and b is fixed, the ratio of the illuminance value of any two points in the room depends on the luminous flux value output by each light source in the determined multi-light source indoor environment. In a spatial environment such as a room, when multiple light sources are known (Tran et al., 2021), the proportional relationship between the specific values of the illumination degree of any two locations in the room is related to the energy value of the light output by each light source. Therefore, when the illuminance of a point in the room (sensor detection point) is known, we can find the illuminance value of each point in the room through the luminous flux transfer function matrix.
In the design process of this project, it is necessary to place a illuminance sensor at a certain point in the room to collect light data. The selection of sensor position is related to the complexity of the intelligent control algorithm, and the better the position selection, the simpler the algorithm. In this paper, DIALux lighting design software is used to calculate and measure laboratory lighting data, which we will use to determine the optimal position of the indoor illuminance sensor and the luminous flux transfer function matrix of the indoor working surface and sensor points.
4.1 Intelligent light distribution control based on genetic algorithm
In the process of intelligent lighting control design, the luminous flux output of each light source determines the illuminance of each desktop surface, which is a one-way irreversible process. In the previous article, the luminous flux transfer function matrix model was mentioned, and here we use it to determine the effect of natural light on the illuminance of the desktop surface in the room, so as to obtain the illuminance of outdoor natural light projected onto each desktop in the room, and then compare this illumination with the given standard illuminance to determine the surface illumination required by each desktop from artificial lighting fixtures (Soheilian et al., 2021). Although the luminous flux output by each light source is a fixed value, it is not easy to determine it. Therefore, in the research process of this topic, the genetic algorithm of no dominated ranking (NSGA) was used to study the desktop equilibrium illumination optimization distribution model Tavares et al. (2021).
The main difference between NSGA and simple genetic algorithms is that the algorithm is layered according to the dominance relationship between individuals before the selection operator is executed. The following is added: Non-Dominated Sorting Genetic Algorithm (NSGA) is a multi-objective optimization algorithm for finding the Pareto optimal solution set among multiple objective functions. The core idea of NSGA algorithm is to stratify each individual in the population according to the number of times other individuals dominate it The core idea of NSGA algorithm is to stratify each individual in the population according to the number of times it is dominated by other individuals, i.e., to rank the individuals in the population non-dominantly. By grouping individuals and calculating the crowding degree of individuals in each group, the NSGA algorithm can converge the solution set to the Pareto optimal solution set while maintaining the diversity of solution sets.
The optimization process of the NSGA algorithm can be divided into the following steps:
1. Initialize the population: Randomly generate the initial population of individuals.
2. Calculate fitness: Calculate the fitness value of each individual under each objective function.
3. Non-dominance ranking: Each individual in the population is stratified according to the number of times other individuals, i.e., dominate it, non-dominance ranking is performed.
4. Calculate crowding degree: For each individual in the hierarchy, calculate its crowding degree under a specific objective function.
5. Selection operation: Selecting the next-generation of individuals. When selecting the next-generation of individuals, the individuals with higher non-dominance levels and higher crowding degrees are preferred.
6. Crossover and mutation operations: Crossover and mutation operations are performed on the selected individuals to generate the next-generation of individuals.
7. Repeat steps 2-6 until the stopping condition (e.g., the maximum number of iterations or the Pareto optimal solution set is found).
In adaptive energy-saving control of building lighting, the NSGA algorithm can optimize multiple objective functions, such as illuminance, colour temperature, and colour reproduction, to obtain the best lighting solution. With the NSGA algorithm, energy consumption can be minimized while maintaining lighting quality within acceptable limits. In practical applications, NSGA algorithms can be used with sensor networks and intelligent control systems to achieve adaptive lighting control.
To optimize the NSGA algorithm to save energy, the following measures can be taken:
1. Optimize parameter settings: Select appropriate genetic algorithms parameters, such as population size, crossover and variation probability, to improve the convergence speed and efficiency of the algorithm.
2. Improving the selection strategy: choosing suitable selection strategies, such as tournament selection, roulette wheel selection, etc., to improve the selection efficiency of the algorithm.
3. Variable constraints for multi-objective optimization problems: Set appropriate variable constraints for multi-objective optimization problems to improve the stability and reliability of the algorithm and avoid unreasonable solutions.
4. Improvement of crossover and variational operations: Improve the crossover and variational operations to improve the convergence speed and efficiency of the algorithm.
NSGA algorithm can find the multi-objective optimization algorithm of the Pareto optimal solution set among multiple objective functions. In adaptive energy-saving control of building lighting, the NSGA algorithm can optimize multiple objective functions to obtain the best lighting solution and further improve the algorithm efficiency and energy saving by optimizing algorithm parameters, selection strategies, variable constraints and crossover and variation operations.
The sharing mode can be divided into fitness sharing in the coding space, fitness sharing in the decision variable space, and fitness sharing in the objective function space. First, a parent population is randomly initialized, and all individuals are sorted by monodominance and a fitness value can be specified, which can be specified that the fitness value is equal to its monodominant order, then 1 is the best fitness value. Then, selective, cross, and mutation operators are used to produce the next-generation of population, with a size of N. Schematic diagram of the NSGA-II algorithm flow is shown in Figure 3.
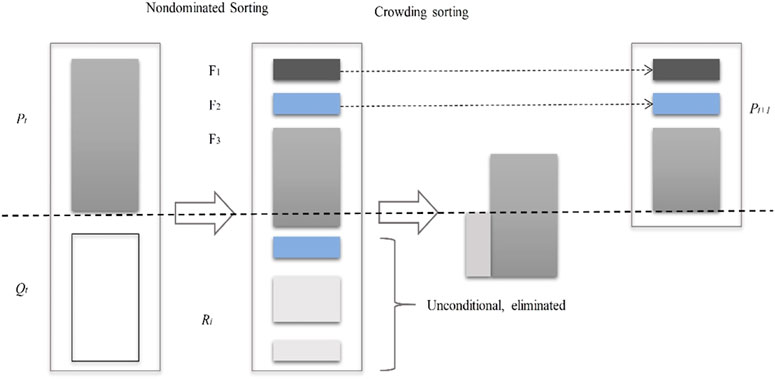
FIGURE 3. Schematic diagram of the NSGA-II algorithm flow.
As shown in Figure 3, the new population generated by the t generation is first merged with the parent generation to form, and the population size is 2N. Then a no dominated sort is performed, resulting in a series of disdominated sets and calculating crowding. New offspring populations are then generated by genetic operators (selection, crossover, mutation). When the number of individuals in the disdominated set produced by the sorting is sufficient to fill, it is not necessary to continue sorting the remaining parts. The diversity of no dominated solutions is guaranteed by crowding comparison operators and does not require additional shared parameters. By hierarchical storage of all individuals in the current solution and population, the best individuals are not lost.
In the original NSGA, we used a sharing function to ensure the diversity of the population, but this required the decision maker to specify the value of the shared radius. To solve this problem, we propose the concept of crowding: the density of surrounding individuals at a given point in the population, which indicates the smallest rectangle around individual i that contains individual i itself but no other individuals, as shown in Figure 4.
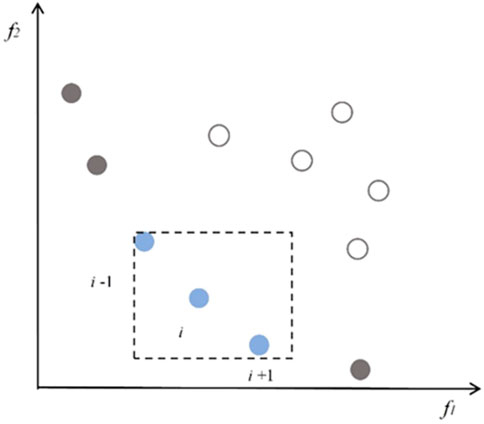
FIGURE 4. Crowding of individual i.
From Figure 4, we can see that a small value indicates that the surrounding area of the individual is crowded. In order to maintain population diversity, we need a relatively crowded operator to ensure that the algorithm converges to a uniformly distributed Pareto surface.
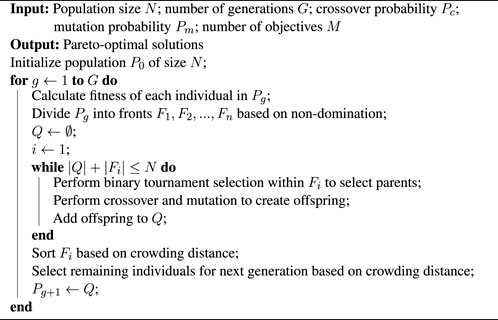
As shown in the Algorithm 1 is the flow chart of the Non-dominated sorting genetic algorithm.
Algorithm 1. Non-dominated Sorting Genetic Algorithm.
5 Experiment
5.1 Datasets
The experimental environment has four windows facing south, and a window facing west, the building dimensions in the room are 12 m, 5 m and 3 m in length, width and height, the reflection ratio of the ceiling, wall and ground is 0.6, 0.4, 0.2, respectively, a total of 8 sets of dimmable fluorescent lamps are installed in the room, each set is two 18W fluorescent lamps and an LED lamp installed in the middle of the two fluorescent lamps. The paper is simulated based on software designed by DIALux, replacing the intensity of the outdoor sensor based on changes in the light intensity of the table outside the window. If we assume that there are two planes in the room that can be diffuse reflection, 01 (placed in the plane of the external sensor) and A2 (placed in the plane of the sensor inside the room), then the general energy of the illumination of 01 irradiating Q2 and the brightness of 01 are directly proportional and have a certain relationship with the inclination angle. At the same time, because the light flux of the sensor position placed indoors and the light degree of the sensor placed outdoors are in a linear proportional relationship, plus the irradiation range is known, the light intensity between the two is also linear to a certain extent. Based on the above theory, this paper is based on the software designed by DIALux to simulate the natural lighting situation that occurs at every moment of life (and the light energy emitted by the lamp does not count), and calculate the corresponding indoor sensor illuminance and outdoor sensor approximate illumination at each time point, and obtain data from 6 a.m. to 6 p.m., as shown in Table 1.
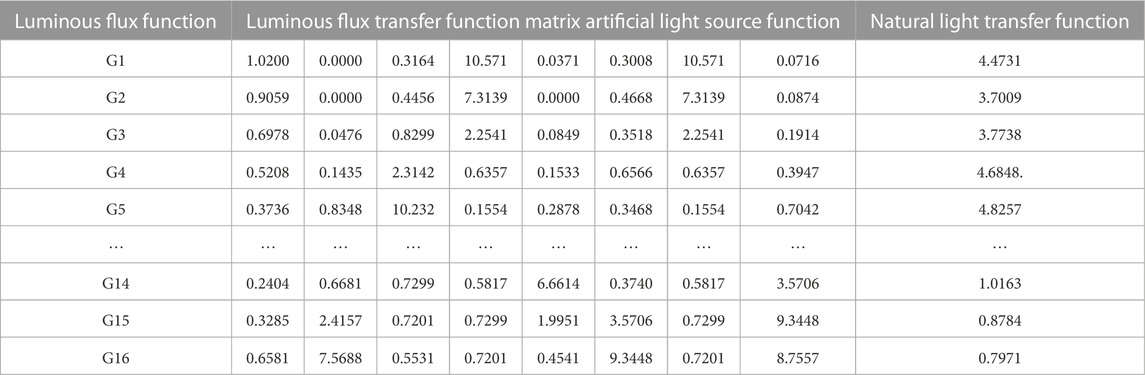
TABLE 1. Working surface luminous flux transfer function matrix.
In this project, sunny and cloudy weather were selected for experiments, and relevant weather data were obtained, and then this data was brought into the above moderate function formula for calculation, and the power change of each lamp and the illuminance change of each desktop surface were measured. By bringing the collected data into the matrix moderation function formula mentioned above, the influence of natural light on the illumination can be obtained. Finally, through the distribution model of illumination and the distribution model of the neural network to calculate the lighting data of these two different weathers, the consumption of room lamps will be obtained by comparing the two sets of data, and the power of the lamps at this time and the illuminance of the artificial light source on the desktop can be further calculated, and the total illumination of the desktop can be obtained by adding the two. Figure 5 shows lighting in cloudy conditions and Figure 6 shows lighting on sunny days. As can be seen from the figure, the illuminance of the room varies greatly in these two weathers.
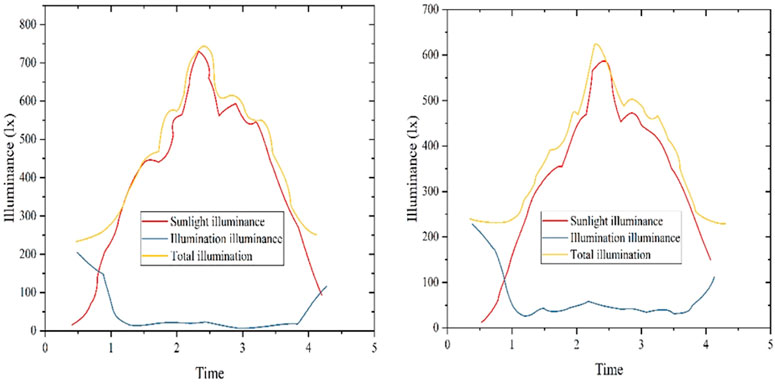
FIGURE 5. Daylight illuminance variation chart in cloudy weather.
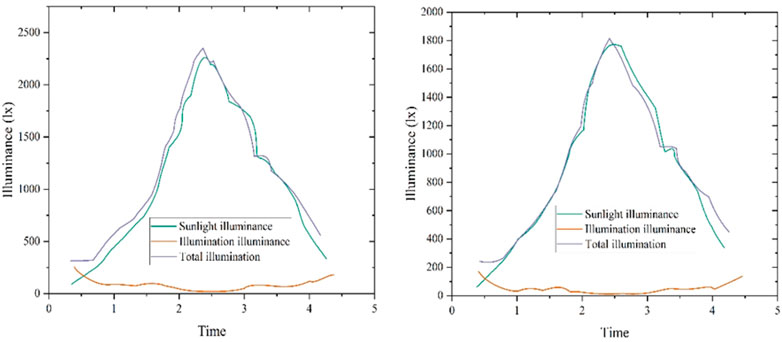
FIGURE 6. Illuminance change curve of each desktop during daylight on a sunny day.
Without using any lighting control system, simply turn on all the lighting fixtures, the total power of the luminaire is 450W. When we only use the window to introduce natural light, the row of lamps closest to natural light will generally turn off, and the natural luminosity will change over time due to the operation of the earth, and the average total power for 8 h is 220W. The average power of enabling intelligent lighting control for 8 h in a multi-cloud environment is 210W, while the average power of enabling intelligent lighting control for 8 h in a clear sky environment is 115W, because the use of intelligent lighting control can reduce the output luminous flux of the luminaire and reduce the power used by the luminaire. Of course, if we want to achieve overall lighting comfort, adaptive intelligent lighting control will highlight its advantages.
5.2 Experimental results and analysis
In the third chapter, we introduce the adaptive intelligent control based on the non-dominated ranking genetic algorithm to achieve the illumination of indoor desktop surface, and finally use the program to achieve the optimal balance of desktop lighting. The test of system energy consumption verifies the practicality of the scheme in energy consumption optimization. In order to further compare the efficiency of the scheme, we compare the scheme with the existing extreme value search algorithm based on gradient method. According to the experimental results, we make the change plot of the illumination of the two algorithms over time as shown in Figure 7, and the relationship between the two algorithms of E-T is shown in Figure 8, and we put the illumination and output of the two algorithms on a graph respectively in order to visually compare. In Figure 8, we made two error bars, one with an error bar of 5%E, which is the solid red line in the figure, and the other with an error bar of 27% E, which is the green line in the figure. The purpose of marking these two lines is to give a visual comparison between the results of the search experiment and the results of the traversal experiment. Schematic diagram of light variation curve with time is shown in Figure 7. Schematic diagram of E-t relationship change is shown in Figure 8.

FIGURE 7. Schematic diagram of light variation curve with time. ((A) The gradient method is used to search the illumination variation diagram with time; (B) Time-dependent graph of illumination for genetic search based on non-dominated sequencing).
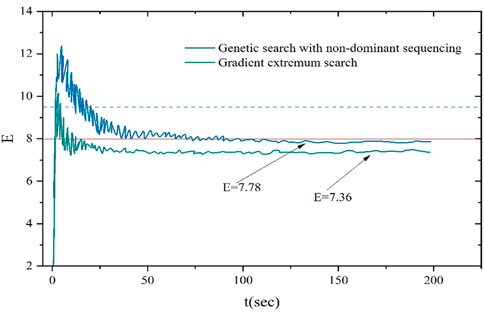
FIGURE 8. Schematic diagram of E-t relationship change.
As can be seen from Figure 7, the real-time illumination value change under the two algorithms is basically stable near the set value. It can be seen from Figure 8 that the energy consumption of the gradient-based extreme value search algorithm is basically stable at about 7.78 after 80 s, and the energy consumption of the no dominated ranking genetic algorithm is basically stable at about 7.36 after 30 s. In the energy-saving control of intelligent lighting system, the time required to search for the relative minimum energy consumption based on the no dominated ranking genetic algorithm is significantly less than that based on the gradient method extreme value search algorithm. This shows that the search rate based on the no dominated ranking genetic algorithm is faster than that based on the gradient method extremum search algorithm. Compared with the relative minimum energy consumption value searched, the relative minimum energy consumption value searched based on the no dominated ranking genetic algorithm is smaller than that based on the gradient method extreme value search algorithm, indicating that the no dominated ranking genetic algorithm is better in terms of energy saving effect. In the traversal experiment, we obtain a relative minimum energy consumption value of 7.4658, and the calculation results by the error show that the search results based on the no dominated sorting genetic algorithm are closer to the results of the traversal experiment.
In Figure 9, we compare “pure fuzzy control” (Diethorn, 2021), “genetic algorithms” (Luo and Oyedele, 2021), “BP neural networks” (Liu et al., 2019), “adaptive fuzzy control” (Wei et al., 2021), “Mou et al. (Moudgil et al., 2023)”, “Rou et al.” (Roumi et al., 2023), and “Yaz et al. (Yazdanpanah, 2023)” There are a total of 8 models with our model. With the increase in the number of inferences, the change of inference time needs to consider the characteristics of real-time response and adjustment of architectural lighting adaptive energy-saving control. Our model is compared with other models on different data sets. , have better performance in terms of inference speed. The reasoning speed is faster, indicating that the data processing capability of the model is stronger. The adaptive energy-saving control of architectural lighting needs to monitor and analyze various factors (such as the light intensity inside and outside the building, temperature, humidity, etc.), and the artificial intelligence model needs to have strong Data processing capabilities to obtain accurate and effective data information. Therefore, our model has a strong fit for this study.

FIGURE 9. Comparison of inference speed of different models under different conditions (the left picture is the data obtained under sunny weather, and the right picture is the data obtained under cloudy sky).
In Figure 10, we compared the calculation amount of data obtained by different models under different weather conditions. The smaller the calculation amount of a model, the less data it processes, the simpler the model structure and the corresponding model, and The better the performance; it can be seen from the figure that no matter the data set, our model has the smallest amount of calculation, which can provide conditions for faster reasoning and training speed.

FIGURE 10. Comparison of calculation amount of different models (the picture above shows the data under a sunny day, and the picture below shows the data under a cloudy day).
In Figure 11, we compare “Ours”, “pure fuzzy control”, “genetic algorithms”, “BP neural networks”, “adaptive fuzzy control”, “Mou et al.”, “Rou et al.”, “Yaz et al.” The Lift values of a total of 8 models. The Lift value measures the performance of a classification model, which describes how well the model’s predictions compare to random guessing. A Lift value greater than 1 indicates that the model performs better than random guessing, while a Lift value less than 1 indicates that the model does not perform as well as random guessing. Lift values are often used to evaluate classification models in scenarios such as marketing or recommender systems, such as advertisement click-through rate prediction and product purchase probability prediction, etc. In these scenarios, the goal of the model is to identify those users who are interested or have purchase intentions as much as possible to improve recommendations’ accuracy and transaction rate. Therefore, the Lift value is also an important indicator to measure the running effect of a model. It can be seen from the figure that the Lift value (lift index) of our model is higher than that of other models in both dataset 1 and dataset 2., showing good performance.
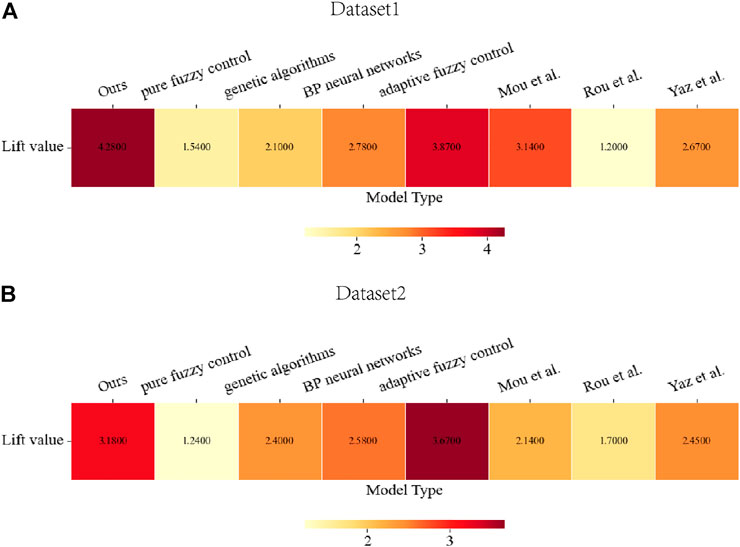
FIGURE 11. Comparison of Lift values of different models on different datasets [Picture (A) is the data obtained from Dataset 1 on sunny days, and Picture (B) is the data obtained from Dataset 2 on cloudy days. The larger the Lift value (lift index), the better the model. better].
For example, process 2 is the running process of our model. First input the data set Dataset “sunny weather”, “cloudy weather”, then perform Feature extraction and Pre-training, then input the data into the NSGA network and smart grid for training, and finally repeat the training process through a series of calculations to complete the network train.
Algorithm 2. Training process of network “NSGA”.
1: Input: Dataset "sunny weather", "cloudy weather"
2: Output: Trained network "NSGA"
3: Step 1: Feature extraction
4: Extract features from the input images using a pre-trained convolutional neural network (CNN).
5: Step 2: Pre-training
6: Train the feature extractor using unsupervised pre-training, such as autoencoder, to learn better representations of the input data.
7: Step 3: Transfer learning
8: Fine-tune the pre-trained feature extractor on the "sunny weather" dataset to adapt it to the specific domain.
9: Step 4: Non-dominated sorting genetic algorithm (NSGA)
10: Use NSGA to optimize the network's architecture and hyperparameters for multi-objective performance, such as accuracy and efficiency.
11: Step 5: Smart grid
12: Use a smart grid to search for the optimal hyperparameters of the network, such as learning rate and batch size.
13: Step 6: Loss calculation
14: Calculate the loss of the network using a specific loss function, such as cross-entropy or mean squared error.
15: Step 7: Parameter update
16: Update the parameters of the network using an optimization algorithm, such as stochastic gradient descent (SGD).
17: Step 8: Warm start
18: Use a warm start strategy to initialize the network's parameters for faster convergence.
19: Step 9: Adversarial training
20: Train the network with adversarial examples to improve its robustness to input perturbations.
21: Step 10: Repeat
22: Repeat Steps 4-9 until the network achieves satisfactory performance on the "cloudy weather" dataset.
In Figure 12, we compare the stability indicators of different models in different data sets. The Population Stability Index (PSI) is an indicator used to measure the stability between two groups, usually in evaluating risk models or other predictive model performance. It can help us determine whether a model has consistent predictive power over different periods or across different sample populations. The smaller the PSI value, the smaller the distribution difference between the new data set and the historical data set, and the better the stability of the model. A PSI value less than 0.10 indicates good model stability, while a value greater than 0.25 indicates poor model stability. It can be seen from the figure that when our model has a large number of inferences, its stability index is still within a good index, and it is suitable for simple and complex data sets and has strong generalization.
Figure 13 compares different models’ control effects and recall rates on different data sets. The control effect of the model is one of the most important indicators to evaluate the adaptive energy-saving control model of architectural lighting, that is, the brightness and switch of the light controlled by the model. The degree to which the status matches the actual needs. The recall rate of the model is used to measure the ability of the model to identify positive samples, that is, how many real positive examples the model can correctly find. It is also one of the important indicators to measure the model. As can be seen from Figure 13, whether our model is in data set 1 or data set 2, its control effect and recall rate are greater than other models, showing a good performance. The effect can effectively deal with this problem.
In Table 2, we summarize the previous comparisons, mainly composed of accuracy, calculation amount, and parameter amount, and mark the literature we refer to in different models. Our model is superior to other models in terms of accuracy, computation, and parameters, and we can have a more comprehensive and intuitive understanding of our model.

FIGURE 12. Changes in the stability index (PIS) of different models when the number of inferences is different [Picture (A) is from the data collected on sunny days in Dataset 1, It is a relatively simple data set, and picture (B) is from the data collected on cloudy days in data set 2, which is a relatively complex data set].

FIGURE 13. Comparison of the control effect and recall rate of different models (dataset 1 is the data collected on sunny days, which is a relatively simple data set, and data set 2 is the data collected on cloudy days, which is a relatively complex data set).
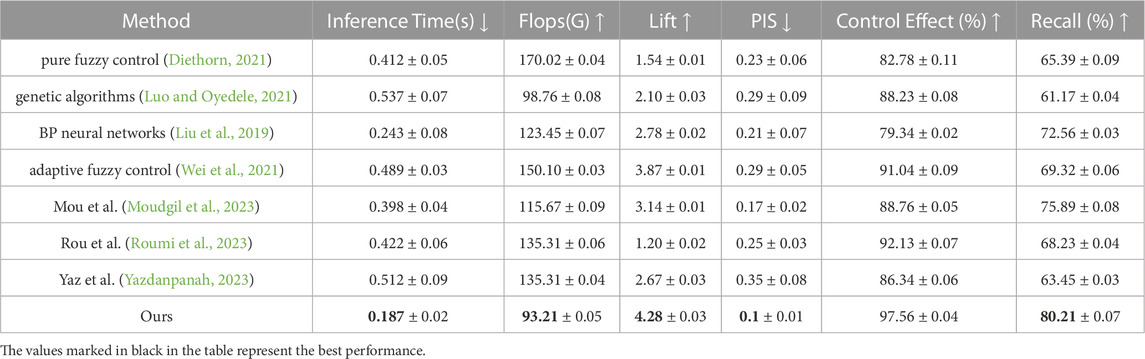
TABLE 2. Performance evaluation of different methods.
6 Conclusion and discussion
This paper proposes applying a smart grid and non-dominated sorting genetic algorithm in adaptive energy-saving control of architectural lighting, which can solve the energy-saving problem of architectural lighting. Data, combined with a non-dominated sorting genetic algorithm, which supports unconstrained and constrained problems; can effectively deal with multi-objective problems; effectively maintain diversity; high search efficiency and good accuracy. It is used to solve the problem of optimizing multiple objective functions simultaneously, which can effectively help solve the power system scheduling problem. In the experiment, we compared our model with other models. The results show that our model has the advantages of faster reasoning speed, lower calculation load, and the highest control rate and recall rate. It has a good operating effect and can Effectively solve the problem of adaptive energy-saving control of architectural lighting.
However, our method also has some limitations, such as parameter adjustment difficulties: non-dominated sorting genetic algorithm needs to set a series of parameters, such as population size, crossover probability, mutation probability, etc., and the adjustment of these parameters may have an important impact on the performance of the algorithm. Influence, but it is difficult to determine the optimal value intuitively. The optimization process of the non-dominated sorting genetic algorithm is relatively complicated, and its results are difficult to explain intuitively, which may cause difficulties for users to understand. To solve these problems, consider optimizing the model, using the form of a combined model, combining the advantages of each model to make the model work better.
Presently, lighting energy saving has been paid attention to by countries worldwide, and some developed countries have formulated green lighting plans. Relevant departments of the United Nations have also proposed developing intelligent lighting buildings with scientific and advanced lighting technology, which shows the significance of lighting energy-saving research. This paper counts the power data of the intelligent lighting system under different weather conditions through simulation experiments. By comparing the power data of other different lighting control methods, it is found that the intelligent lighting system maximizes the utilization of natural light and achieves the purpose of maximum energy saving without affecting normal lighting, which provides a theoretical basis for the intelligent lighting system. Promote the lighting control system based on the DALI protocol. The system designed in this paper is an intelligent lighting system, but there still needs to be a big gap from real intelligence. In this paper, grouping control of lamps is carried out, but grouping is only artificial grouping, which is not allowed in practical applications, and many factors need to be considered. For example, indoor facilities, the main activity area of personnel, etc. These are the difficulties that need to be solved in the later stage.
Data availability statement
The raw data supporting the conclusions of this article will be made available by the authors, without undue reservation.
Author contributions
Contributions YW, SH, and CG contributed to the conception and design of the study. YW organized the database. SH performed the statistical analysis. CG wrote the first draft of the manuscript. YW, SH, and CG wrote sections of the manuscript. All authors contributed to the article and approved the submitted version.
Funding
2021 Jiangsu University Blue Project excellent young backbone teacher training project funded (RCQL202102); 2020 Nanjing Vocational Institute of Railway Technology “Blue Project” excellent young backbone teacher training project (RCQL20205).
Conflict of interest
SH and CG were empolyed by Nari Technology Co., Ltd.
The remaining author declares that the research was conducted in the absence of any commercial or financial relationships that could be construed as a potential conflict of interest.
Publisher’s note
All claims expressed in this article are solely those of the authors and do not necessarily represent those of their affiliated organizations, or those of the publisher, the editors and the reviewers. Any product that may be evaluated in this article, or claim that may be made by its manufacturer, is not guaranteed or endorsed by the publisher.
References
Antoine, G., Mikeka, C., Bajpai, G., and Jayavel, K. (2021). Speed management strategy: Designing an iot-based electric vehicle speed control monitoring system. Sensors21, 6670. doi:10.3390/s21196670
Cai, W., Ning, X., Zhou, G., Bai, X., Jiang, Y., Li, W., et al. (2022). A novel hyperspectral image classification model using bole convolution with three-direction attention mechanism: Small sample and unbalanced learning. IEEE Trans. Geoscience Remote Sens., 61, 1, 17. doi:10.1109/tgrs.2022.3201056
Chen, B.-R., Liu, Z., Song, J., Zeng, F., Zhu, Z., Bachu, S. P. K., et al. (2022). Flowtele: Remotely shaping traffic on internet-scale networks. In Proceedings of the 18th International Conference on emerging Networking EXperiments and Technologies. 349–368.
Cheng, K., Huang, Z., Wang, P., Sun, L., Ghasemi, H., Ardebili, H., et al. (2023). Antibacterial flexible triboelectric nanogenerator via capillary force lithography. J. Colloid Interface Sci.630, 611–622. doi:10.1016/j.jcis.2022.10.129
Diethorn, J. A. (2021). Implementation of fuzzy logic control into an equivalent minimization strategy for adaptive energy management of A parallel hybrid electric vehicle (West Virginia University)
Fei, J., Yang, J., Liang, L., Meng, C., and Mei, S. (2023). Exploring the impact of emotional and cognitive factors on anxiety symptoms of Chinese adolescents: A serial mediation study. IEEE Internet Things J., 1, 15. doi:10.1007/s11469-022-01004-8
Ge, Y., Song, B., Pei, Y., Mollet, Y., and Gyselinck, J. (2019). A fuzzy logic based method for fault tolerant hierarchical load management of more electric aircraft. Proc. Institution Mech. Eng. Part G J. Aerosp. Eng.233, 3846–3856. doi:10.1177/0954410018807598
Han, J.-X., Ma, M.-Y., and Wang, K. (2021). Retracted article: Product modeling design based on genetic algorithm and BP neural network. Neural Comput. Appl.33, 4111–4117. doi:10.1007/s00521-020-05604-0
He, F., and Ye, Q. (2022). A bearing fault diagnosis method based on wavelet packet transform and convolutional neural network optimized by simulated annealing algorithm. Sensors22, 1410, doi:10.3390/s22041410
Li, C., Chen, Z., and Jiao, Y. (2023). Vibration and bandgap behavior of sandwich pyramid lattice core plate with resonant rings. Materials16, 2730, doi:10.3390/ma16072730
Liu, B., Zhang, L., Wang, F., Liu, M., Mao, Y., Zhao, L., et al. (2019). Adaptive dynamic wavelength and bandwidth allocation algorithm based on error-back-propagation neural network prediction. Opt. Commun.437, 276–284. doi:10.1016/j.optcom.2018.12.064
Long, J., Wu, S., Han, X., Wang, Y., and Liu, L. (2023). Autonomous task planning method for multi-satellite system based on a hybrid genetic algorithm. Aerospace10, 70, doi:10.3390/aerospace10010070
Luo, X., and Oyedele, L. O. (2021). Forecasting building energy consumption: Adaptive long-short term memory neural networks driven by genetic algorithm. Adv. Eng. Inf.50, 101357, doi:10.1016/j.aei.2021.101357
Moudgil, V., Hewage, K., Hussain, S. A., and Sadiq, R. (2023). Integration of iot in building energy infrastructure: A critical review on challenges and solutions. Renew. Sustain. Energy Rev.174, 113121, doi:10.1016/j.rser.2022.113121
Nazari, M., Nazifi, S., Huang, Z., Tong, T., Ouro-Koura, H., Bao, J., et al. (2020). Surface tension nanogates for controlled ion transport. ACS Appl. Nano Mater.3, 6979–6986. doi:10.1021/acsanm.0c01304
Ning, X., Tian, W., He, F., Bai, X., Sun, L., and Li, W. (2023). Hyper-sausage coverage function neuron model and learning algorithm for image classification. Pattern Recognit.136, 109216, doi:10.1016/j.patcog.2022.109216
Niu, H., Lin, Z., Zhang, X., and Jia, T. (2022). Image segmentation for pneumothorax disease based on based on nested unet model. In 2022 3rd international conference on computer vision, image and deep learning & international conference on computer engineering and applications (CVIDL & ICCEA) (IEEE) 756–759.
Özçelik, M. A. (2018). The design and comparison of central and distributed light sensored smart led lighting systems. Int. J. Photoenergy2018, 1–14. doi:10.1155/2018/4589085
Rehman, G. U., Zubair, M., Qasim, I., Badshah, A., Mahmood, Z., Aslam, M., et al. (2023). Ems: Efficient monitoring system to detect non-cooperative nodes in iot-based vehicular delay tolerant networks (vdtns). Sensors23, 99, doi:10.3390/s23010099
Roumi, S., Zhang, F., Stewart, R. A., and Santamouris, M. (2023). Weighting of indoor environment quality parameters for occupant satisfaction and energy efficiency. Build. Environ.228, 109898, doi:10.1016/j.buildenv.2022.109898
Soheilian, M., Fischl, G., and Aries, M. (2021). Smart lighting application for energy saving and user well-being in the residential environment. Sustainability13, 6198, doi:10.3390/su13116198
Song, Z., Johnston, R. M., and Ng, C. P. (2021). Equitable healthcare access during the pandemic: The impact of digital divide and other sociodemographic and systemic factors. Appl. Res. Artif. Intell. Cloud Comput.4, 19–33.
Song, Z., Mellon, G., and Shen, Z. (2020). Relationship between racial bias exposure, financial literacy, and entrepreneurial intention: An empirical investigation. J. Artif. Intell. Mach. Learn. Manag.4, 42–55.
Tavares, P., Ingi, D., Araújo, L., Pinho, P., and Bhusal, P. (2021). Reviewing the role of outdoor lighting in achieving sustainable development goals. Sustainability13, 12657, doi:10.3390/su132212657
Tran, T., Baroutaji, A., Estrada, Q., Arjunan, A., Le, H., and Thien, N. (2021). Crashworthiness analysis and optimization of standard and windowed multi-cell hexagonal tubes. Struct. Multidiscip. Optim.63, 2191–2209. doi:10.1007/s00158-020-02794-y
Wei, C., Chen, Y., Li, X., and Lin, X. (2022). Integrating intelligent driving pattern recognition with adaptive energy management strategy for extender range electric logistics vehicle. Energy247, 123478. doi:10.1016/j.energy.2022.123478
Wei, C., Sun, X., Chen, Y., Zang, L., and Bai, S. (2021). Comparison of architecture and adaptive energy management strategy for plug-in hybrid electric logistics vehicle. Energy230, 120858. doi:10.1016/j.energy.2021.120858
Wu, S., Wang, J., Ping, Y., and Zhang, X. (2022). Research on individual recognition and matching of whale and dolphin based on efficientnet model. In 2022 3rd international conference on big data, artificial intelligence and internet of things engineering (ICBAIE) (IEEE) 635–638.
Xiang, C., Wu, Y., Shen, B., Shen, M., Huang, H., Xu, T., et al. (2019). Towards continuous access control validation and forensics. In Proc. 2019 ACM SIGSAC Conf. Comput. Commun. Secur. 113–129. doi:10.1145/3319535.3363191
Yang, Z., Sun, L., Sun, Y., Dong, Y., and Wang, A. (2023). A conceptual model of home-based cardiac rehabilitation exercise adherence in patients with chronic heart failure: A constructivist grounded theory study. Patient Prefer. adherence17, 851, 860. doi:10.2147/ppa.s404287
Yazdanpanah, F. (2023). A low-power wnoc transceiver with a novel energy consumption management scheme for dependable iot systems. J. Parallel Distributed Comput.172, 144–158. doi:10.1016/j.jpdc.2022.10.010
Zhang, H., Zhang, F., Gong, B., Zhang, X., and Zhu, Y. (2023). The optimization of supply chain financing for bank green credit using stackelberg game theory in digital economy under internet of things. J. Organ. End User Comput. (JOEUC)35, 1–16. doi:10.4018/joeuc.318474
Zhang, L., Sun, L., Li, W., Zhang, J., Cai, W., Cheng, C., et al. (2021). A joint bayesian framework based on partial least squares discriminant analysis for finger vein recognition. IEEE Sensors J.22, 785–794. doi:10.1109/jsen.2021.3130951
Zhong, J., Hu, S., Wang, Z., and Han, Z. (2023). A cascade bp neural network tuned pid controller for a high-voltage cable-stripping robot. Micromachines14, 689, doi:10.3390/mi14030689
Keywords: smart lighting, digital buildings, non-dominating sorting genetic algorithms, augmented reality, smart grid
Citation: Wang Y, Huang S and Guo C (2023) Application of smart grid and non-dominated sorting genetic algorithm in adaptive energy-saving control of building lighting. Front. Energy Res. 11:1202090. doi: 10.3389/fenrg.2023.1202090
Received: 07 April 2023; Accepted: 15 May 2023;
Published: 09 June 2023.
Edited by:
Imr Fattah, University of Technology Sydney, AustraliaReviewed by:
Lia Elena Aciu, Transilvania University of Brașov, RomaniaJianchu Lin, Huaiyin Institute of Technology, China
Ziheng Chen, Walmart Labs, United States
Copyright © 2023 Wang, Huang and Guo. This is an open-access article distributed under the terms of the Creative Commons Attribution License (CC BY). The use, distribution or reproduction in other forums is permitted, provided the original author(s) and the copyright owner(s) are credited and that the original publication in this journal is cited, in accordance with accepted academic practice. No use, distribution or reproduction is permitted which does not comply with these terms.
*Correspondence: Yingrui Wang, d3lyMTkxMTIzQG5qcnRzLmVkdS5jbg==; Shengjie Huang, aHVhbmdzaGVuZ2ppZTFAc2dlcHJpLnNnY2MuY29tLmNu