 Wang Liao
 Jiaming Weng
 Dong Liu
 Yufeng Wu
- Key Laboratory of Control of Power Transmission and Conversion, The School of Electronic Information and Electrical Engineering, Shanghai Jiao Tong University, Shanghai, China
With global climate change, increasingly frequent natural disasters have brought great challenges to the safe and reliable power supply and low-carbon transition of power distribution systems. Most of the existing researches on the distribution system under the impact of natural disasters only focus on the improvement of power supply reliability, but have not consider the impact of disaster severity and disaster response measures on carbon emissions. In order to juggle the load restoration and carbon emission mitigation of distribution system under natural disasters, this paper proposes an optimal allocation method of distributed renewable generations (DRGs) considering carbon emission for multi-scenario natural disasters based on the framework of cyber-physical-social system in energy (CPSSE), and establishes a three-stage optimization model of pre-disaster prevention-disaster attack-post-disaster restoration. For the purpose of ensuring the practicability and robustness of the allocation results, the disaster scenario is modeled and the selection method of the worst fault scenario under disaster is proposed. The progressive hedging algorithm (PHA) is adopted to solve the proposed multi-scenario optimization problem. Finally, the simulation results indicate that the proposed method can restore more lost load at a lower cost of carbon emissions.
1 Introduction
The power industry is the main battlefield for achieving carbon peaking and carbon neutrality targets. It is of great strategic significance to build a modern power system with renewable energy as the main part and realize the low-carbon transition of the power system (FERNÁNDEZ-GUILLAMÓN et al., 2019; Wen et al., 2020; Zhuo et al., 2020). However, the realization of low-carbon transition of power system is a complex systematic project, which requires decision analysis of system development in the context of many new difficulties and new technologies. In recent years, with the increase of global carbon emissions, climate change has intensified (Wang et al., 2016; IPCC, 2019), and increasingly frequent natural disasters have brought great challenges to the safe and reliable power supply of power distribution systems. The distribution system is located at the end of the power grid and is directly connected to the power consumers. Due to its own characteristics, the distribution system is extremely vulnerable to natural disasters (Li et al., 2014), which seriously affects people’s production and life, causing huge losses (Chen et al., 2017). Thus, it is one of the primary tasks to construct a modern distribution system by formulating corresponding prevention and restoration strategies to improve the response capability for disasters and power supply reliability of the distribution system (Xue et al., 2013; Shen et al., 2020).
A large number of existing studies focus on the resilience improvement of distribution systems and the restoration of power supply under the impact of natural disasters. The measures taken can be divided into two categories: pre-disaster prevention and post-disaster restoration.
Pre-disaster prevention measures usually optimize the allocation and deployment of infrastructure or disaster prevention resources in advance to alleviate the damage and impact of disasters on the distribution system. In order to improve the resilience of the distribution system against hurricanes, the pre-disaster optimal placement model for the depots of the repair teams is proposed in the references (Khomami and Sepasian, 2018; Arif et al., 2020), so as to realize the rapid repair of the post disaster poles and lines. In the reference (Gan et al., 2022), considering the coupling of distribution system and transportation system, a planning model is proposed to improve the resilience of coupled network under disaster. The model includes the capacity expansion of power lines, roads and charging stations and the hardening of roads and power lines. In the reference (Barnes et al., 2019), the transmission capacity of the line is guaranteed by configuring additional lines, circuit breakers and transformers. According to the prediction of possible fault scenarios, the locations of the gathering point of the mobile emergency generators are selected in the reference (Lei et al., 2018) to minimize the system load loss. In the references (Lin and Bie, 2018; Ma et al., 2018), the weak lines are identified and hardened before disasters to improve the resistance of the lines to the disaster. In the references (Alguacil et al., 2014; Yuan et al., 2016; Wang et al., 2019a; Wu et al., 2019), a typical three-layer optimization strategy of defender-attacker-defender (DAD) is proposed. In the first layer, the system planning layer (acting as a defender) determines the optimal installation location of distributed generation or energy storage under specified budget constraints. In the second layer, the natural disaster (attacker) maximizes the system load loss under the specified number of line faults. In the third layer, the system operation layer minimizes the system load loss through the restoration strategy.
Post-disaster restoration measures are mainly to restore load power as quickly and as much as possible by formulating operation strategies after the disaster caused damage to the distribution systems. In the reference (Zhang et al., 2023), the characteristics of AC/DC hybrid distribution system are studied, and a topology search strategy and fault restoration model with DC lines as the core are proposed to realize the restoration of multiple power sources and key loads. In the references (Yao et al., 2019; Li et al., 2021), the real-time post-disaster dispatching strategies for transportable energy storage are proposed in view of the power outages caused by disasters. The efficient dispatching strategies of maintenance crews and restoration crews are developed restore electricity customers after the disasters (Zhang et al., 2020a; Sun et al., 2023). In the reference (Hafiz et al., 2019), load restoration is combined with direct load control and demand response to improve system resilience through the flexibility provided by load. In the references (Lin and Bie, 2018; Ghasemi et al., 2021), the network reconfiguration (NR) method is used to divide the island, so as to minimize the load loss in the fault scenario. In the reference (Hao et al., 2022), a two-layer decision support framework is designed for the post-disaster restoration of distribution systems. The upper layer generates a pre-adjustment scheme through load transfer and topology partition, and the lower layer optimizes the restoration scheme of each partition.
In summary, the existing research on the distribution system under disasters is mainly carried out from the perspective of improving the reliability of power supply, but the impact of disasters on carbon emissions is ignored. It is pointed out in the references (Yu and Xue, 2016; Xue and Yu, 2017) that the power system is gradually developing into a CPSSE that combines multiple fields and interdisciplinary. Under the CPSSE framework, the previous methods for analyzing disaster issues in power distribution systems have been unable to meet the requirements of the new research paradigm under the social issue of low-carbon transition, and an integration of holistic thinking and reductive thinking should be applied for research and analysis (Mulej, 2007). Moreover, addressing the impact of natural disasters is also a challenge that needs to be overcome in the development of low-carbon power systems. Based on such a background and methodological guidance, research on the impact of disasters should not only focus on the power balance, but also on the change of carbon emissions. From a long-term perspective, with the sudden and frequent occurrence of disasters, the cumulative effect will lead to the deviation of carbon emission trajectory from the expected path, which will hinder the realization of low-carbon transition goals. Accordingly, the study of the resilience of distribution systems under disasters should not be separated from carbon emission factors. Additionally, in the process of actual disaster prevention and power supply restoration, some measures are often taken to maximize the benefits of power supply reliability at the expense of high carbon emissions. However, from a low-carbon perspective, these prevention and response measures for disasters still have room for improvement.
To fill the gaps in the previous research, this paper proposes an optimal allocation method for DRGs considering carbon emissions under multi-scenario disasters. The main contributions can be summarized as follows:
• A DAD optimization model under multi-scenario natural disasters with consideration of carbon emissions is proposed, in which the DRGs are optimally allocated before the disaster and the NR method is adopted after the disaster to achieve disaster prevention and post-disaster restoration.
• The load loss emission ratio (LER) is established as the evaluation index of disaster prevention and response scheme.
• The line fault model under disaster scenarios is modeled, the fault constraints are given, and the selection method of the worst fault scenario is proposed.
• The PHA is adopted to solve the proposed multi-scenario optimization model.
The rest of the paper is organized as follows: In Section 2, the influence of natural disasters on the change of carbon emissions of distribution system is analyzed. In Section 3, the mathematical formulation of the DAD optimization model is developed. In Section 4, the disaster scenario is modeled and the worst fault scenario selection process is proposed. In Section 5, the solution method to solve the multi-scenario optimization model is presented. Case studies are performed in Section 6. The paper is concluded in Section 7.
2 Carbon emission increment analysis of distribution system under natural disasters
Extreme events such as natural disasters can cause changes in the trajectory of carbon emissions and carbon sinks, bringing risks to achieving carbon neutrality target (Jiang et al., 2022). From the perspective of natural ecosystems, disasters will lead to a series of consequences of reducing carbon sinks and increasing carbon emissions, such as vegetation destruction and fire burning. From the perspective of power system, disasters will directly or indirectly affect the carbon emission. The carbon emission increment caused by natural disasters in the distribution system can be analyzed from the following aspects (Zhang et al., 2022):
1) Natural disasters lead to the functional failure of some equipment, and additional carbon emissions are caused by the replacement of redundant equipment. For example, the destruction of low-carbon power generation resources or the damage of lines lead to the blockage of low-carbon power transmission. In order to ensure the demand of power load, high-carbon power supply is used for replacement, resulting in an increase in carbon emissions.
2) Due to the lack of power supply caused by natural disasters, the increase of carbon emissions can be caused by other power substitution on the power consumer side. After some functions of the distribution system fail, the capacity of redundant equipment can be insufficient, which may lead to consumer-side power outages. For some unstoppable energy supply in production and life, such as many enterprises use self-provided power generation, some commercial or residential electric heating using gas instead, and electrified transportation using fuel oil instead, it means replacing low-carbon power with high-carbon power to meet demand.
3) The reference (Dou et al., 2022) pointed out that natural disasters can reduce carbon emissions to a certain extent, because natural disasters inhibit power consumption. However, in fact, for some production rigid loads, even if the load is reduced due to loss of power supply during the disaster, the production plan will be postponed until the fault is removed, so this part of the carbon emissions is not reduced. Therefore, although this part of the load transfer caused by the disaster itself does not bring excess carbon emissions, it cannot be ignored when calculating the carbon emissions of the power system after the disaster.
The additional carbon emissions of the distribution system under natural disasters may also include: the reduction of carbon sinks caused by the outage of artificial carbon reduction engineering equipment such as carbon capture, utilization and storage (CCUS), and the additional carbon emissions generated during the physical damage removal and fault repair of the distribution system. These are not considered in this paper.
3 Optimal allocation model of DRGs considering carbon emissions
Natural disasters can cause component damage, partial load loss of power supply, and also lead to the risk of additional carbon emissions in the distribution system. In order to improve the resilience to the impact of extreme disasters and reduce the negative impact of extreme disasters on the load loss and carbon emissions of the distribution system, appropriate disaster prevention and response measures need to be developed according to the different vital stages of the disaster effects. In this paper, the occurrence of natural disasters is regarded as an attack on the power grid, and a DAD three-stage model is proposed. The first stage is that the power grid operator acts as the defender to deploy the optimal allocation scheme of the distribution system before the disasters. The second stage is that the disasters act as the attacker to implement the attack behavior. The third stage is to develop a post disaster dispatching plan for the defender to reduce the impact of disasters. The schematic diagram of the three-stage model proposed in this paper is shown in Figure 1.
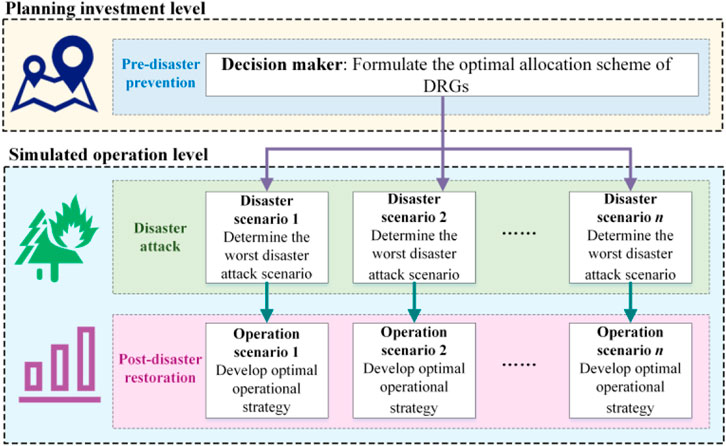
FIGURE 1. Three-stage model diagram.
From the perspective of power grid decision makers, the optimal allocation model proposed in this paper can be divided into two levels: planning investment level and simulated operation level. The objective function can be written in the form of min-max-min as follows:
where
3.1 Planning investment level model
The model at the planning investment level is to solve the optimal DRGs allocation scheme under the disaster attack scenario. The objective function consider both the investment and construction cost. The objective function is as follows:
where
The constraints at the planning investment level are mainly the allocation budget constraints of DRGs, including the cardinality budget and the monetary budget. The mathematical form of the constraints is as follows:
where
3.2 Simulated operation level
An ideal DRGs allocation scheme can not only reduce the output of carbon-emitting units and improve the low-carbon performance of the system operation, but also effectively prevent the risk of insufficient power supply and increased carbon emissions caused by disaster scenarios. Under a given allocation scheme and determined scenario conditions, the model at the simulated operation level minimizes the load loss in the disaster scenarios by means of NR, while also considering the economic efficiency and carbon emission mitigation. Therefore, the optimization objective includes the operation cost
where
The constraints of the above model are as follows:
3.2.1 Power balance and power flow constraints
The DC power flow model is adopted for modeling, and the following constraints should be met for all scenarios
where
3.2.2 Reconfiguration switch constraint
Under the disaster scenario, the distribution system adjusts the state of the reconfiguration switches by means of NR, so as to change the operation mode, which can effectively reduce the load loss, mitigate the impact of disasters and improve the ability to cope with natural disasters. The reconfiguration switch constraint is as follows:
where
3.2.3 Power output constraints
The power sources in the distribution system mainly include controllable distributed generators (DG) and renewable power generation. In addition, the injection power of the upstream power grid is also regarded as the power output, and the output cost mainly considers the purchase cost of the upstream power grid.
where
3.2.4 Load shedding constraint
In order to maintain power balance, part of the load can be disconnected from the grid by load shedding when the distribution system fails due to disasters. The load shedding cannot exceed the expected load, so the constraint can be expressed as follows:
3.2.5 Topological constraints
After natural disasters, the distribution system can realize island partition through NR and improve the reliability of power supply. To prevent the occurrence of ring and node isolation after NR, the radiality of the distribution system and the connectivity of the islands should be guaranteed. The reconstructed grid topology under the fault scenario should meet the following two necessary and sufficient conditions (Balakrishnan and Ranganathan, 2012).
Condition 1. The number of closed branches is equal to the total number of nodes minus the number of partitions.
Condition 2. Each partition should ensure its connectivity.
The key to satisfy the first condition is to determine the number of partitions. In the reference (Lavorato et al., 2012), the number of DGs is taken as the number of partitions when partitioning islands. However, in fact, there may be multi-power island and load island. In this regard, this paper assumes that each partition has only one dominant node, and the number of dominant nodes determines the number of partitions. Then the constraints corresponding to Condition 1 can be expressed as follows:
where
For Condition 2, this paper uses the single commodity flow method to describe the connectivity constraints of the partition. For each partition, its only dominant node is set as a fictitious source, and other non-dominant nodes are set as fictitious loads (the load value can be valued as 1). In order to ensure connectivity, all non-dominant nodes should be connected to the dominant node, and the following fictitious flow constraints need to be met (Ding et al., 2017a; Ding et al., 2017b; Zhang et al., 2020b):
where
3.3 Evaluation index
In order to evaluate the impact of the response scheme on the carbon emissions of the disaster-stricken distribution system, this paper first defines the total carbon emission (TCE) as an evaluation index to evaluate the carbon emission of the system under a given scheme. As previously analyzed, carbon emissions from rigid loads with production plan postponement need to be considered in post-disaster carbon accounting, so the TCE calculation formula is as follows:
where
On this basis, in order to comprehensively consider the impact of disaster response schemes on power supply reliability and carbon emissions, a load loss emission ratio (LER) is defined to characterize the effect of disaster response measures. The smaller the value is, the smaller the load loss value corresponding to the unit carbon emission under the scheme is. That is, more loads are restored at the cost of smaller carbon emissions. The calculation formula of LER is as follows:
where
4 Modeling and analysis of disaster scenarios
4.1 Disaster development model
The occurrence and development of natural disasters have certain regional and directional characteristics, and as a form of attack, its impact on the distribution system has certain uncertainty. Therefore, when analyzing the impact of natural disaster damage on the distribution system, it is necessary to fully consider the spatial and temporal characteristics of natural disaster development, clarify the disaster path in the distribution system, determine the scope of disaster impact on the distribution system, and evaluate the severity of disaster impact on the components in the distribution system.
Due to the strong correlation between the occurrence of natural disasters and geographical location, this paper combines the topology with the geographical information system (GIS), divides the system into square grids based on geographical areas (9), and draws a disaster frequency heat map as shown in Figure 2 based on the historical data of disasters. The red area in Figure 2 represents the disaster-prone area, and the deeper the red color, the higher the frequency of disasters, while the blue area represents the area where rare disasters occur. It can be seen from Figure 2 that the distribution system in the red area is more vulnerable to natural disasters and damage, resulting in fault.

FIGURE 2. GIS-based disaster frequency heat map in distribution system.
According to the disaster frequency heat map, the average frequency of a certain type of disaster in each square grid can be calculated, so as to obtain the high frequency occurrence square grid of such disaster in the grid area. The occurrence and development of disasters usually have certain dynamic spatial and temporal distribution characteristics, so it is necessary to consider the impact of disaster development path. This paper assumes that the disaster moves geographically along the development path and affects the distribution system along the way, causing the power line on the moving path to fail. Figure 3 shows the path of disaster development in the distribution system. The disaster moves along different paths from the occurrence point, and the lines in the square grid on the path will be affected by the disaster. Because the square grids on the disaster path are in different geographical areas, the degree of disaster impact is not the same. This paper assumes that in the square grid near the disaster point, the power grid is more seriously affected, while the grid far away from the disaster point is relatively less affected by the disaster (18). According to the disaster path and the disaster intensity in the square grid, the fault probability curve can be used to calculate the fault probability of the line in the grid. The fault probability curve can usually be expressed as (Panteli et al., 2017):
where
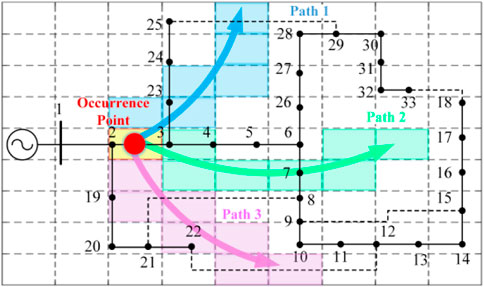
FIGURE 3. Disaster development path in distribution system.
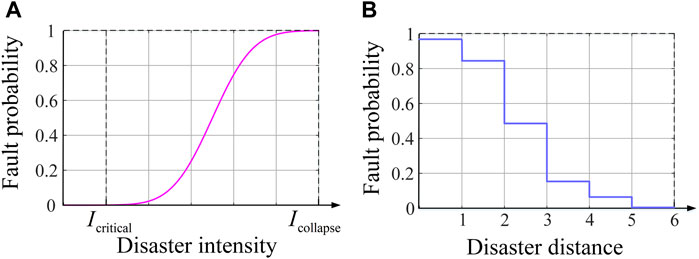
FIGURE 4. (A) Line fault probability under the variety of disaster intensity; (B) Line fault probability under the variety of disaster distance.
Because it is difficult to accurately measure and calculate the disaster intensity, in order to simplify the model and facilitate the solution, this paper uses the distance between the square grid on the disaster path and the disaster occurrence point to replace the disaster intensity as the input of the fault probability curve, and sets the line fault probability in each square grid to be the same. Therefore, the fault probability curve is discretized, and the discretized curve is shown in Figure 4B. In the figure, the disaster distance of the abscissa is represented by the square grid order along the disaster path.
4.2 Disaster scenario constraints
The distribution system itself has a certain degree of resistance to natural disasters, which determines that the damage of disasters to the power system is not without an upper limit. Therefore, this should be taken into account when generating line fault constraints in disaster scenarios. The disaster scenario is modelled by using the line fault set considering the budget of disaster attack. For a certain type of disaster scenario, the following constraints should be met:
where
where
After considering the impact of disasters and NR, the final state of the line in the distribution system can be expressed as:
where
4.3 Selection method of worst-case fault scenario
For the DAD model proposed in this paper, in order to ensure the robustness of the allocation results, the most severe impact of natural disasters as attackers on the distribution system should be considered. Based on the N-K criterion, a method for selecting the worst-case fault scenario considering the line fault probability is proposed. This method evaluates the severity of the impact of a line fault on the distribution system by solving the risk of load loss (Nikkhah et al., 2018). The worst-case fault scenario selection process is shown in Figure 5.

FIGURE 5. Flowchart of worst-case fault scenario selection.
The calculation formula of the risk of load loss (RoLL) mentioned in the above process is as follow:
where
5 Solution algorithm
5.1 Model linearization
After obtaining disaster information and related data, using the aforementioned disaster scenario modeling and worst-case fault scenario selection methods, it is possible to determine the specific attack scenario
where he specific expression of the optimization decision variables are:
The first row of constraints in Eq. 29 corresponds to Eq. 3; the second row corresponds to the last row of Eqs 12, 13, 15, 17, 20; the third row corresponds to Eqs 19, 21; the fourth row corresponds to Eqs 18, 27; the fifth row corresponds to Eqs 11, 14, and the first five rows of Eq. 20; and the sixth row corresponds to Eq. 10.
It can be seen that there is a case where integer decision variables are multiplied by continuous decision variables in constraint Eq. 10, and it is difficult to solve this nonlinear constraint. Therefore, the following linear equivalent transformation is conducted for this constraint:
First, define the auxiliary variable
Then, the following auxiliary constraints are introduced:
Finally, the constraint Eq. 10 becomes:
5.2 Solution method of PHA
As can be seen from Eq. 29, the model is a hierarchical multi-scenario optimization problem. The investment level decision variable a is an ex-ante decision variable that is independent of the scenario, while the operation level decision variables b and c are related to the scenario and need to be calculated based on the specific disaster scenario. For the multi-scenario optimization problem, the progressive hedging algorithm (Rockafellar and Wets, 1991) is employed to solve it. PHA is a decomposition algorithm for multi-scenario optimization problems. Its main idea is to use orthogonal projection and augmented Lagrange multiplier method to decompose the original problem into sub-problems in multiple scenarios for iterative solution. The advantage of PHA is that it exhibits global convergence when dealing with convex optimization problems. For the optimization problem shown in Eq. 29, the PHA iteration steps are as follows:
1) Initialization. Set
2) For all scenario
3) Update the parameters.
4) Set
5) Update the parameters according to Eqs 35, 36 and calculate the convergence index.
If
In the above iteration process,
6 Case study
6.1 Case description
The modified IEEE 33-node distribution system is used for case study, as shown in Figure 6. In the system, node 16 and node 31 are connected with a micro turbine (MT) respectively. In addition, there are power substitutions at nodes 14, 22, and 24, and rigid load with load transfer at nodes 10, 17, and 27. The disaster scenario data and disaster geographic information are derived from the actual statistical data of a disaster-prone year in a city in China. Using the method proposed in Section 4.1 to process disaster data can obtain typical disaster scenario probabilities, disaster paths, and line fault probabilities on disaster paths, as shown in Table 1. Due to the obvious seasonal characteristics of the occurrence of disasters, the k-means clustering method is used to process the historical data of wind power, photovoltaic and load in the disaster-prone seasons. This paper mainly focuses on the summer with frequent floods and the spring with frequent wildfires, and obtains the typical intraday curves of wind power, photovoltaic and load under disaster scenarios, as shown in Figure 7. The VoLL of each node of the test system is shown in Table 2. The allocation budget of DRGs includes 2 photovoltaic units and 1 WT with a capacity of 400 kW, and the power generation costs are 0.35¥/(kW·h) and 0.28¥/(kW·h) respectively. The cost of purchasing power from the upstream power grid is 0.78¥/(kW·h), and other parameters are shown in Table 3. In this paper, the duration of a single disaster is considered to be 24 h, so the simulation time scale is set to 24 h.
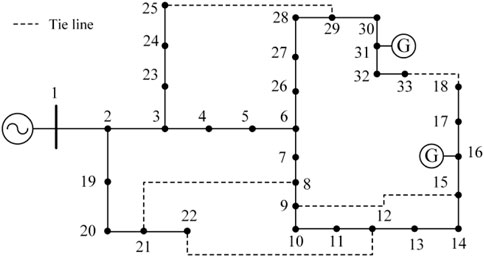
FIGURE 6. Modified IEEE 33-node system diagram.
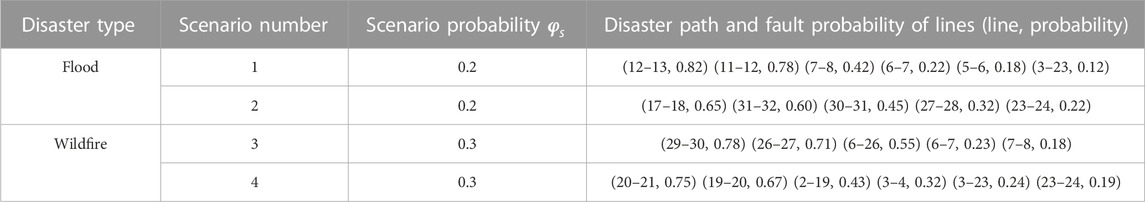
TABLE 1. Description of typical disaster scenarios.
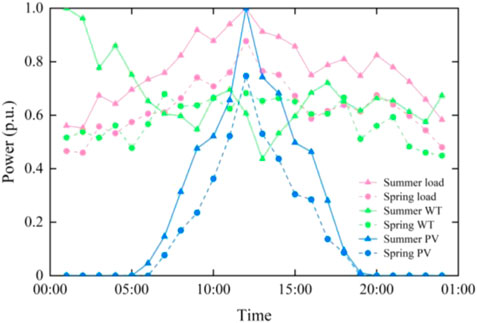
FIGURE 7. Curve of wind power, photovoltaic power and load under different disaster scenarios.
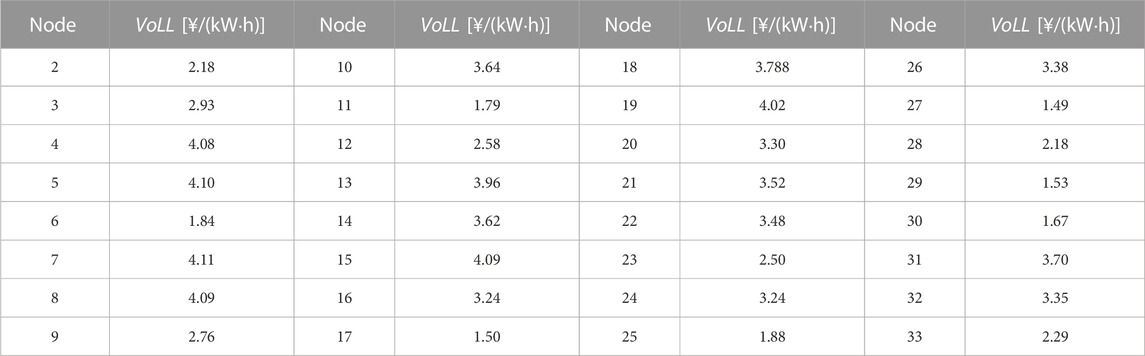
TABLE 2. Value of lost load of buses.
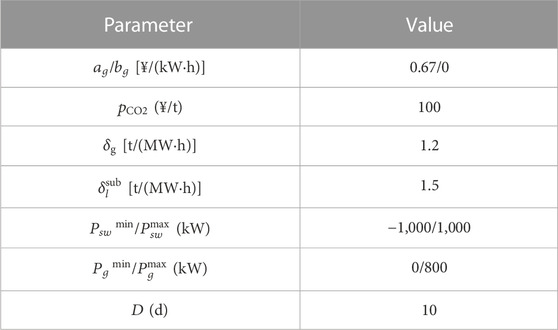
TABLE 3. Parameter settings.
6.2 Selection of worst-case fault scenario
In order to obtain the most severe line faults combination in the disaster scenario, traverse each line on the disaster path, set the line disconnected and calculate the RoLL value, and the results shown in Table 4 can be obtained. Set the disaster attack budget value

TABLE 4. RoLL of lines under different disaster scenarios.
6.3 Operation and allocation results under multi-scenario disasters
In order to verify the effectiveness of the model and disaster response measures proposed in this paper, five schemes are set up for comparison. The scheme settings are shown in Table 5. Set the disaster attack budget
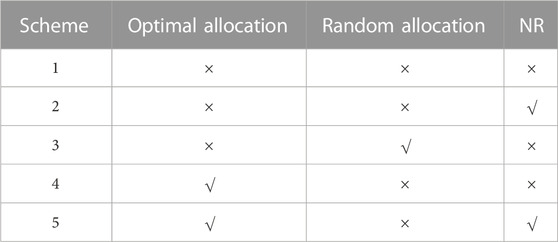
TABLE 5. Scheme settings.
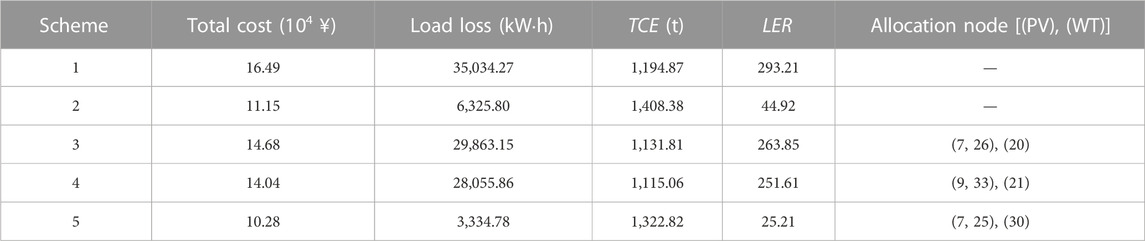
TABLE 6. Results under different schemes.
By comparing the results of the scheme 1 and scheme 2, it can be seen that by adopting the NR, the load loss caused by the distribution system failure under the disaster is reduced by 81.94%, and the total operation cost is reduced by 5.34 × 10⁴¥. This indicates that NR can effectively restore most of the power supply after a distribution system failure, ensuring power supply reliability. Due to the NR restoring a large amount of load, resulting in an increase in the output of carbon emission units, the carbon emissions in scheme 2 have significantly increased compared to scheme 1. From the LER value, it can be seen that scheme 2 is superior to scheme 1.
From the results of scheme 3 and scheme 4, it can be concluded that compared with scheme 1, after the allocation of PV unit and WT, the load loss under disasters is reduced by 5,171.12 and 6,978.41 kW·h respectively, and the total carbon emission is reduced by 5.28% and 6.68% respectively. This is due to the fact that the output of DRGs has restored the lost load in some load islands, and the total carbon emission has decreased due to the replacement of the output of MT and upstream power grid. This indicates that the allocation of DRGs in the pre-disaster prevention stage can effectively improve the load restoration capability and reduce the carbon emissions. Compared with the result under random allocation, the optimal allocation of DRGs can further reduce the load loss of 1,807.29 kW·h and the total carbon emission of 1.40% under disaster scenarios. The LER value of scheme 4 is less than that of scheme 3, and it can be concluded that the optimal allocation effect of scheme 4 is better than that of scheme 3.
As can be seen from Table 6, scheme 5 can significantly reduce the load loss caused by disasters and greatly reduce the total cost by optimizing the allocation of DRGs before disasters and adopting NR after disasters. Compared with operation scheme 2, scheme 5 further reduces the total carbon emissions. However, compared with schemes 3 and 4, the total carbon emissions increase. The reason is that NR leads to the restoration of power supply for a large number of loads, and the output of carbon emission units increases. According to the LER value, scheme 5 is the optimal scheme.
6.4 Effectiveness of NR
In order to demonstrate the effect of NR on restoring lost load, calculation and analysis are carried out under a single disaster scenario. Based on disaster scenario 1, the test is carried out under scheme 1 and scheme 2 respectively. The results are shown in Figure 8 and Table 7. Comparing Figures 8A, B, it can be seen that without NR, two load islands are generated in the distribution system due to line faults. Although the islands are equipped with corresponding black-start power supplies, due to the limited capacity of the unit, most nodes still have load loss, and the reliability of power supply is low. After adopting the network reconstruction method, the switches between the tie line 12–22 and 25–29 is closed, so that the entire distribution system maintains a radial complete connection state, avoiding the generation of load islands. In this case, the load loss of the entire power grid is reduced. Although due to the transmission capacity limit of tie lines, the lost load has not been fully restored, compared to the case where NR is not taken, the load loss has been reduced by 92.04%, and the fault restoration ability of the distribution system has been greatly improved. From the LER value, adopting NR can restore more power at a lower cost of carbon emissions.
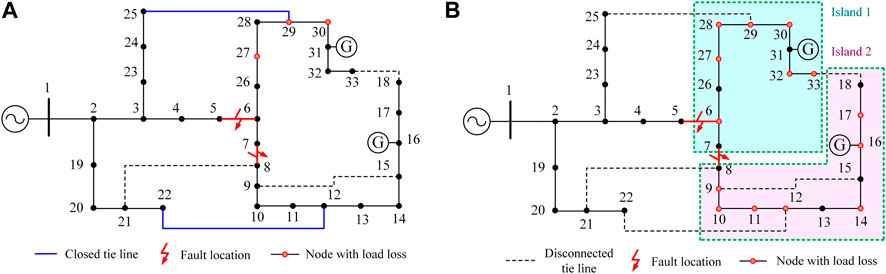
FIGURE 8. (A) Operation without NR; (B) Operation with NR.
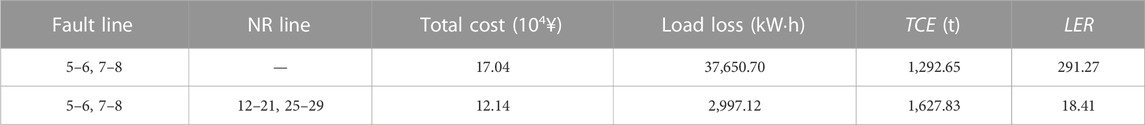
TABLE 7. Results in different case 1 and case 2 under disaster scenario 1.
6.5 Effectiveness of different allocation scheme
In order to compare the effects of different allocation schemes, the calculation under a single disaster scenario is performed based on disaster scenario 4, and the results under three different allocation schemes are obtained, as shown in Figure 9 and Table 8.

FIGURE 9. (A) Random allocation scheme 1; (B) Random allocation scheme 2; (C) Optimal allocation scheme.
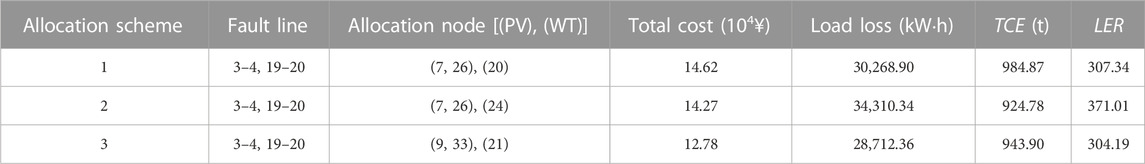
TABLE 8. Results under different allocation scheme.
As can be seen from Figure 9A, when allocation scheme 1 is adopted, there are four DGs in island 1 for load restoration. However, because there is only one power dividing point of node 7, the PV units located at node 7 and node 26 cannot deliver power to node 27 and its downstream nodes. In fact, the total load of nodes 31 and 32 at the end of the branch is heavy, and the VoLL of the load is large. Therefore, under this allocation scheme, the renewable energy is not fully utilized, and the important load is not sufficiently powered, resulting in more load loss and higher total carbon emissions.
In Figure 9B, compared with scheme 1, scheme 2 changes the allocation position of WT from node 20 to node 24. Because the output of WT is not blocked by the fault line, it can replace part of the output of the upstream power grid. From Table 8, it can be found that the total carbon emission under allocation scheme 2 is lower than that under allocation scheme 1. Although the change in the location of the WT has little impact on island 1, it has caused island 2 to lose the power source for restoration, leading to island 2 becoming a load island. The load loss of the scheme is greatly increased compared with the allocation scheme 1, and the LER value is the largest among the three schemes, which shows that the scheme is not desirable.
The optimal allocation scheme is adopted in Figure 9C, so that there are two power dividing points of node 7 and node 32 in different periods of a day in island 1. It can be seen from the figure that the scheme has more diverse power delivery paths than the first two allocation schemes. During periods when the load of nodes 31 and 32 is small, the PV unit located at node 33 can bypass node 32 to provide power supply to other loads, and at this time node 32 does not act as a power dividing point. When the load at the end of the branch is large, node 32 becomes a power dividing point, and is powered by the power supplies on both sides. This means that under this scheme, PV units are allocated more reasonably and the load power supply mode is more flexible. It can be seen from the results in Table 8 that the optimal allocation scheme has smaller load loss than the first two schemes, and its total carbon emissions are relatively low, and the LER value is the smallest, which is an ideal scheme.
6.6 Influence of disaster severity
For a given disaster response scheme, changes in disaster severity will lead to differences in disaster response effects. On the basis of scheme 5, the results under the multi-scenario disasters can be obtained by changing the disaster attack budget
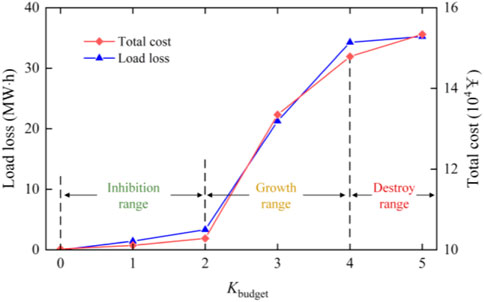
FIGURE 10. Load loss and total cost under different disaster severity.
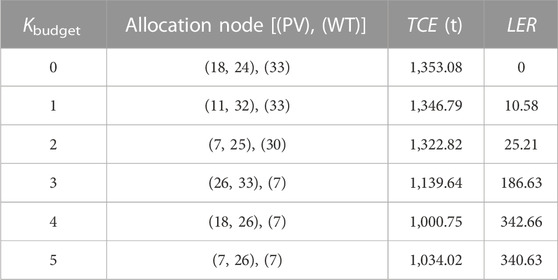
TABLE 9. Results under different placement scheme.
According to the impact of the severity of the disaster on the distribution system, it can be divided into three ranges. When
6.7 Influence of allocation budget
The allocation budget mainly includes the number and capacity of allocated units. On the basis of the scheme 5, taking the value of
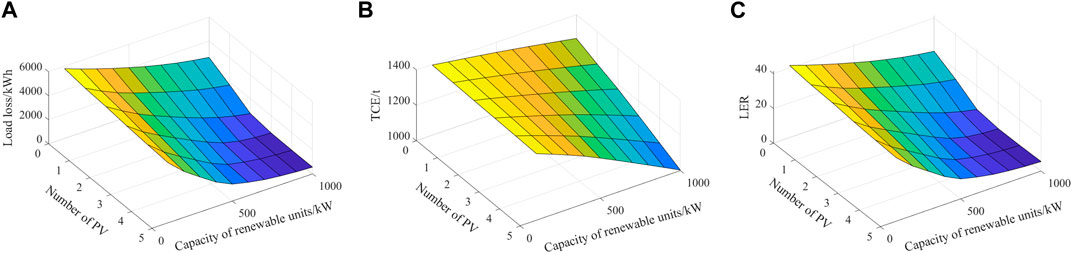
FIGURE 11. Influence of allocation budget on (A) Load loss; (B) TCE; (C) LER.
7 Conclusion
Natural disasters will not only lead to load loss caused by line faults in distribution systems, but also affect carbon emissions. In order to improve the load restoration capability of the distribution system under disasters and mitigate the additional carbon emissions during the load restoration process, this paper proposes a multi-scenario DAD model considering carbon emission based on the CPSSE framework. The model pre-allocates the DRG units before the disaster and implements NR after the disaster to restore the power supply of the distribution system. To describe the impact of disasters, this paper models the line fault probability under disasters, gives the fault constraints under disasters, and proposes a method for selecting the worst-case fault scenario. Finally, the PHA algorithm is adopted to solve the multi-scenario problem. Through the case analysis, the following conclusions can be drawn:
1) Natural disasters can cause a large amount of load losses in the distribution system. Adopting NR can avoid the generation of isolated islands, ensure the integrity of the distribution system topology, and reduce load loss by 92.04%.
2) The proposed optimal allocation model comprehensively considers the impact of disasters on load restoration and carbon emissions of the distribution system, and is suitable for multi-scenario disasters. It can improve the flexibility of load restoration in islands under disasters, and restore more lost load with less carbon emissions.
3) As the severity of disasters increases, the impact of disasters on distribution system can be divided into three ranges: inhibition range, growth range, and destroy range. When the disaster attack budget is greater than 2, existing disaster prevention and response measures will gradually lose their effectiveness.
4) With the increase of the allocation budget, the effect of the optimal allocation shows a diminishing marginal benefit. Therefore, the allocation effect and budget should be weighed simultaneously when making allocation decisions.
Due to space limitations, this paper only focuses on the impact of disasters on the distribution system, and has not considered the impact of disasters on carbon sinks. Future research will consider the changes of carbon emissions and carbon sinks in the transmission and distribution system under the impact of disasters simultaneously, and formulate more comprehensive disaster prevention and emission mitigation measures to better achieve carbon neutrality.
Data availability statement
The original contributions presented in the study are included in the article/supplementary material, further inquiries can be directed to the corresponding author.
Author contributions
WL: Methodology, software, validation, investigation, writing—original draft. JW: Conceptualization, supervision, writing—review and editing. DL: Conceptualization, supervision, data collection, writing—review and editing. YW: Validation, investigation, visualization. All authors contributed to the article and approved the submitted version.
Funding
This work was supported by the National Natural Science Foundation of China—Key Program of Joint Fund in Smart Grid (U2166210).
Conflict of interest
The authors declare that the research was conducted in the absence of any commercial or financial relationships that could be construed as a potential conflict of interest.
Publisher’s note
All claims expressed in this article are solely those of the authors and do not necessarily represent those of their affiliated organizations, or those of the publisher, the editors and the reviewers. Any product that may be evaluated in this article, or claim that may be made by its manufacturer, is not guaranteed or endorsed by the publisher.
References
Alguacil, N., Delgadillo, A., and Arroyo, J. (2014). A trilevel programming approach for electric grid defense planning. Comput. Oper. Res. 41, 282–290. doi:10.1016/j.cor.2013.06.009
Arif, A., Wang, Z., Chen, C., and Chen, B. (2020). A Stochastic Multi-commodity logistic model for disaster preparation in distribution systems. IEEE Trans. Smart Grid 11 (1), 565–576. doi:10.1109/TSG.2019.2925620
Balakrishnan, R., and Ranganathan, K. (2012). A textbook of graph theory. Berlin, Germany: Springer.
Barnes, A., Nagarajan, H., Yamangil, E., Bent, R., and Backhaus, S. (2019). Resilient design of large-scale distribution feeders with networked microgrids. Electr. Power Syst. Res. 171, 150–157. doi:10.1016/j.epsr.2019.02.012
Chen, C., Wang, J., and Ton, D. (2017). Modernizing distribution system restoration to achieve grid resiliency against extreme weather events: An integrated solution. Proc. IEEE 105 (7), 1267–1288. doi:10.1109/JPROC.2017.2684780
Ding, T., Lin, Y., Bie, Z., and Chen, C. (2017a). A resilient microgrid formation strategy for load restoration considering master-slave distributed generators and topology reconfiguration. Appl. Energy 199, 205–216. doi:10.1016/j.apenergy.2017.05.012
Ding, T., Lin, Y., Li, G., and Bie, Z. (2017b). A new model for resilient distribution systems by microgrids formation. IEEE Trans. Power Syst. 32 (5), 4145–4147. doi:10.1109/TPWRS.2017.2650779
Dou, Y., Shahbaz, M., Dong, K., and Dong, X. (2022). How natural disasters affect carbon emissions: The global case. Nat. Hazards 113 (3), 1875–1901. doi:10.1007/s11069-022-05374-z
Du, Y., Tu, H., Lu, X., Wang, J., and Lukic, S. (2022). Black-start and service restoration in resilient distribution systems with dynamic microgrids. IEEE J. Emerg. Sel. Top. Power Electron. 10 (4), 3975–3986. doi:10.1109/JESTPE.2021.3071765
Fernández-Guillamón, A., Gómez-Lázaro, E., Muljadi, E., and Molina-Garcia, A. (2019). Power systems with high renewable energy sources: A review of inertia and frequency control strategies over time. Renew. Sustain. Energy Rev. 115, 109369. doi:10.1016/j.rser.2019.109369
Gan, W., Shahidehpour, M., Guo, J., Yao, W., Pandey, S., Paaso, A., et al. (2022). A tri-level planning approach to resilient expansion and hardening of coupled power distribution and transportation systems. IEEE Trans. Power Syst. 37 (2), 1495–1507. doi:10.1109/TPWRS.2021.3107402
Ghasemi, M., Kazemi, A., Gilani, M., and Shafie-Khah, M. (2021). A stochastic planning model for improving resilience of distribution system considering master-slave distributed generators and network reconfiguration. IEEE Access 9, 78859–78872. doi:10.1109/ACCESS.2021.3083698
Hafiz, F., Chen, B., Chen, C., de Queiroz, A., and Husain, I. (2019). Utilising demand response for distribution service restoration to achieve grid resiliency against natural disasters. IET Gener. Transm. Distrib. 13 (14), 2942–2950. doi:10.1049/iet-gtd.2018.6866
Hao, L., Xue, Y., Li, Z., Wang, H., and Xu, Q. (2022). Decision support system for adaptive restoration control of distribution system. J. Mod. Power Syst. Clean. Energy 10 (5), 1256–1273. doi:10.35833/MPCE.2021.000528
IPCC (2019). IPCC special report: Global warming of 1.5 °C. Avialable at: https://www.ipcc.ch/sr15/.
Jiang, L., Hu, X., Zhang, G., Chen, Y., Zhong, H., and Shi, P. (2022). Carbon emission risk and governance. Int. J. Disaster Risk Sci. 13 (2), 249–260. doi:10.1007/s13753-022-00411-8
Khomami, M., and Sepasian, M. (2018). Pre-hurricane optimal placement model of repair teams to improve distribution network resilience. Electr. Power Syst. Res. 165, 1–8. doi:10.1016/j.epsr.2018.08.016
Lavorato, M., Franco, J., Rider, M., and Romero, R. (2012). Imposing radiality constraints in distribution system optimization problems. IEEE Trans. Power Syst. 27 (1), 172–180. doi:10.1109/TPWRS.2011.2161349
Lei, S., Wang, J., Chen, C., and Hou, Y. (2018). Mobile emergency generator pre-positioning and real-time allocation for resilient response to natural disasters. IEEE Trans. Smart Grid 9 (3), 1–2041. doi:10.1109/TSG.2016.2605692
Li, B., Chen, Y., Wei, W., Huang, S., and Mei, S. (2021). Resilient restoration of distribution systems in coordination with electric bus scheduling. IEEE Trans. Smart Grid 12 (4), 3314–3325. doi:10.1109/TSG.2021.3060801
Li, G., Zhang, P., Luh, P. B., Li, W., Bie, Z., Serna, C., et al. (2014). Risk analysis for distribution systems in the northeast U.S. under wind storms. IEEE Trans. Power Syst. 29 (2), 889–898. doi:10.1109/TPWRS.2013.2286171
Lin, Z., and Bie, Z. (2018). Tri-level optimal hardening plan for a resilient distribution system considering reconfiguration and DG islanding. Appl. Energy 210, 1266–1279. doi:10.1016/j.apenergy.2017.06.059
Ma, S., Chen, B., and Wang, Z. (2018). Resilience enhancement strategy for distribution systems under extreme weather events. IEEE Trans. Smart Grid 9 (2), 1442–1451. doi:10.1109/TSG.2016.2591885
Mulej, M. (2007). Systems theory: A worldview and/or a methodology aimed at requisite holism/realism of humans' thinking, decisions and action. Syst. Res. Behav. Sci. 24 (3), 347–357. doi:10.1002/sres.810
Nikkhah, S., Jalilpoor, K., Kianmehr, E., and Gharehpetian, G. (2018). Optimal wind turbine allocation and network reconfiguration for enhancing resiliency of system after major faults caused by natural disaster considering uncertainty. IET Renew. Power Gener. 12 (12), 1413–1423. doi:10.1049/iet-rpg.2018.5237
Panteli, M., Mancarella, P., Trakas, D., Kyriakides, E., and Hatziargyriou, N. (2017). Metrics and quantification of operational and infrastructure resilience in power systems. IEEE Trans. Power Syst. 32 (6), 4732–4742. doi:10.1109/TPWRS.2017.2664141
Rockafellar, R., and Wets, R. (1991). Scenarios and policy aggregation in optimization under uncertainty. Math. Oper. Res. 16 (1), 119–147. doi:10.1287/moor.16.1.119
Shen, F., Wu, Q., and Xue, Y. (2020). Review of service restoration for distribution networks. J. Mod. Power Syst. Clean. Energy 8 (1), 1–14. doi:10.35833/MPCE.2018.000782
Sun, X., Chen, J., Zhao, H., Zhang, Wen., and Zhang, Y. (2023). Sequential disaster recovery strategy for resilient distribution network based on cyber-physical collaborative optimization. IEEE Trans. Smart Grid 14 (2), 1173–1187. doi:10.1109/TSG.2022.3198696
Wang, X., Li, Z., Shahidehpour, M., and Jiang, C. (2019b). Robust line hardening strategies for improving the resilience of distribution systems with variable renewable resources. IEEE Trans. Sustain. Energy 10 (1), 386–395. doi:10.1109/TSTE.2017.2788041
Wang, X., Shahidehpour, M., Jiang, C., and Li, Z. (2019a). Resilience enhancement strategies for power distribution network coupled with urban transportation system. IEEE Trans. Smart Grid 10 (4), 4068–4079. doi:10.1109/TSG.2018.2848970
Wang, Y., Chen, C., Wang, J., and Baldick, R. (2016). Research on resilience of power systems under natural disasters—A review. IEEE Trans. Power Syst. 31 (2), 1604–1613. doi:10.1109/TPWRS.2015.2429656
Watson, J. P., and Woodruff, D. L. (2011). Progressive hedging innovations for a class of stochastic mixed-integer resource allocation problems. Comput. Manag. Sci. 8 (4), 355–370. doi:10.1007/s10287-010-0125-4
Wen, Y., Cai, B., Yang, X., and Xue, Y. (2020). Quantitative analysis of China's low-carbon energy transition. Int. J. Electr. Power Energy Syst. 119, 105854. doi:10.1016/j.ijepes.2020.105854
Wu, X., Wang, Z., Ding, T., Wang, X., Li, Z., and Li, F. (2019). Microgrid planning considering the resilience against contingencies. IET Gener. Transm. Distrib. 13 (16), 3534–3548. doi:10.1049/iet-gtd.2018.6816
Xue, Y., Wu, Y., Xie, Y., Wen, F., Dong, Z., Zhao, J., et al. (2013). Extension of blackout defense scheme to natural disasters early-warning. Automation Electr. Power Syst. 37 (16), 18–26. (in Chinese). doi:10.7500/AEPS20130606010
Xue, Y., and Yu, X. (2017). Beyond smart grid—Cyber–physical–social system in energy future [point of view]. Proc. IEEE 105 (12), 2290–2292. doi:10.1109/JPROC.2017.2768698
Yao, S., Wang, P., and Zhao, T. (2019). Transportable energy storage for more resilient distribution systems with multiple microgrids. IEEE Trans. Smart Grid 10 (3), 3331–3341. doi:10.1109/TSG.2018.2824820
Yu, X., and Xue, Y. (2016). Smart grids: A cyber–physical systems perspective:a cyber-physical systems perspective. Proc. IEEE 104 (5), 1058–1070. doi:10.1109/JPROC.2015.2503119
Yuan, W., Wang, J., Qiu, F., Chen, C., Kang, C., and Zeng, B. (2016). Robust optimization-based resilient distribution network planning against natural disasters. IEEE Trans. Smart Grid 7 (6), 2817–2826. doi:10.1109/TSG.2015.2513048
Zhang, G., Zhang, F., Zhang, X., Wu, Q., and Meng, K. (2020b). A multi-disaster-scenario distributionally robust planning model for enhancing the resilience of distribution systems. Int. J. Electr. Power Energy Syst. 122, 106161. doi:10.1016/j.ijepes.2020.106161
Zhang, G., Zhang, G., Zhang, X., Meng, K., and Dong, Z. (2020a). Sequential disaster recovery model for distribution systems with co-optimization of maintenance and restoration crew dispatch. IEEE Trans. Smart Grid 11 (6), 4700–4713. doi:10.1109/TSG.2020.2994111
Zhang, J., Wang, Y., Chang, K., Xue, F., and Xue, Y. (2022). Bayesian network modeling for new power system carbon emission with natural disaster chain and carbon change estimation. Proceedings of the 7th PURPLE MOUNTAIN FORUM on Smart Grid Protection and Control (PMF2022). PMF 2022. Singapore: Springer. doi:10.1007/978-981-99-0063-3_31
Zhang, L., Wang, C., Liang, J., Wu, M., Zhang, B., and Tang, W. (2023). A coordinated restoration method of hybrid AC/DC distribution network for resilience enhancement. IEEE Trans. Smart Grid 14 (1), 112–125. doi:10.1109/TSG.2022.3192910
Keywords: distribution system, natural disaster, carbon emission, optimal allocation, network reconfiguration
Citation: Liao W, Weng J, Liu D and Wu Y (2023) Optimal allocation of distributed renewable generations in low-carbon distribution system considering impact of natural disasters. Front. Energy Res. 11:1202054. doi: 10.3389/fenrg.2023.1202054
Received: 07 April 2023; Accepted: 02 June 2023;
Published: 13 June 2023.
Edited by:
Mingfei Ban, Northeast Forestry University, ChinaReviewed by:
Yu Chen, Shandong University of Technology, ChinaWang Yufei, State Grid Smart Grid Research Institute, China
Copyright © 2023 Liao, Weng, Liu and Wu. This is an open-access article distributed under the terms of the Creative Commons Attribution License (CC BY). The use, distribution or reproduction in other forums is permitted, provided the original author(s) and the copyright owner(s) are credited and that the original publication in this journal is cited, in accordance with accepted academic practice. No use, distribution or reproduction is permitted which does not comply with these terms.
*Correspondence: Jiaming Weng, d3J6eF81QHNqdHUuZWR1LmNu