 Keguang Yao
 Tiehan Long3
 Yao Yao
- 1School of Materials Science and Engineering, Harbin Institute of Technology, Harbin, Heilongjiang, China
- 2Department of Mechanical and Energy Engineering, Southern University of Science and Technology, Shenzhen, Guangdong, China
- 3China Academy of Aerospace Aerodynamics, Beijing, China
- 4School of Electrical Engineering, University of South China, Hengyang, China
- 5Energy, Mining and Environment Research Center, National Research Council Canada, Vancouver, BC, Canada
- 6Key Laboratory of Energy Conversion and Storage Technologies, Southern University of Science and Technology, Shenzhen, China
Accurately predicting oxygen mass transport resistance and current distribution in fuel cells requires significant knowledge of oxygen diffusion coefficients in both in-plane and through-plane directions. However, there are few methods for measuring in-plane oxygen diffusion coefficients, which are important parameters for simulating oxygen flux distribution in gas diffusion layers (GDLs). In this study, we establish measurement methods and calculations for both in-plane and through-plane oxygen diffusion coefficients. Using in-house designed cells, we measure the in-plane and through-plane oxygen apparent diffusion coefficients of a commercial carbon paper (AvCarb EP40) at various torques and gas flow rates. We also simulate oxygen flux distributions in the GDL under each torque and gas flow rate. Our results show that the channel part is the major contributor to total oxygen flux at high torque conditions and that an increase in torque leads to a decrease in the contribution from the land part. Simulation results also suggest that a higher gas flow rate and lower torque contribute to a more uniform distribution of oxygen flux in the GDL.
1 Introduction
Proton exchange membrane fuel cell (PEMFC) is an attractive technology for converting the chemical energy of hydrogen to electricity, offering advantages such as zero toxic gas and CO2 emissions, high energy efficiency, and compatibility with alternative/renewable energy sources (Curtin et al., 2004). However, further cost reduction and performance improvement are necessary for commercial applications. One promising approach is to increase the operating current density, typically higher than 2 A/cm2 (Ahmed and Sung, 2006; Chan et al., 2012; Ozden et al., 2019). However, under such high current density conditions, reactant mass transport and water flooding in the gas diffusion layer (GDL) become major limitations. The GDL, usually made of carbon paper or carbon cloth and treated with a hydrophobic agent such as polytetrafluoroethylene (PTFE), is a sub-component of the membrane electrode assembly (MEA) in PEMFC. It serves as a link between the flow field and catalyst layer (Omrani and Shabani, 2019; Ozden et al., 2019) and serves multiple functions, including electrical contact, heat conduction, structural support, water management, and uniform gas distribution (Williams et al., 2004; Dai et al., 2008).
The apparent diffusion coefficient is a crucial parameter for evaluating how quickly gas or vapor products/reactants can pass through the porous structure of the GDL. Its apparent diffusion coefficient plays an essential role in assessing gas mass transport at high current densities. In PEMFCs, the relatively low diffusivity of oxygen than that of hydrogen is the primary limitation at high current density conditions (Ozden et al., 2019). Hence, accurate measurement of the apparent diffusion coefficient, particularly the oxygen apparent diffusion coefficient in the GDL, is critical for predicting mass transport resistance in fuel cells and enabling more precise simulations of PEMFCs.
Previous studies have employed in situ limiting current techniques (Williams et al., 2004; Stumper et al., 2005; Baker et al., 2006) in PEMFCs or ex situ techniques (Rohling et al., 2007; Astrath et al., 2009; Zamel et al., 2010; Shen et al., 2011; Chan et al., 2012) involving a Loschmidt cell to measure the oxygen diffusion coefficient. The in situ limiting current technique is a simple and rapid method for measuring the average mass transport resistance in PEMFCs which determines the relationship between the measured limiting current and the oxygen effective diffusion coefficient in the cathode. Using this technique, Beuscher (2006) found that the gas diffusion media in PEMFCs contribute only 26% to the total mass transport resistance, with Knudsen diffusion and film diffusion through ionomer and water film constituting the majority of the mass transport resistance.
Loschmidt cells are widely employed as an ex situ technique for measuring the GDL gas diffusion coefficient. Chan et al. (2012) used a modified Loschmidt cell to study the impact of the microporous layer (MPL) on the oxygen diffusion coefficient in the GDL. They discovered that the effective diffusion coefficient of the MPL accounts for only 21% of that of the GDL substrate, with Knudsen diffusion representing the majority of diffusion in the MPL. Furthermore, Zamel et al. (2010) employed experimental measurements in a Loschmidt cell to demonstrate that the existing theoretical models overpredicted the effective diffusion coefficient about four- to fivefold, leading to an underestimation of the mass transport limitation. Additionally, studies have explored the effects of relative humidity (Astrath et al., 2009), PTFE content (Fluckiger et al., 2008), compression (Kramer et al., 2008; LaManna and Kandlikar, 2011; Rashapov et al., 2015; Khetabi et al., 2019), and thickness (LaManna and Kandlikar, 2011) on the effective diffusion coefficient.
This study establishes methods for measuring both the in-plane and through-plane oxygen apparent diffusion coefficients, while taking into account the impact of gas flow rates and torques—closer to the real conditions experienced by fuel cells than the pure diffusion usually studied. Furthermore, we also simulate the effects of gas flow rates and torques on the oxygen concentration distribution in the GDL.
2 Experimental setup
The cathode of a fuel cell comprises the bipolar plate, gas diffusion layer (GDL), and catalyst layer (Scheme 1). The land and channel are both essential parts of the bipolar plate, serving to conduct the current and distribute the reactant gas, respectively. Consequently, the GDL in the cathode can be divided into two parts, namely, the channel and the land parts, located on the channel and land of the bipolar plate, respectively. The GDL’s main function is to ensure the uniform distribution of gas reactants to the catalyst layer. In the channel part, oxygen gas diffuses through the GDL to reach the catalyst layer. However, in the land area, both in-plane and through-plane diffusion affect oxygen distribution in the GDL.

SCHEME 1. Configuration of bipolar plate, gas diffusion layer, and catalyst layer in the PEMFC cathode.
The relationship between the reactant gas flux and the gas diffusion coefficient can be obtained according to Fick’s First Law (Eq. 1), noting that jflux is the flux of the reactant gas, D is the gas apparent diffusion coefficient, dc is the change in concentration, and dx is the change in distance.
2.1 Experimental apparatus for in-plane apparent diffusion coefficient measurements
To measure the in-plane diffusion coefficient, we designed a diffusion cell (Scheme 2A and Scheme 2B). The cell comprises two chambers, A and B, separated by a carbon paper (AvCarb EP40) GDL with a width of 10 mm. Each chamber has a length of 92 mm and a depth of 8 mm. To control the gas flow rates, nitrogen and oxygen mass flow controllers (Qixinghuachuang, CS200) are connected to the inlet valves (valves 1 and 3). Valves 2 and 4 serve as gas outlets. Oxygen concentration changes in the chambers are measured using oxygen mini-sensors (PyroScience, OXF500PT) connected to an oxygen meter (PyroScience, FSO2-4). The sensors are placed in the middle of the edge of chambers A and B, as shown in Scheme 2A and Scheme 2B.
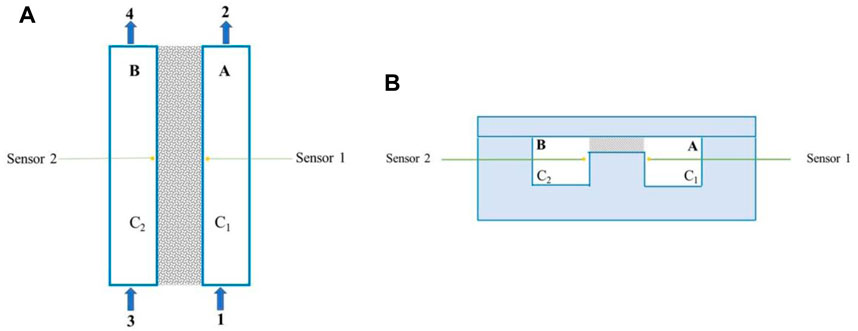
SCHEME 2. (A) Top view and (B) cross-sectional view of the schematic diagram of the diffusion cell for in-plane oxygen apparent diffusion efficiency measurements (gray area is the GDL).
Before conducting the measurements, nitrogen gas is flowed into chambers A and B at a rate of 200 ccm for 30 min via valves 1 and 3 to remove oxygen from the setup, until the oxygen meter reading approaches 0. Valves 3 and 4 are then closed, and a mixture of nitrogen and oxygen (1:1) is introduced into Chamber A through Valve 1 at varying total flow rates (200–2000 ccm). Simultaneously, oxygen mini-sensors 1 and 2 record the readings, producing the C-t curves depicted in Figure 1A. In this case, the increase in the amount of O2 in Chamber B is equal to the amount flowing through the GDL, as indicated in Eq. 2, where VB is the volume of Chamber B, L is the width of the land, A is the sectional area of the GDL during the test, DH, apparent is the in-plane oxygen apparent diffusion coefficient at a constant gas flow rate, and C1 and C2 represent the oxygen concentrations in Chambers A and B, respectively.
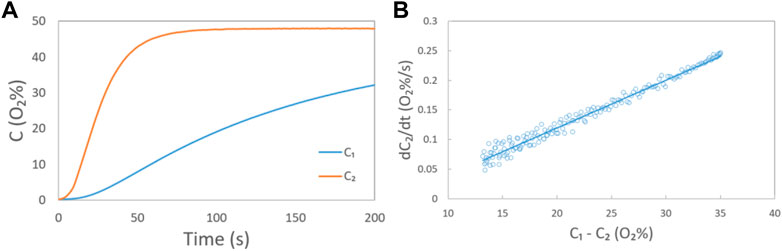
FIGURE 1. (A) Oxygen concentration in chambers A and B in Scheme 2 measured by oxygen sensors 1 and 2, respectively, at a gas mixture (O2: N2 = 1:1) flow rate of 200 ccm. In this case, chambers A and B are separated by a slit filled with nitrogen (width: 10 mm, depth: 0.3 mm); (B) relationship between dC2/dt and C1-C2 at each moment (circle) and the corresponding fitted line (solid line) at a gas flow rate of 200 ccm.
By combining the C-t curves and Eq. 2, the relationship between dC2/dt and C1-C2 at each moment could be collected, as shown in Figure 1B. Then, the in-plane oxygen apparent diffusion coefficient (DH, apparent) under a constant flow rate can be calculated with the known values of the slope of the fitting line, section area A, and the volume of Chamber B, based on Eq. 2.
2.2 Experimental apparatus for through-plane diffusion coefficient measurements
Scheme 3A and Scheme 3B show the setup used to measure the through-plane apparent diffusion coefficient of oxygen. The diffusion cell consisted of chambers A and B separated by a GDL made of AvCarb EP40 carbon paper with a width of 10 mm. The gas flow rates were controlled by oxygen and nitrogen mass flow controllers (Qixinghuachuang, CS200) connected to the inlet (valves 1 and 3). The gas outlets were valves 2 and 4. Oxygen mini-sensors (PyroScience, OXF500PT) were placed in chambers A and B and connected to an oxygen meter (PyroScience, FSO2-4) to measure the oxygen concentration change in the chambers. The distance between the tips of oxygen sensors 1 and 2 was 5.21 mm.
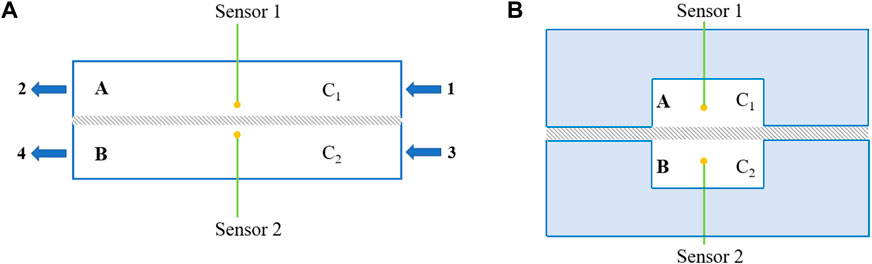
SCHEME 3. (A) Side view and (B) cross-sectional view of the schematic diagram of the diffusion cell for oxygen through-plane apparent diffusion efficiency measurements (gray area is the GDL).
Like the measurement of the oxygen in-plane apparent diffusion coefficient, the setup was purged with nitrogen gas flowing in Chambers A and B at a rate of 200 ccm for 30 min through Valves 1 and 3 to remove oxygen before the measurements. The oxygen meter reading was closely monitored and stabilized at 0. Once stabilized, gas outlet Valves 3 and 4 were closed, and a mixture of nitrogen and oxygen (1:1) flowed into Chamber A through Valve 1 at various flow rates (200–2,000 ccm). Oxygen mini-sensors 1 and 2 were used to simultaneously record the C-t curves (Figure 2A). Both the impact of in-plane and through-plane diffusion coexist in Scheme 3. However, considering that the concentration difference in the in-plane direction is negligible for the high gas flow rates (200–2000 ccm) in this direction, the impact of in-plane diffusion is neglected here. In this case, the increase in the amount of O2 in Chamber B was equal to the amount flowing through the GDL, as demonstrated by Eq. 3, where VB (5.6 cm3) represents the volume of Chamber B, L (0.521 cm) represents the distance between oxygen mini-sensors 1 and 2, A (8 cm2) represents the sectional area of the GDL during the test, DV, apparent represents the apparent oxygen through-plane diffusion coefficient, and C1 and C2 represent the oxygen concentrations in Chambers A and B, respectively.
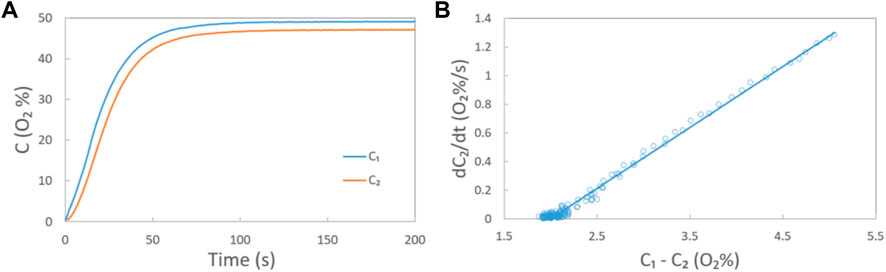
FIGURE 2. (A) Oxygen concentration in chambers A and B in Scheme 3 measured by oxygen sensors 1 and 2, respectively, at a gas mixture (O2: N2 = 1:1) flow rate of 200 ccm. In this case, chambers A and B are separated by a carbon paper GDL (AvCarb EP40); (B) relationship between dC2/dt and C1-C2 at each moment (circle) and the corresponding fitted (solid) line during the oxygen through-plane apparent diffusion coefficient measurements.
By combining the C-t curves in Figure 2A and Eq. 3, the relationship between dC2/dt and C1-C2 at each moment could be recorded (Figure 2B). Then, the apparent oxygen through-plane diffusion coefficient DV, apparent under each gas flow rate could be calculated with known values of the slope of the fitting line, the section area A, and the volume of Chamber B, based on Eq. 3.
3 Results and discussion
To validate the measurements and the calculation, the oxygen apparent diffusion coefficient in nitrogen gas was measured with the diffusion cell shown in Scheme 2A and Scheme 2B, where chambers A and B are separated by a slit filled with nitrogen (width: 10 mm, depth: 0.3 mm). Figures 3A,B show the oxygen concentration (C1 and C2) in Chambers A and B at various gas flow rates, respectively. The linear relationship between dC2/dt and C1-C2 at various inlet gas flow rates is given in Figure 3C. Based on Eq. 2 and Figure 3C, the slope of dC2/dt and C1-C2 which is the value of DH×A/VB at various flow rates could be calculated. The result is given in Figure 3D, as well as the fitted line with an expression of y = a×x4+b×x3+c×x2+d×x + e. The values of a, b, c, d, and e are −2 × 10-15, 1 × 10⁻¹¹, −4 × 10⁻⁹, 4 × 10⁻⁶, and 0.00746, respectively. At a flow rate of 0, the value of DH×A/VB is 0.00746, where VB is 7.36 cm3, L is 1 cm, and A is 0.27 cm2. Based on Eq. 2, DH could be calculated as 0.203 cm2/s, very close to that of DN2-O2 (0.208 cm2/s) (Marrero and Mason, 1972), indicating that the measurement and the calculation in this work are reliable.
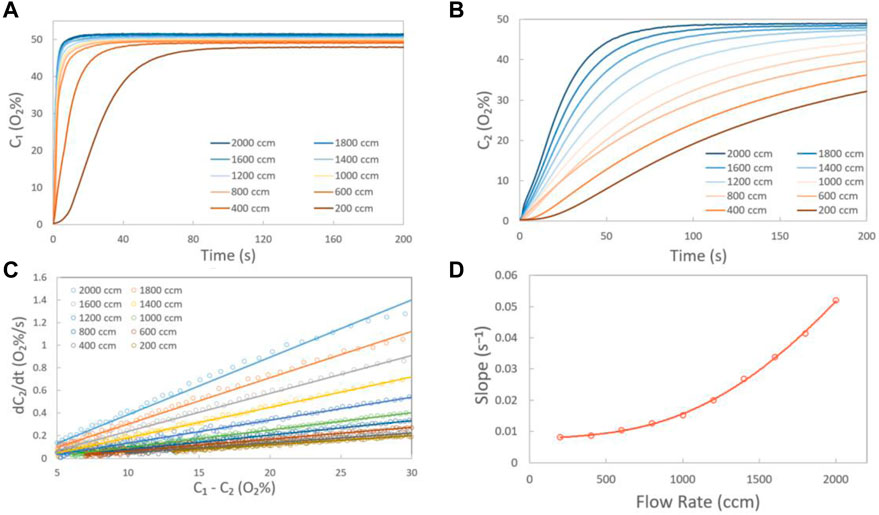
FIGURE 3. Oxygen concentrations in chambers A (A) and B (B) at various gas mixture (O2: N2 = 1:1) flow rates; (C) measured data (circle) at various gas flow rates and the corresponding fitting (solid) lines by Eq. 2; (D) value of the slope under various flow rates (circle) and the fitted (solid) line. In this case, chambers A and B of the diffusion cell for in-plane oxygen diffusion efficiency measurement are separated by a slit filled with nitrogen (width: 10 mm, depth: 0.3 mm).
Figure 4A presents the measured data and corresponding fitting lines obtained using Eq. 2 at a torque of 2 Nm under various gas flow rates. The corresponding in-plane oxygen apparent diffusion coefficients were calculated by collecting the slopes of the fitting lines and using Eq. 2, where VB is 7.36 cm3, L is 1 cm, and A is 0.1945 cm2. The in-plane oxygen apparent diffusion coefficients for each condition are listed in Table 1. Similar measurements and fitting were performed under torques of 3 Nm, 4 Nm, 5 Nm, and 6 Nm (Figure 4B). The results indicate that increasing the torque leads to a decrease in the in-plane oxygen diffusion coefficient, particularly due to a decrease in porosity.
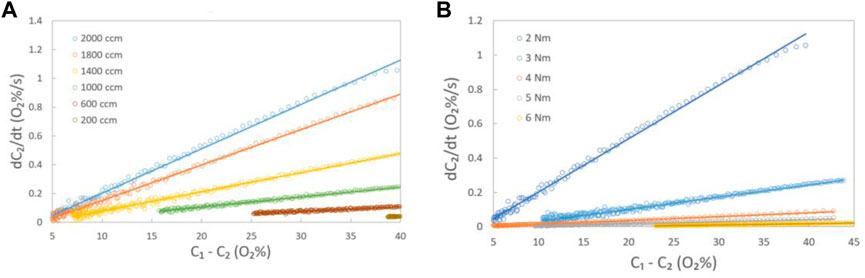
FIGURE 4. (A)Measured data (circle) at various gas flow rates and the corresponding fitting (solid) lines by Eq. 2 at a torque of 2 Nm; (B) Measured data (circle) at a gas flow rate of 2,000 ccm and the corresponding fitting (solid) lines by Eq. 2 at various torques in the in-plane diffusion cell.
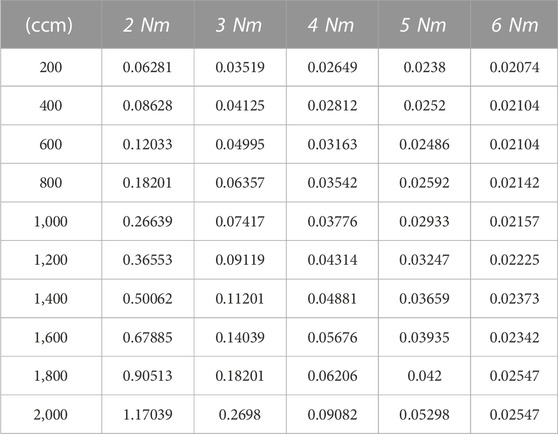
TABLE 1. Value of DH, apparent under each test condition (Unit: cm2/s).
The oxygen through-plane apparent diffusion coefficient of the carbon paper was measured using a through-plane diffusion cell. Figure 5 shows the measured data and the corresponding fitting line using Eq. (3) at various flow rates. The through-plane oxygen diffusion coefficient was calculated based on the slope of the fitting line in Figure 5 and Eq. 3, where VB is 5.6 cm3 and A is 8 cm2. The through-plane oxygen diffusion coefficients (DV, apparent) of the carbon paper under various gas flow rates were calculated using Eq. (4); these are impacted by both the oxygen diffusion in nitrogen (L = 0.5 cm) and the oxygen through-plane diffusion in carbon paper (L = 0.021 cm), and are given in Table 2.
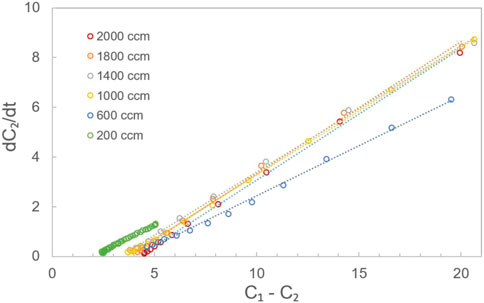
FIGURE 5. Measured data (scatter) and the corresponding fitting (dotted) lines by Eq. 3 at flow rates of 2,000, 1,800, 1,400, 1,000, 600, and 200 ccm.
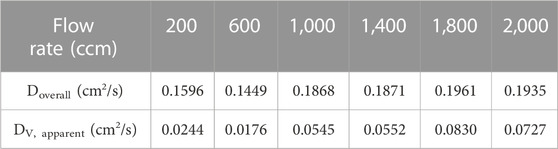
TABLE 2. Value of Dtotal and DV, apparent at each test condition.
3.1 Numerical simulations
To further investigate the influence of DV, apparent and DH, apparent on the oxygen distribution in GDL, the oxygen diffusion process is numerically simulated. The governing equation of the oxygen diffusion process without convection is
In which x denotes the in-plane direction, y denotes the through-plane direction, and c is local oxygen concentration at the location (x, y). In an equilibrium state, the oxygen concentration c does not change with time. Thus, Eq. 5 can be expressed as
Eq. (6) is discretized with the five-point central difference scheme. The simulation region is plotted schematically in Figure 6A. On the surface of the catalyst layer, the chemical reaction rate is assumed to be oxygen mass transfer limited, and the boundary condition is thus c = 0. The boundary condition is ∂c/∂y = 0 on the land surface and c = 1 in the channel. The periodic boundary condition is adopted at the left and right boundaries of the simulation region.

FIGURE 6. (A) Schematic representation of the numerical simulation region. (B) Distributions of oxygen concentration along the in-plane middle line on grids 1 and 2.
A total of 11 cases were conducted to present the distribution of oxygen concentration. The corresponding numerical conditions are listed in Table 3. Considering that both the porosity and the thickness of GDL in the land part would be impacted by the torques, the accurate measurements of the Dv, apparent of the GDL in the land part would be very complex. Here, we simply assume that the Dv, apparent and the thickness of GDL in the land part are not impacted by the torques as cases 7–11 in Table 2 show. Grid 1 (401 × 85) with a space interval of 0.0025 mm and grid 2 (801 × 169) with a space interval of 0.00125 mm are adopted simultaneously for case 1. Distributions of oxygen concentration along the in-plane middle line (from x = 0 to x = 1 mm at y = 0.125 mm) are plotted in Figure 6B. The discrepancy between the results of grids 1 and 2 is less than 1%. Therefore, the numerical simulation result is grid-independent and grid 1 is adopted for numerical simulations in all cases to reduce computation consumption.
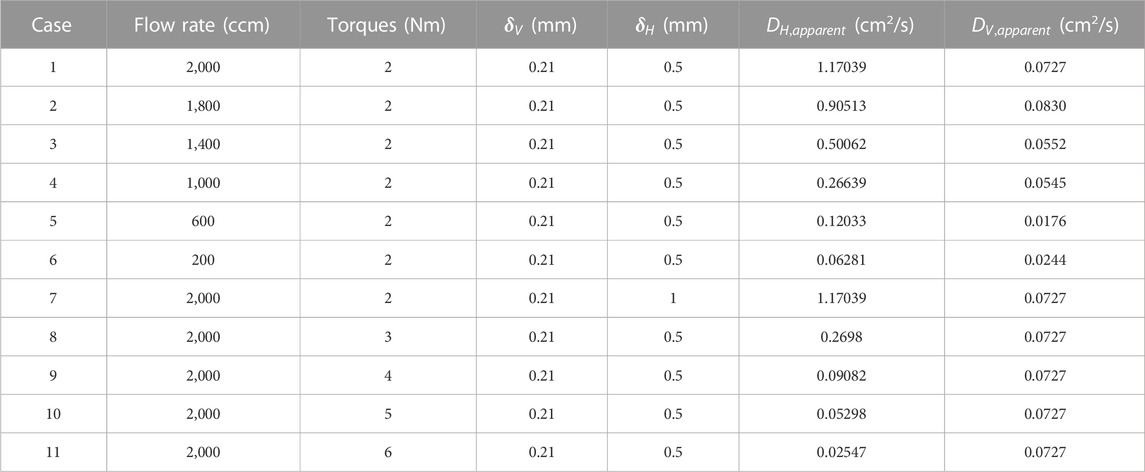
TABLE 3. Numerical conditions.
3.2 Numerical simulation results and discussion
Figure 7 shows the simulation results under various gas flow rates in a GDL unit with δc = 0.5 mm and δL = 0.5 mm, respectively. As the gas flow rates decrease, the diffusion of oxygen in the land part becomes more challenging, resulting in a reduction of the amount of oxygen amount in this area. Figure 8 shows the simulation results under various torques with δc = 0.5 mm. As the torque increases, the diffusion of oxygen in the land part of the GDL becomes increasingly difficult.
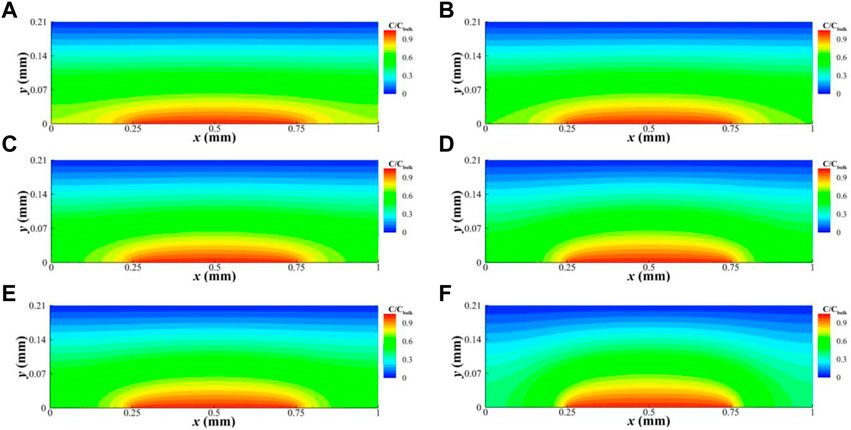
FIGURE 7. Oxygen concentration distribution in the GDL at torques of 2 Nm and a gas flow rate of 2,000 ccm (A), 1800 ccm (B), 1,400 ccm (C), 1,000 ccm (D), 600 ccm (E), and 200 ccm (F) when land and channel widths are 0.5 mm.
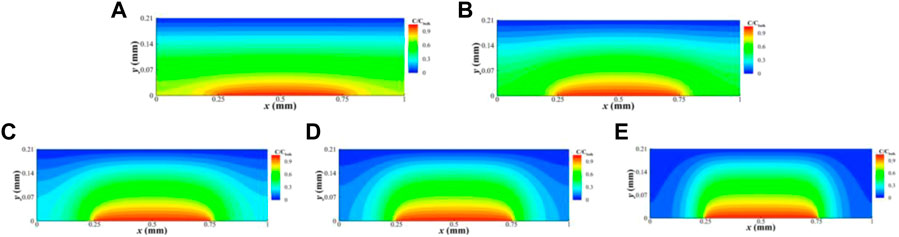
FIGURE 8. Oxygen concentration distribution in the GDL at a gas flow rate of 2000 ccm and torques of 2 Nm (A), 3 Nm (B), 4 Nm (C), 5 Nm (D), and 6 Nm (E) when land and channel widths are 0.5 mm.
Figure 9 displays the distribution of the oxygen flux ratio (j/Cbulk) at the interface between GDL and catalyst layer under a gas flow rate of 2,000 ccm. This ratio is linearly related to the limiting current for oxygen reduction, without accounting for the gas diffusion resistance in other compartments of PEMFC. At a torque of 2 Nm, there is no significant difference in the oxygen distribution between the land and channel parts. However, as the torque increases from 2 to 6 Nm, the oxygen distribution in the land part decreases significantly. This suggests that smaller torques promote a more uniform distribution of oxygen in the GDL, as well as the current distribution in the PEMFC, without considering the influence on the contact resistance.
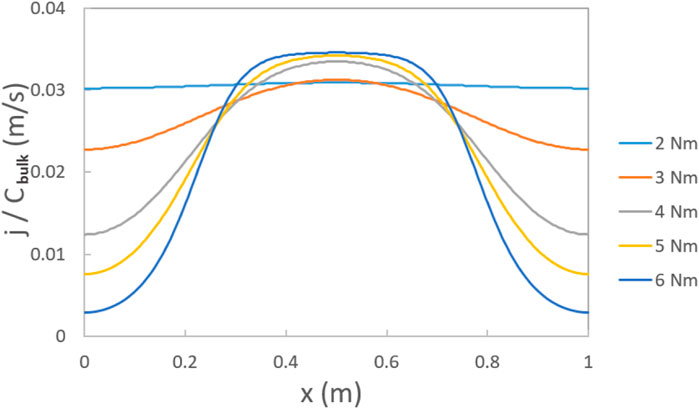
FIGURE 9. Ratio between the flux of O2 (j) and O2 bulk concentration (Cbulk) at the interface between the GDL and catalyst layer under torques of 2 Nm, 3 Nm, 4 Nm, 5 Nm, and 6 Nm with a land and channel width of 0.5 mm at gas flow rates of 2000 ccm (land part: x = 0–0.25 mm, 0.75–1 mm; channel part: x = 0.25–0.75 mm).
4 Conclusion
In this study, we developed methods for measuring and calculating the in-plane and through-plane oxygen apparent diffusion coefficients in GDL, using commercial carbon paper GDL (AvCarb EP40) as a case study. We found that both the in-plane and through-plane oxygen diffusion coefficients are affected by gas flow rates and torques. As the torque increases and the gas flow rate decreases, the in-plane oxygen diffusion coefficient decreases. We also simulated the oxygen flux distributions in GDL under various torques and gas flow rates. The results show that the channel part contributes to the majority of the oxygen flux, while the land part contribution decreases significantly with increasing torque. Overall, our results provide insights into the impact of torques and gas flow rates on the oxygen diffusion in fuel cells. This work may guide future studies on optimizing the design and operation of fuel cells for improved performance.
Data availability statement
The original contributions presented in the study are included in the article/Supplementary Material; further inquiries can be directed to the corresponding authors.
Author contributions
KY, TL, YaW, X-ZY, YY, and HW contributed to the conception and design of the study. KY wrote the first draft of the manuscript. All authors contributed to the article and approved the submitted version.
Funding
This work was supported by the Ministry of Education Key Laboratory of Energy Conversion and Storage Technologies (Y01406010), the Guangdong Innovative and Entrepreneurial Research Team Program (2016ZT06N500), and the Guangdong Provincial Key Laboratory of Energy Materials for Electric Power (2018B030322001).
Conflict of interest
The authors declare that the research was conducted in the absence of any commercial or financial relationships that could be construed as a potential conflict of interest.
Publisher’s note
All claims expressed in this article are solely those of the authors and do not necessarily represent those of their affiliated organizations, or those of the publisher, the editors, and the reviewers. Any product that may be evaluated in this article, or claim that may be made by its manufacturer, is not guaranteed or endorsed by the publisher.
References
Ahmed, D. H., and Sung, H. J. (2006). Effects of channel geometrical configuration and shoulder width on PEMFC performance at high current density. J. Power Sources 162, 327–339. doi:10.1016/j.jpowsour.2006.06.083
Astrath, N. G. C., Shen, J., Song, D. T., Rohling, J. H., Astrath, F. B. G., Zhou, J. Q., et al. (2009). The effect of relative humidity on binary gas diffusion. J. Phys. Chem. B 113, 8369–8374. doi:10.1021/jp900796w
Baker, D. R., Wieser, C., Neyerlin, K. C., and Murphy, M. W. (2006). The use of limiting current to determine transport resistance in PEM fuel cells. ECS Trans. 3, 989–999. doi:10.1149/1.2356218
Beuscher, U. (2006). Experimental method to determine the mass transport resistance of a polymer electrolyte fuel cell. J. Electrochem. Soc. 153, A1788. doi:10.1149/1.2218760
Chan, C., Zamel, N., Li, X. G., and Shen, J. (2012). Experimental measurement of effective diffusion coefficient of gas diffusion layer/microporous layer in PEM fuel cells. Electrochim. Acta 65, 13–21. doi:10.1016/j.electacta.2011.12.110
Curtin, D. E., Lousenberg, R. D., Henry, T. J., Tangeman, P. C., and Tisack, M. E. (2004). Advanced materials for improved PEMFC performance and life. J. Power Sources 131, 41–48. doi:10.1016/j.jpowsour.2004.01.023
Dai, W., Wang, H. J., Yuan, X. Z., Martin, J. J., Luo, Z. P., and Pan, M. (2008). Measurement of the water transport rate in a proton exchange membrane fuel cell and the influence of the gas diffusion layer. J. Power Sources 185, 1267–1271. doi:10.1016/j.jpowsour.2008.07.033
Fluckiger, R., Freunberger, S. A., Kramer, D., Wokaun, A., Scherer, G. G., and Buchi, F. N. (2008). Anisotropic, effective diffusivity of porous gas diffusion layer materials for PEFC. Electrochim. Acta 54, 551–559. doi:10.1016/j.electacta.2008.07.034
Khetabi, E., Bouziane, K., Zamel, N., Francois, X., Meyer, Y., and Candusso, D. (2019). Effects of mechanical compression on the performance of polymer electrolyte fuel cells and analysis through in-situ characterisation techniques - a review. J. Power Sources 424, 8–26. doi:10.1016/j.jpowsour.2019.03.071
Kramer, D., Freunberger, S. A., Fluckiger, R., Schneider, I. A., Wokaun, A., Buchi, F. N., et al. (2008). Electrochemical diffusimetry of fuel cell gas diffusion layers. J. Electroanal. Chem. 612, 63–77. doi:10.1016/j.jelechem.2007.09.014
LaManna, J. M., and Kandlikar, S. G. (2011). Determination of effective water vapor diffusion coefficient in pemfc gas diffusion layers. Int. J. Hydrogen Energ. 36, 5021–5029. doi:10.1016/j.ijhydene.2011.01.036
Marrero, T. R., and Mason, E. A. (1972). Gaseous diffusion coefficients. J. Phys. Chem. Reference Data 1, 3–118. doi:10.1063/1.3253094
Omrani, R., and Shabani, B. (2019). Review of gas diffusion layer for proton exchange membrane-based technologies with a focus on unitised regenerative fuel cells. Int. J. Hydrogen Energ. 44, 3834–3860. doi:10.1016/j.ijhydene.2018.12.120
Ozden, A., Shahgaldi, S., Li, X. G., and Hamdullahpur, F. (2019). A review of gas diffusion layers for proton exchange membrane fuel cells-With a focus on characteristics, characterization techniques, materials and designs. Prog. Energ. Combust. 74, 50–102. doi:10.1016/j.pecs.2019.05.002
Rashapov, R., Imami, F., and Gostick, J. T. (2015). A method for measuring in-plane effective diffusivity in thin porous media. Int. J. Heat. Mass Tran 85, 367–374. doi:10.1016/j.ijheatmasstransfer.2015.01.101
Rohling, J. H., Shen, J., Wang, C., Zhou, J., and Gu, C. E. (2007). Determination of binary diffusion coefficients of gases using photothermal deflection technique. Appl. Phys. B-Lasers O. 87, 355–362. doi:10.1007/s00340-007-2595-9
Shen, J., Zhou, J., Astrath, N. G., Navessin, T., Liu, Z. S., Lei, C., et al. (2011). Measurement of effective gas diffusion coefficients of catalyst layers of PEM fuel cells with a Loschmidt diffusion cell. J. Power Sources 196, 674–678. doi:10.1016/j.jpowsour.2010.07.086
Stumper, E., Lohr, M., and Hamada, S. (2005). Diagnostic tools for liquid water in PEM fuel cells. J. Power Sources 143, 150–157. doi:10.1016/j.jpowsour.2004.11.036
Williams, M. V., Begg, E., Bonville, L., Kunz, H. R., and Fenton, J. M. (2004). Characterization of gas diffusion layers for PEMFC. J. Electrochem. Soc. 151, A1173. doi:10.1149/1.1764779
Keywords: proton exchange membrane fuel cells, gas diffusion layer, oxygen diffusion coefficients, land, channel
Citation: Yao K, Long T, Wang Y, Yuan X-Z, Yao Y and Wang H (2023) Measuring the through-plane and in-plane oxygen apparent diffusion coefficients in the gas diffusion layer. Front. Energy Res. 11:1200603. doi: 10.3389/fenrg.2023.1200603
Received: 12 April 2023; Accepted: 24 May 2023;
Published: 07 June 2023.
Edited by:
Chen Ling, Toyota, United StatesReviewed by:
Utsav Raj Aryal, Toyota Research Institute, United StatesYongxiao Tuo, China University of Petroleum, China
Copyright © 2023 Yao, Long, Wang, Yuan, Yao and Wang. This is an open-access article distributed under the terms of the Creative Commons Attribution License (CC BY). The use, distribution or reproduction in other forums is permitted, provided the original author(s) and the copyright owner(s) are credited and that the original publication in this journal is cited, in accordance with accepted academic practice. No use, distribution or reproduction is permitted which does not comply with these terms.
*Correspondence: Yao Yao, eXlhb2FrQGNvbm5lY3QudXN0Lmhr; Haijiang Wang, d2FuZ2hqQHN1c3RlY2guZWR1LmNu