 Chen Peng
 Yajie Niu
- 1College of Information Science and Engineering, Jishou University, Jishou, China
- 2School of Communication and Electronic Engineering, Jishou University, Jishou, China
To advocate the adoption of electric vehicle (EV) technologies, this paper studies a practical operating paradigm for running a charge park vehicle-to-grid (V2G) service business. The operating paradigm consists of a service agreement and two consecutive day-ahead analyses. Specifically, i) the service agreement underpins the communication pattern between the EV owners and the V2G service operator, ii) day-ahead analysis-I estimates the V2G energy reserve distribution, and iii) day-ahead analysis-II aims to maximize profit by optimizing decision variables for the scheduled day, such as the output period and sale price of the V2G energy. Correspondingly, the contributions of this paper are three-fold. First, the major principles behind the design of a service agreement are highlighted, and a practical service agreement that abides by the principle is formed. Second, for day-ahead analysis-I, this paper proposes a V2G energy reserve modeling method for the rapid estimation of V2G energy reserve distribution, which is applied to a case study of New York City working and recreational environment charge parks. Third, for day-ahead analysis-II, an evaluation framework is proposed, which provides various metrics for characterizing the V2G output capacity. The metrics evaluation and profit maximization methods are presented with theoretical results and are verified also by computer experiments. For example, we show that for the simulated environment with peak time-of-use hours [13:00, 16:00] and V2G output period [13:00, 14:00], the V2G output power threshold 61 kW selected by our method achieves almost the maximum scheduled day profit (true maximum achieved at 60 kW).
1 Introduction
The present and continuously increasing penetration of electric vehicles (EVs) presents various challenges to the power system. Meanwhile, it has been widely recognized that EV batteries can provide various auxiliary services to the power system, by supplying excessive energy back to the grid. The foundation of such activities is the so-called vehicle-to-grid (V2G) technology, which is enabled by novel bidirectional chargers (Suul et al., 2016; Szinai et al., 2020; Popkova et al., 2023).
According to the objectives and locations of charging, the currently envisioned EV charging services (along with the existing services) can be classified into the following three major scenarios: commercial charging (CC), business charging (BC), and home charging (HC) (Islam et al., 2018). Specifically, CC refers to dedicated fast charging services aimed to extend EV distances, which functions as a future gas station equivalent and uses DC fast charging stations (FCSs) with the highest charging level (level 3) (Yunus et al., 2011; Fan et al., 2015; Zhang et al., 2022). BC refers to charging services integrated with business premises (level 2) (Islam et al., 2018; Yan et al., 2018; Jin and Tan, 2019), such as shopping malls, universities, and offices, in order to provide welfare and attract EV owners, benefiting the whole integrated system. Finally, HC refers to charging that usually happens at home with an ordinary household outlet (level 1) and is also referred to as residential charging (Richardson et al., 2012; Maigha and Crow, 2017; Jin and Zhao, 2018).
Compared to CC and HC, BC charge parks are most likely to pioneer the collective use of V2G technology (Gough et al., 2017; Yan et al., 2018) since efficiency is most prioritized in CC (Bayram et al., 2012; Mauri and Valsecchi, 2012; Shan et al., 2019), and HC users already have a considerable time flexibility for satisfying charging demands, not to mention upgrading the existing infrastructures (Lopez-Behar et al., 2019; Zhao et al., 2020).
However, the adoption of V2G technology in charge parks is still facing several challenges. First, it has been investigated that in many circumstances, EV drivers prefer not to participate in V2G contracts—they are mostly concerned about the “discharging cycles” and the “guaranteed minimum battery level” (Hu et al., 2021; Huang et al., 2021). Second, the uncertainties from user behaviors are very difficult to model due to the lack of a generally recognized V2G serving agreement and the intrinsic randomness of user behaviors. As a result, researchers adopt different assumptions on the service agreements, and the results of different studies are hard to compare (Nguyen et al., 2016; Gough et al., 2017; Uddin et al., 2017; Lakshminarayanan et al., 2018).
In recent years, several studies in the field of V2G focus on efficient charging strategies and grid stability maintenance. For example, in the work of Qin et al. (2020), a bidirectional photovoltaic/battery-assisted EV parking lot system was proposed with V2G service, effectively managing EVs’ charging and discharging states to support grid stability. However, a prerequisite for implementing these functionalities lies in accurately predicting the user demands and, consequently, being able to further forecast the capacity of V2G services provided by charge parks. Currently, there is limited research that explicitly addresses the challenges associated with the predicting user demands. Therefore, one of the novelties of this paper is to propose a service agreement aimed at mitigating the uncertainty of user behavior.
To facilitate the adoption of EV technologies, this paper considers a practical operating paradigm for running a charge park V2G service business. The operating paradigm consists of four steps, i.e., determining a service agreement, day-ahead analysis-I, day-ahead analysis-II, and executing the optimal decision. Specifically, i) the service agreement underpins the communication pattern between the EV owners and the V2G service operator. ii) Day-ahead analysis-I aims to identify the time with abundant V2G energy, based on the service agreement. iii) Day-ahead analysis-II is performed for profit maximization through specifying the V2G scheduler model and searching for the optimal decision variables. iv) Finally, the optimal decisions are executed on the scheduled day.
The major contributions of this paper are summarized as follows:
1. The V2G business operating paradigm is proposed, which consists of forming a service agreement, day-ahead analyses-I, day-ahead analyses-II, and decision execution. In addition, the major principles behind the design of a service agreement are highlighted, and a practical service agreement that abides by the principles is formed.
2. For day-ahead analysis-I, based on the service agreement, a V2G energy reserve estimation method is developed to identify the time with abundant V2G energy. The method is applied in a case study of New York City working and recreational environment charge parks, and the time with abundant V2G energy agrees with the results given by day-ahead analysis-II.
3. For day-ahead analysis-II, the mixed-integer linear programming (MILP) V2G scheduler model is considered, based on which an evaluation framework is proposed to characterize the V2G service output capability. Specifically, the evaluation framework provides metrics for characterizing the V2G output power capacity, service cost, and profit, as well as the methods to compute the metrics, which are verified theoretically and experimentally.
This paper is organized as follows. Section 2 introduces related studies. In Section 3, the V2G business operating paradigm is described and a practical V2G service agreement is formed. In Section 4, for day-ahead analysis-I, a V2G energy reserve modeling method is developed and applied to a case study of New York City working and recreational environment charge parks. Next, for day-ahead analysis-II, Section 5 considers a MILP V2G scheduler model, based on which several evaluation metrics are introduced to characterize the V2G service capability. In Section 6, the metrics evaluation and profit maximization methods are presented with theoretical results and are verified also by computer experiments. Finally, Section 7 concludes the paper.
2 Related studies
2.1 User behavior and service agreement
As pointed out in the work of Nguyen et al. (2016), customer requirements from EV owners are highly dependent on personal preferences. The common serving strategies in the literature can be classified into the following two categories: prediction-based serving and user-specification-based serving.
As examples of prediction-based serving, Gough et al. (2017), Uddin et al. (2017), and Wu et al. (2022) assumed that the energy of the next trip can be predicted accurately. Thus, EVs were discharged to the lowest possible level to exactly satisfy the next trip’s energy requirement. The predictions were made by the V2G aggregator in the work of Gough et al. (2017) and Song et al. (2020) and by the battery management system (BMS) in the work of Uddin et al. (2017) and Zhu et al. (2021), which were overambitious. Similarly, in the work of Lakshminarayanan et al. (2018), EV travel patterns were forecasted using a random-forest forecasting method. The predictions provided information on the EVs’ future trips at specified intervals and the EVs’ dwell time in that day.
In user-specification-based serving, EV owners provided departure times and the desired disconnection SoCs before starting the connection services (Nguyen et al., 2016; Yan et al., 2018; Li C. et al., 2020). The EV owners might also specify other preferences as inputs, such as the maximum V2G power and energy. Such a policy minimized the need for predictions; however, a higher level of user engagement is required.
In summary, the majority of current modeling approaches for V2G charge parks were either assuming overambitious predictive service agreements (Gough et al., 2017; Wang et al., 2015; Shi et al., 2023) or were constructed to be very complicated to account for various user preferences, assuming highly user-engaging serving patterns (Yan et al., 2018; Huo et al., 2016; Nguyen et al., 2016). The absence of a well-established V2G service agreement results in large discrepancies on how to model user behaviors.
2.2 Capacity prediction and V2G scheduling
Many studies in the field of V2G currently focus on efficient charging strategies and grid stability maintenance. For example, in the work of Qin et al. (2020), a bidirectional photovoltaic/battery-assisted EV parking lot system was proposed with V2G service, thus effectively managing EVs’ charging and discharging states to support grid stability. However, a prerequisite for implementing these functionalities lies in accurately predicting user demands and, consequently, being able to further forecast the capacity of V2G services provided by charge parks. Due to the complexity of the user demand and EV travel patterns, the accurate prediction of the user demand is difficult. One appealing alternative problem is V2G capacity prediction, which predicts the potential of V2G service providers instead. As indicated in the work of Zhang et al. (2016), V2G capacity was highly dependent on charging/discharging schedules, according to the analysis of two extreme plans. Based on the work of Zhang et al. (2016), a V2G capacity evaluation method for the shift-working V2G was proposed in the work of Dai et al. (2020), where an analytical solution can be derived. In the work of Li S. et al. (2020), the V2G schedulable capacity was simulated and predicted with the dynamic rolling prediction and decision method.
Generally speaking, V2G schedulers are modeled so that the factors of charging stations, power grid, and user satisfaction are captured. Different optimization objectives can be pursued, which include minimizing carbon dioxide emissions (Hoehne and Chester, 2016; Ravi and Aziz, 2022) and maximizing profit (Huda et al., 2020; Chai et al., 2023) and user satisfaction (Triviño-Cabrera et al., 2019; Singh et al., 2023). For example, Ravi and Aziz (2022) mentioned that V2G technology, along with the diversification of clean fuels in the mobility sector, will help address the larger issue of climate change and carbon emissions more effectively than traditional methods. In the work of Huda et al. (2020), in JAMALI, Indonesia, the peak-hour supply was reduced by up to 2.8% (coal) and 8.8% (gas), with potential cost reductions of up to 60.15% and a 3.65% increase in power companies’ annual revenue through V2G implementation. In the work of Singh et al. (2023), a novel power loss reduction index was introduced to ensure the delivery of high-quality power supply to users, and the effectiveness of the proposed indicator was validated through experiments. For the survival of a V2G business, maximizing profit while satisfying user demand and reducing charge anxiety is crucial (Varshosaz et al., 2019).
3 Operating paradigm and the service agreement
In this section, the V2G business operating paradigm is described. Then, the major principles behind the design of a service agreement are highlighted, and a practical service agreement that abides by the principle is formed in order to facilitate the modeling and analysis of V2G energy.
3.1 The V2G business operating paradigm
The V2G business operating paradigm involves the determination of a service agreement, day-ahead analysis-I, day-ahead analysis-II, and the execution of the optimal decision, as shown in Figure 1. Specifically,
1. The service agreement is a basis for the V2G business, which underpins the communication pattern between EV owners and the V2G service operator. Therefore, the service agreement must be determined before the scheduling model can be formulated, which is again a basis for any further analysis.
2. Day-ahead analysis-I is a fast version of day-ahead analysis, which aims to quickly estimate the V2G energy reserve distribution and identify the time with abundant V2G energy, based on the service agreement and historical data. It is expected to be fast since no scheduler model needs to be considered at this step.
3. Day-ahead analysis-II is a more complicated version of day-ahead analysis, which is performed for profit maximization through specifying the V2G scheduler model and searching for the optimal decision variables, such as the V2G output time interval, output power, and V2G energy sale price.
4. The final step is the execution of the optimal decisions on the scheduled day.
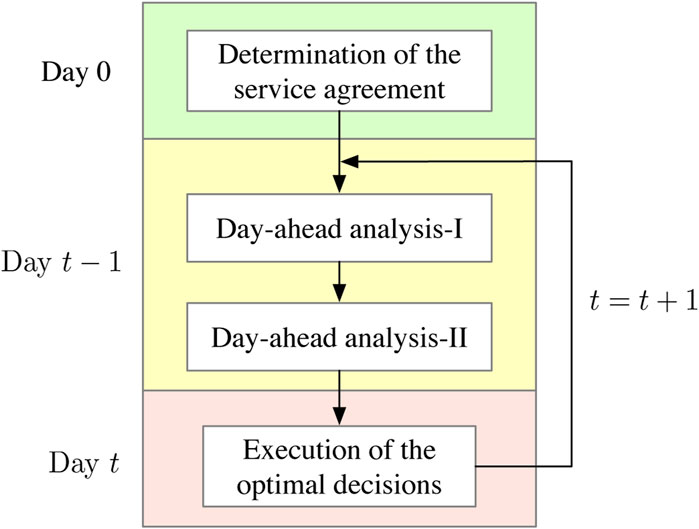
FIGURE 1. V2G business operating paradigm.
It can be seen that the service agreement should be determined before starting the V2G business, and the day-ahead analyses I and II constitute the main planning stage, which are to be conducted 1 day before the scheduled day, and these are our main research targets. The execution of decision variables is not covered in this paper.
3.2 Service agreement
A well-designed service agreement should satisfy the following requirements: i) the transaction rule is straightforward enough for the EV owners to comprehend and comply with; ii) the agreement should be based on a conventional parking policy, e.g., a flat fee for parking a certain number of hours or days, with additional commitments to charging/discharging; and iii) the agreement is in accordance with the system operator’s interests, which include reducing the EV charging costs and facilitating the usage of V2G technologies.
Therefore, assuming that the BC charge park uses level 2 chargers (6.6 kW) uniformly for all EV parking spaces, we consider the following charging agreement: “after plugging in the charger, each EV owner chooses a predicted dwell time and then the system operator will be committed to charging the EV with an average power ofpcaby the end of the set dwell time or up to an SoC upper limitsmax < 1, while gaining the right to discharge the EV’s battery during this period, as needed; the operator will not be responsible for failing to satisfy the commitment if the EV departs before reaching the set dwell time.” It should be noted that the only action EV owners are required to do, besides plugging in, is to determine a dwell time. This service agreement is intended to be used in conjunction with a conventional parking policy (free parking or hourly flat fee for the parking lots); thus, it can be free of charge, or an additional hourly flat fee can be used for parking. The proposed service agreement satisfies the three requirements of the design.
4 Day-ahead analysis-I: estimating V2G energy reserve distribution
4.1 V2G energy reserve modeling
In this section, we omit the subscript v, referring to each EV for simplicity. Using the known arrival time t0 and set dwell time T, the departure time of an EV can be derived as tf = t0 + T. Since the average charging power pca is given, the committed increased battery energy Etarget and the departure SoC starget are given by
where B is the EV’s battery capacity. It should be that smax is usually a scalar close to but smaller than 1, such as 0.95, for protection and efficiency purposes Fan et al. (2015).
4.1.1 Modeling the extreme cases
Every EV’s charging process has two extreme cases, i.e., first charge with the maximum charging power and then discharge with the maximum discharging power or first discharge with the maximum discharging power and then charge with the maximum charging power. The extreme cases seldom appear and usually should be avoided. However, it is useful to consider one extreme case for modeling the EV-based energy storage.
Here, we use the second case (maximum discharge before charging) to derive the design of an EV’s initial V2G energy r(t0) and then consider general cases to design the V2G energy function r(t). With the committed increased battery energy Etarget and departure SoC starget computed with Eqs 1, 2, and assuming that the initial SoC s0 is high enough to prevent discharging at the lower limit of SoC, the charging process of an EV is shown in Figure 2A.
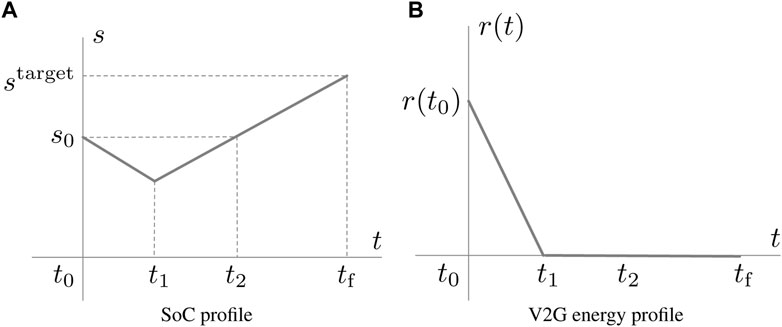
FIGURE 2. SoC and V2G energy reserve profiles in the second extreme case (maximally discharge before charging).
Here, t1 is the latest time to stop discharging and start charging with full charging power, and t2 is the latest time to start charging if no discharge activities happen. The time instants t1 and t2 are given by
where pd and pc denote the maximum discharging and charging powers, respectively.
Then, the V2G energy reserve r(t) in this case can be derived as follows. Since V2G energy reserve refers to the amount of energy stored in a battery that can be discharged for V2G purposes, the profile of r(t) should be the same as in Figure 2B, where it initially has the largest value r(t0) and then diminishes to zero as the battery discharges from t0 to t1. Thus, the initial V2G energy reserve can be derived as follows:
It should be noted that at this point, the initial V2G energy reserve r(t0) has become independent of the charging and discharging schedule; i.e., (5) holds in general scheduling cases.
4.1.2 General maximized discharge
Let l (⋅) denote the length of a Lebesgue-measurable subset of the set of real numbers
Thus, for general maximal discharge cases, we can define the V2G energy reserve of an EV at time t as follows:
It is easy to verify that the initial energy reserve (5) derived for the second extreme case and the energy reserve (7) defined for general maximized discharge case are consistent. For general cases where an EV is not maximally discharged, r(t) defined in Eq. 7 is still used to measure an EV’s available V2G energy.
To deal with multiple EVs, let ri(t) denote the V2G energy reserve of EV i. By properly aggregating the individual V2G energy reserve ri(t), a certain r(t)-statistics-based charge park evaluation method can be developed. The differences between the r(t)-statistics-based evaluation method and general simulation-based evaluation method can be summarized as follows:
1. The r(t)-statistics-based evaluation aggregates the individual V2G energy reserve ri(t) and ignores distribution network constraints. Thus, the evaluation result reflects the V2G output potential instead of the accurate output capacity of the charge park. Since no simulation needs to be made, it is lightweight and suitable for early-stage planning, when the system parameters are still uncertain.
2. Simulation-based evaluation, on the other hand, needs to solve a scheduler optimization problem for a simulated charge demand scenario to compute the final metrics. It is more appropriate to use this method when a detailed system model is obtainable with readily available parameters.
In the following section, an r(t)-statistics-based evaluation method is developed, where the individual V2G energy reserves ri(t) for different EVs are aggregated according to the average import price (AIP) of the reserved energy ri(t). In Sections 5–6.3, on the other hand, a simulation-based evaluation method will be developed and used to compute an accurate estimation of the charge park V2G output capacity.
4.2 Case study: New York City working and recreational environment business charging
In this case study, an r(t)-statistics-based analysis was performed to evaluate the V2G output potential of New York City charge parks using the V2G energy reserve model (7), presented in Section 4.1, where each EV’s V2G energy reserve was first computed and then aggregated by the AIP of the energy.
Specifically, a workplace charge park and a recreational environment charge park were considered in a near future New York City. The workplace charge park and the recreational environment charge park were assumed to have a total of 200 and 1,000 EVs parked on the designated date, respectively. In addition, the charge parks were assumed to adopt the service agreement, with pca = 2.2 kW and level 2 chargers of 6.6 kW (220V/30A). The discharging power was assumed to be the same as the charging power; thus, pd = pc = 6.6 kW.
4.2.1 Charge demand modeling
Considering the future adoption of larger battery sizes, it is assumed that 30% of the parked vehicles have battery capacities of 70 kWh, 50% have capacities of 90 kWh, and 20% have capacities of 110 kWh. The parking and charging patterns of the EV fleet were derived from the 2017 National Household Travel Survey (NHTS) data1. The parking lot occupancy situations for the two scenarios are shown in Figure 3.
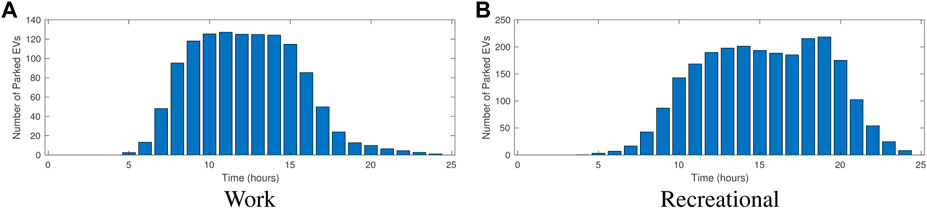
FIGURE 3. Parking lot occupancy prediction for a working environment (assuming a working day situation with a total of 200 daily parked vehicles) and a recreational environment (assuming a holiday situation with a total of 1,000 daily parked vehicles).
As a current research practice, the SoC of an EV is estimated based on its daily travel distance. For example, in the work of Yunus et al. (2011), the SoC of an EV is derived using a synthesized vehicle’s daily travel distance. Here, we use the arrival trip distance VMTi of an EV i obtained from the 2017 NHTS database to derive the portion of SoC consumed by the trip
4.2.2 V2G energy reserve day-ahead analysis
Using the NYISO hourly day-ahead price data for New York City on 31 August 20182, the day-ahead analysis on the V2G energy reserve is performed for two peaks in the day-ahead price curve, i.e., 13:00 at 4.93¢/kWh and 16:00 at 4.95¢/kWh.
As shown in Figure 4, V2G energy is abundant at 13:00 since this time period connects peak hours and off-peak hours. On the other hand, at 16:00, there is still plenty of V2G energy in the recreational environment charge park compared to the workplace charge park since there are more parked EVs at this time, as shown in Figure 3. However, most of the EVs’ V2G energy has higher AIP at 16:00 due to the average high electricity prices during the EVs’ park time. In summary, V2G energy is most abundant at 13:00 in both workplace and recreational environment charging scenarios, while being healthier in the workplace charge park since most V2G energy has lower equivalent prices; i.e., the V2G energy is not only abundant but also cheaper (around 3.75¢/kWh and 4.05¢/kWh for workplace charge parks and greater than 4.1¢/kWh for recreational environment charge parks).
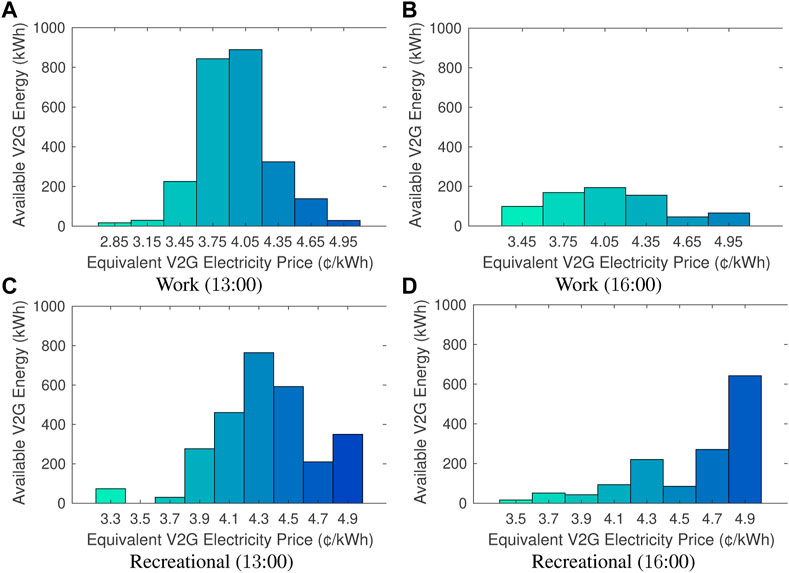
FIGURE 4. Available V2G energy reserve distribution over equivalent electricity prices (rounded) using varying battery capacities (30% of 35 kWh, 50% of 75 kWh, and 20% of 100 kWh).
5 Day-ahead analysis-II: scheduler model and evaluation metrics
In this section, a dynamic evaluation framework is proposed to characterize the charge park’s V2G output capability, using the 2017 NHTS data and a developed MILP-based scheduler. The evaluation intends to provide insights for the profit-seeking, decision-making process of the V2G service provider.
Figure 5 shows how the proposed framework may fit in the large picture of a V2G service provider. The main components of the evaluation framework are the MILP scheduler and the planning module, which serve for the profit-seeking process of the V2G service provider. The optimization solver used in this paper is the “intlinprog” solver in MATLAB, which is a powerful built-in solver specifically designed for solving MILP problems. The “intlinprog” solver utilizes an advanced branch-and-bound algorithm combined with linear programming relaxation to efficiently explore the feasible solution space and find an optimal solution. The model predictive controller (MPC) and the prediction parts are supposed to be implemented by the V2G service provider. It is worth mentioning that the MPC has already been applied in the PEVs operation studies Rahmani-Andebili and Fotuhi-Firuzabad (2017). Thus, the proposed framework can be readily connected to the current methodologies.
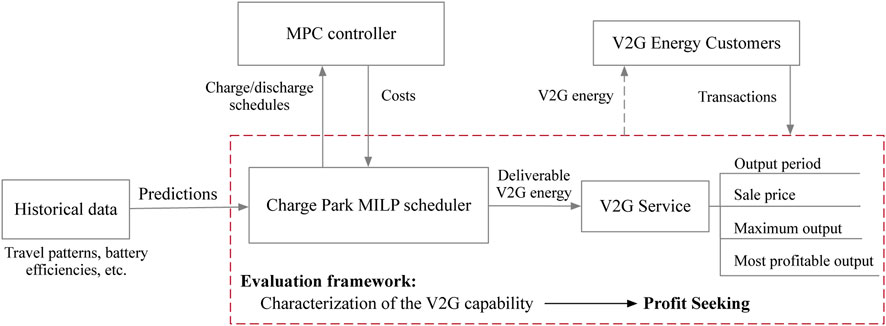
FIGURE 5. Evaluation framework for charge park V2G service capability.
The purpose of the scheduler is to evaluate the V2G output capability of the charge park for every business day during the day-ahead planning, considering various constraints. The characterization of the charge park’s V2G capability provides insights for the profit-seeking, decision-making process of the V2G service provider, described by the planning block. According to the characterization profiles, the V2G service provider determines the V2G output period, the V2G energy unit sale price, and the maximum power that can be supplied to its customers. Given the aforementioned information, the V2G customers then purchase power that the V2G service provider commits to supply.
5.1 System description and scheduler model
In Mouli et al. (2017), a mixed-integer linear programming-based scheduler is used to optimize the charging/discharging schedule. The main difference between the scheduler here and the one in the work of Mouli et al. (2017) is that the scheduler in the work of Mouli et al. (2017) optimizes a lumped objective of profit maximization and determines the V2G output commitment itself, which makes the higher-level service plan and contract decision-making impossible. In contrast, to characterize the charge park’s V2G output capability for decision-making purposes, here, the V2G output period and power are given as parameters in the MILP problem, which aims to minimize the resulting electricity cost.
5.1.1 Charge park constraints
In the considered charge park, each charging station c connects to the grid via a DC/AC inverter of rated power
Let
The V2G activity of each EV is indicated by
Eqs 17–21 are constraints for battery energy evolution. Here, the constant
Eqs 22–24 are the power exchange constraints for each charging station. Each charging station c draws power
Eqs 25–27 are constraints for the total power imported from or exported to the distribution grid by the charge park. The imported power
5.1.2 Decision constraints
According to the service agreement (ref. Eq. 1), the charge demand of EV v is given by
where
The following constraint describes the V2G output demand that needs to be satisfied by the charge park.
where
5.1.3 Optimization objective
The objective of the scheduler is to minimize the electricity cost plus the penalty for failing to satisfy the EV charge demand. Let enff denote the EV charge-demand-not-fulfilled (CDnf) and cimp denote the imported electricity cost (ECost). They are given by
where
The optimization objective can be represented as follows:
where Cp is the penalty coefficient for failing to satisfy the charge demand. For small Cp, an optimal solution may have a non-zero enff, sacrificing EV charge demand satisfaction for lower imported electricity cost cimp. By adjusting the value of Cp, the charge park system operator controls how strictly the scheduler satisfies the EV charge demand. Here, Cp is set to be very large compared to enff and cimp so that the reduction of CDnf enff will always be prioritized over the reduction of ECost cimp. The variables of the optimization problem are summarized in the nomenclature at C-2 “Optimization variables.”
5.2 Evaluation measures
Let enff(p) and cimp(p) denote the CDnf (30) and ECost (31), respectively, as functions of the V2G output power Pv2g = p. To study the dependence of the optimization solution on the V2G output power Pv2g for a fixed output time period
5.2.1 V2G output power capacity
The V2G output power capacity
5.2.2 V2G service cost and profit
Here, several common evaluation measures in economics are defined for the study of the V2G service. It is worth pointing out that the “unit costs” and “marginal costs” defined as follows are computed with respect to the supplied energy
•V2G energy average unit cost:
where
•V2G energy incremental unit cost:
for some evaluation interval δp.
•V2G energy marginal cost:
•Total profit of the V2G service for the scheduling day, ignoring investment and maintenance cost for the charge park’s facilities:
where Sv2g is the unit sale price of the V2G energy for the supply period
•V2G service marginal profit:
6 Day-ahead analysis-II: evaluation methods and profit maximization
This section presents a theoretical basis for the characterization of charge park V2G service output capability.
6.1 General characteristics of imported electricity cost and charge-demand-not-fulfilled
Here, distribution network limits PDN+ = PDN− = 200kW are used. Furthermore, all the simulation parameters are listed in Table 1. Currently, battery charging and discharging efficiencies
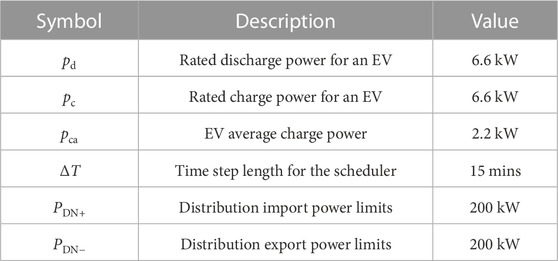
TABLE 1. Simulation parameters.
Assumption 1. A so-called “uniform efficiency setting” is considered, where all battery charging and discharging efficiencies take the same value, i.e.,
1.“Ideal efficiency” refers to whenηev = ηconv = 1.
2.“Uniform realistic efficiency” refers to whenηevandηconvtake fixed positive values less than one. In the simulations of this paper,ηev = 0.9andηconv = 0.975.
The following proposition describes the behaviors of ECost cimp(p) and CDnf enff(p).
Proposition 1. Suppose that Assumption 1 holds
1.The CDnfenff(p), as a function of the V2G output powerp, satisfiesenff(p) = 0(all charge demand met) for
for
2. As long as
Proof When
The ECost cimp(p) for p = 0 is the electricity cost for charging EV batteries only. Since for
Verification of this proposition will be carried out in Section 6.2. Since the CDnf penalty Cp is very large, reducing the value of enff(p) is of the highest priority in the solution of Eqs 9–32. When p ≤ pv2g, the V2G output demand
6.1.1 Electricity cost under time-of-use pricing
Currently, two-price and three-price time-of-use (TOU) plans are the most common pricing plans for business users. In California, all commercial, industrial, and agricultural customers are required to be on a TOU plan, as TOU pricing encourages the most efficient use of the system and can reduce the overall costs for both the utility and customers. The on-peak electricity price
As shown in Figure 6, each day is divided into an on-peak period
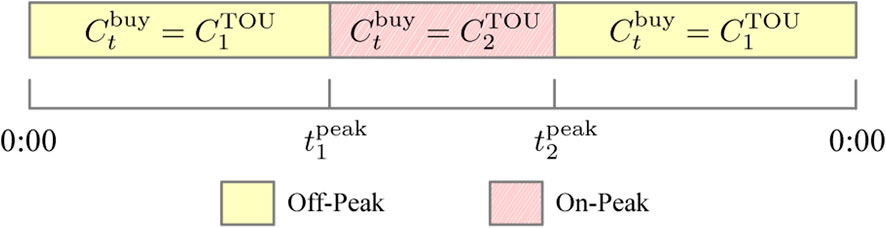
FIGURE 6. Time-of-use pricing plan with off-peak and on-peak levels, where the on-peak time period is
6.2 Evaluation with ideal efficiency parameters
In this section, the charge park V2G service was evaluated under Assumption 1 with the ideal efficiency setting. The working day workplace charging environment in Section 4.2 was considered. Specifically, the charge park had a total of 200 parked vehicles in the simulated day with workplace activity patterns, and the diverse battery capacity setting was used.
6.2.1 Imported electricity cost
The following proposition describes the characteristics of the scheduled day electricity cost cimp(p) as a function of the output power Pv2g = p under a two-price TOU plan.
Proposition 2. Assuming a two-price TOU plan and the ideal efficiency setting (Assumption 1 Setting 1), the total ECostcimpcan be characterized as a three-piece piecewise linear function of the output powerp, as follows:
where
Proof It should be noted that system (9)–(32) is essentially mixed-integer linear programming; thus, cimp(p) must be linear. Since system (9)–(32) was designed to prioritize charging EVs in off-peak hours (with electricity price
Figures 7–8 show the variations of electricity cost cimp(p), CDnf enff(p), and V2G energy marginal cost Cv2g(p) with respect to the V2G output power Pv2g = p ∈ [0, PDN−]. The V2G energy marginal cost Cv2g(p) is approximated using V2G energy incremental unit cost
Figure 7 demonstrates the results where part of the non-V2G hours are on-peak; specifically,
Then, the ECost
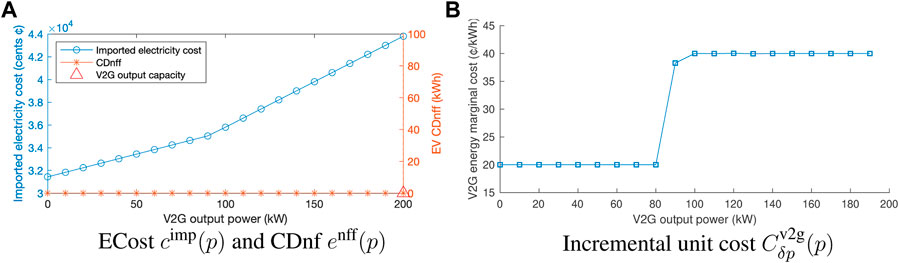
FIGURE 7. ECost cimp(p) and V2G energy marginal cost Cv2g(p) (approximated by the incremental unit cost
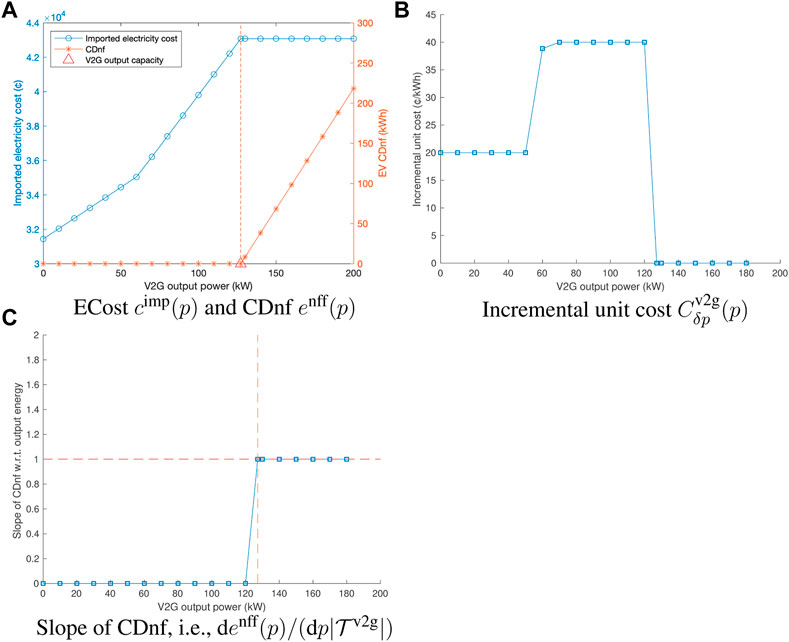
FIGURE 8. ECost cimp(p) and CDnf enff(p), V2G energy marginal cost Cv2g(p) (approximated by the incremental unit cost
Corollary 1. Under the two-price TOU plan and the ideal efficiency scenario (Assumption 1 Setting 1), the V2G output power threshold
by evaluatingcimp(p)atp = 0and
Proof The result is immediate from Eqs 41, 42.
Then, Figure 8 demonstrates the characteristics of the V2G service with a long V2G output period
6.2.2 Profit maximization
As shown in Eq. 37, the profit Pr(p) depends on the V2G energy unit sale price Sv2g, output power p for period
1. In order to gain a competitive edge over the grid electricity provider, the unit sale price of the V2G energy Sv2g needs to be smaller than the electricity unit price
2. On the other hand, to gain profit by providing a V2G service, the V2G energy unit sale price Sv2g needs to be greater than the V2G energy average unit cost
Thus, reducing the average unit cost
For the ideal efficiency scenario with the two-price TOU plan, the following corollary gives a range of feasible sale prices Sv2g and the output power p that maximize the profit Pr(p) defined in Eq. 37.
Corollary 2. Under the two-price TOU plan and considering the ideal efficiency scenario (Assumption 1 Setting 1), ifSv2gis chosen such that
Proof First,
Next, from Proposition 2, the V2G energy marginal cost (36) for the ECost cimp(p) can be given as follows:
Thus, the marginal profit (38) satisfies
6.3 Evaluation with the uniform realistic efficiency setting
6.3.1 Efficiency parameters
In this section, the characteristics of the ECost cimp(p) when using the uniform realistic efficiency setting (Assumption 1 Setting 2) are demonstrated. Other configurations for simulation are the same as in Section 6.2.
Figure 9 shows the evaluation results when
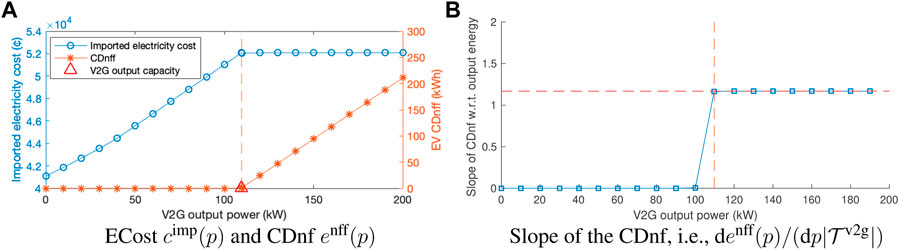
FIGURE 9. Evaluation results for
When using the uniform realistic efficiency configuration, according to Proposition 1, the V2G output capacity
for any
In addition, with a uniform realistic efficiency setting, the characteristic marginal cost values are defined as follows:
and
Clearly, it covers the ideal efficiency scenarios where ηev = ηconv = 1 (Proposition 2).
Using Eqs 45–47 and based on the theoretical results for the ideal efficiency configuration, here, a procedure is proposed to compute a near-optimal output power
1. We evaluate the scheduler (9)–(32) at Pv2g = 0 and Pv2g = PDN−, obtaining cimp (0), cimp (PDN−), and enff (PDN−).
2. We compute the V2G output power capacity
3. We compute the near-optimal V2G output power
The V2G output power
Let the V2G unit sale price
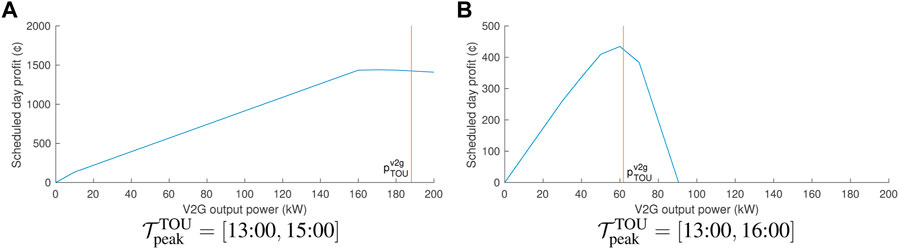
FIGURE 10. Profit Pr(p) for the output period
Finally, it is also interesting to study the relationship between the possible range of V2G energy sale prices and the output power. Figure 11 shows the average unit cost
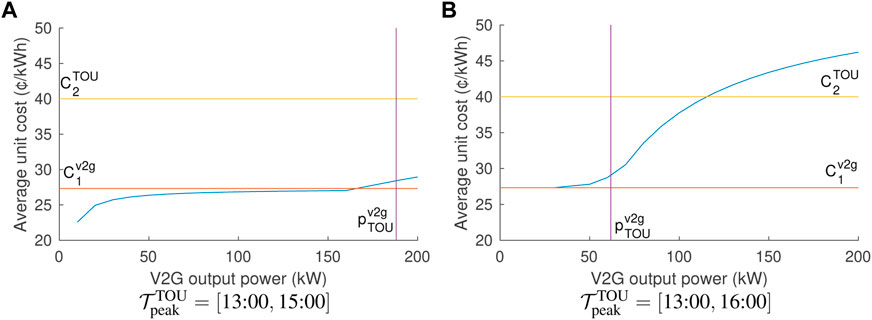
FIGURE 11. V2G energy average unit cost
7 Conclusion
Many studies in the field of V2G focus on efficient charging strategies and grid stability maintenance. However, a prerequisite for implementing these functionalities lies in accurately predicting the user demands and, consequently, being able to further forecast the capacity of V2G services provided by charge parks. This paper aims to promote the adoption of EV technologies and focuses on the practical operating paradigm of charge park V2G service businesses, with the objective of maximizing profit and enhancing customer interaction. The operating paradigm involves determining a service agreement and conducting two consecutive day-ahead analyses. The design principles of a service agreement are emphasized in the paper, and a practical service agreement is formulated based on these principles. Additionally, a V2G energy reserve modeling method is developed for the rapid estimation of V2G energy reserve distribution in the first day-ahead analysis. This method is applied in a case study of charge parks in the working and recreational environment of New York City. Furthermore, this paper proposes an evaluation framework for the second day-ahead analysis, which offers various metrics to characterize the V2G output capacity. The evaluation metrics and profit maximization methods are presented with theoretical results and are validated through computer experiments. These findings contribute to the understanding and optimization of V2G operations. In conclusion, this paper advocates for the adoption of EV technologies by addressing the practical operating paradigm of charge park V2G service businesses. The study highlights the design principles of a service agreement, develops a V2G energy reserve modeling method, and proposes an evaluation framework for the V2G output capacity. The presented theoretical and experimental results provide valuable insights for maximizing profit and optimizing the utilization of EVs in the V2G context.
Data availability statement
The original contributions presented in the study are included in the article/Supplementary Material, further inquiries can be directed to the corresponding author.
Author contributions
Conceptualization: CP; methodology: CP; software: CP; validation: CP; formal analysis: CP; investigation: YN; data curation: YN; writing—original draft preparation: CP and YN; writing—review and editing: CP; visualization: CP and YN; supervision: CP; project administration: CP; and funding acquisition: CP. All authors contributed to the article and approved the submitted version.
Funding
This work was supported by the Natural Science Foundation of China under Grant 62006095, the Natural Science Foundation of Hunan Province, China, under Grant 2021JJ40441, the Research Foundation of Education Bureau of Hunan Province, China, under Grant 20B470, and the Jishou University Graduate Research and Innovation Project XXJD202204.
Conflict of interest
The authors declare that the research was conducted in the absence of any commercial or financial relationships that could be construed as a potential conflict of interest.
Publisher’s note
All claims expressed in this article are solely those of the authors and do not necessarily represent those of their affiliated organizations, or those of the publisher, the editors, and the reviewers. Any product that may be evaluated in this article, or claim that may be made by its manufacturer, is not guaranteed or endorsed by the publisher.
Footnotes
1U.S. Department of Transportation and Federal Highway Administration. 2017 National Household Travel Survey. url: https://nhts.ornl.gov.
2ENGIE Resources. Historical Data Reports. url: https://www.engieresources.com/historical-data.
References
Bayram, I. S., Michailidis, G., Devetsikiotis, M., and Parkhideh, B. (2012). “Strategies for competing energy storage technologies for in DC fast charging stations,” in 2012 IEEE 3rd Int. Conf. Smart Grid Commun. (SmartGridComm) (IEEE), 1–6.
Chai, Y. T., Che, H. S., Tan, C., Tan, W.-N., Yip, S.-C., and Gan, M.-T. (2023). A two-stage optimization method for vehicle to grid coordination considering building and electric vehicle user expectations. Int. J. Electr. Power Energy Syst.148, 108984. doi:10.1016/j.ijepes.2023.108984
Dai, S., Gao, F., Guan, X., Yan, C.-B., Liu, K., Dong, J., et al. (2020). Robust energy management for a corporate energy system with shift-working v2g. IEEE Trans. Autom. Sci. Eng.18, 650–667. doi:10.1109/tase.2020.2980356
Fan, P., Sainbayar, B., and Ren, S. (2015). Operation analysis of fast charging stations with energy demand control of electric vehicles. IEEE Trans. Smart Grid6, 1819–1826. doi:10.1109/tsg.2015.2397439
Gough, R., Dickerson, C., Rowley, P., and Walsh, C. (2017). Vehicle-to-grid feasibility: A techno-economic analysis of EV-based energy storage. Appl. Energy192, 12–23. doi:10.1016/j.apenergy.2017.01.102
Hoehne, C. G., and Chester, M. V. (2016). Optimizing plug-in electric vehicle and vehicle-to-grid charge scheduling to minimize carbon emissions. Energy115, 646–657. doi:10.1016/j.energy.2016.09.057
Hu, H., Fang, M., Hu, F., Zeng, S., and Deng, X. (2021). A new design of substation grounding based on electrolytic cathodic protection and on transfer corrosion current. Electr. Power Syst. Res.195, 107174. doi:10.1016/j.epsr.2021.107174
Huang, B., Meijssen, A. G., Annema, J. A., and Lukszo, Z. (2021). Are electric vehicle drivers willing to participate in vehicle-to-grid contracts? A context-dependent stated choice experiment. Energy Policy156, 112410. doi:10.1016/j.enpol.2021.112410
Huda, M., Koji, T., and Aziz, M. (2020). Techno economic analysis of vehicle to grid (v2g) integration as distributed energy resources in Indonesia power system. Energies13, 1162. doi:10.3390/en13051162
Huo, B., Wang, Z., and Tian, Y. (2016). The impact of justice on collaborative and opportunistic behaviors in supply chain relationships. Int. J. Prod. Econ.177, 12–23. doi:10.1016/j.ijpe.2016.04.006
Islam, M. S., Mithulananthan, N., and Lee, K. Y. (2018). Suitability of PV and battery storage in EV charging at business premises. IEEE Trans. Power Syst.33, 4382–4396. doi:10.1109/tpwrs.2017.2774361
Jin, J., and Tan, M. (2019). Low power quadrature voltage controlled oscillator. Int. J. RF Microw. Computer-Aided Eng.29, e21952. doi:10.1002/mmce.21952
Jin, J., and Zhao, L. (2018). Low voltage low power fully integrated chaos generator. J. Circuits, Syst. Comput.27, 1850155. doi:10.1142/s0218126618501554
Lakshminarayanan, V., Chemudupati, V. G. S., Pramanick, S., and Rajashekara, K. (2018). “Real-time optimal energy management controller for electric vehicle integration in workplace microgrid,” in IEEE Transactions on Transportation Electrification.
Li, C., Shi, X., Liang, S., Ma, X., Han, M., Wu, X., et al. (2020a). Spatially homogeneous copper foam as surface dendrite-free host for zinc metal anode. Chem. Eng. J.379, 122248. doi:10.1016/j.cej.2019.122248
Li, S., Gu, C., Li, J., Wang, H., and Yang, Q. (2020b). Boosting grid efficiency and resiliency by releasing v2g potentiality through a novel rolling prediction-decision framework and deep-lstm algorithm. IEEE Syst. J.15, 2562–2570. doi:10.1109/jsyst.2020.3001630
Lopez-Behar, D., Tran, M., Froese, T., Mayaud, J. R., Herrera, O. E., and Merida, W. (2019). Charging infrastructure for electric vehicles in multi-unit residential buildings: Mapping feedbacks and policy recommendations. Energy Policy126, 444–451. doi:10.1016/j.enpol.2018.10.030
Maigha, , and Crow, M. L. (2017). Cost-constrained dynamic optimal electric vehicle charging. IEEE Trans. Sustain. Energy8, 716–724. doi:10.1109/tste.2016.2615865
Mauri, G., and Valsecchi, A. (2012). “Fast charging stations for electric vehicle: The impact on the MV distribution grids of the Milan metropolitan area,” in 2012 IEEE Int. Energy Conf. and Exhibition (ENERGYCON) (IEEE), 1055–1059.
Mouli, G. R. C., Kefayati, M., Baldick, R., and Bauer, P. (2017). Integrated PV charging of EV fleet based on energy prices, V2G and offer of reserves. IEEE Trans. Smart Grid10, 1313–1325. doi:10.1109/TSG.2017.2763683
Nguyen, H. N., Zhang, C., and Zhang, J. (2016). Dynamic demand control of electric vehicles to support power grid with high penetration level of renewable energy. IEEE Trans. Transp. Electrific.2, 66–75. doi:10.1109/tte.2016.2519821
Popkova, E. G., Bogoviz, A. V., and Sergi, B. S. (2023). Editorial: Smart grids and energytech as a way for sustainable and environmental development of energy economy. Front. Energy Res.11, 246. doi:10.3389/fenrg.2023.1145234
Qin, D., Sun, Q., Wang, R., Ma, D., and Liu, M. (2020). Adaptive bidirectional droop control for electric vehicles parking with vehicle-to-grid service in microgrid. CSEE J. Power Energy Syst.6, 793–805. doi:10.17775/CSEEJPES.2020.00310
Rahmani-Andebili, M., and Fotuhi-Firuzabad, M. (2017). An adaptive approach for pevs charging management and reconfiguration of electrical distribution system penetrated by renewables. IEEE Trans. Indust. Inf.14, 2001–2010. doi:10.1109/tii.2017.2761336
Ravi, S. S., and Aziz, M. (2022). Utilization of electric vehicles for vehicle-to-grid services: Progress and perspectives. Energies15, 589. doi:10.3390/en15020589
Richardson, P., Flynn, D., and Keane, A. (2012). Optimal charging of electric vehicles in low-voltage distribution systems. IEEE Trans. Power Syst.27, 268–279. doi:10.1109/tpwrs.2011.2158247
Shan, L., Zhou, J., Zhang, W., Xia, C., Guo, S., Ma, X., et al. (2019). Highly reversible phase transition endows v6o13 with enhanced performance as aqueous zinc-ion battery cathode. Energy Technol.7, 1900022. doi:10.1002/ente.201900022
Shi, S., Wang, Y., and Jin, J. (2023). Multi-agent-based control strategy for centerless energy management in microgrid clusters. Front. Energy Res.11, 239. doi:10.3389/fenrg.2023.1119461
Singh, P. P., Das, S., Wen, F., Palu, I., Singh, A. K., and Thakur, P. (2023). Multi-objective planning of electric vehicles charging in distribution system considering priority-based vehicle-to-grid scheduling. Swarm Evol. Comput.77, 101234. doi:10.1016/j.swevo.2023.101234
Song, D., Yang, Y., Zheng, S., Deng, X., Yang, J., Su, M., et al. (2020). New perspectives on maximum wind energy extraction of variable-speed wind turbines using previewed wind speeds. Energy Convers. Manag.206, 112496. doi:10.1016/j.enconman.2020.112496
Suul, J. A., D’Arco, S., and Guidi, G. (2016). Virtual synchronous machine-based control of a single-phase bi-directional battery charger for providing vehicle-to-grid services. IEEE Trans. Ind. Appl.52, 3234–3244. doi:10.1109/tia.2016.2550588
Szinai, J. K., Sheppard, C. J., Abhyankar, N., and Gopal, A. R. (2020). Reduced grid operating costs and renewable energy curtailment with electric vehicle charge management. Energy Policy136, 111051. doi:10.1016/j.enpol.2019.111051
Triviño-Cabrera, A., Aguado, J. A., and de la Torre, S. (2019). Joint routing and scheduling for electric vehicles in smart grids with v2g. Energy175, 113–122. doi:10.1016/j.energy.2019.02.184
Uddin, K., Jackson, T., Widanage, W. D., Chouchelamane, G., Jennings, P. A., and Marco, J. (2017). On the possibility of extending the lifetime of lithium-ion batteries through optimal v2g facilitated by an integrated vehicle and smart-grid system. Energy133, 710–722. doi:10.1016/j.energy.2017.04.116
Varshosaz, F., Moazzami, M., Fani, B., and Siano, P. (2019). Day-ahead capacity estimation and power management of a charging station based on queuing theory. IEEE Trans. Indust. Inf.15, 5561–5574. doi:10.1109/tii.2019.2906650
Wang, Z., Huo, B., Tian, Y., and Hua, Z. (2015). Effects of external uncertainties and power on opportunism in supply chains: Evidence from China. Int. J. Prod. Res.53, 6294–6307. doi:10.1080/00207543.2015.1053578
Wu, C.-S., Peng, Y.-X., Zhuo, D.-B., Zhang, J.-Q., Ren, W., and Feng, Z.-Y. (2022). Energy ratio variation-based structural damage detection using convolutional neural network. Appl. Sci.12, 10220. doi:10.3390/app122010220
Yan, Q., Zhang, B., and Kezunovic, M. (2018). Optimized operational cost reduction for an EV charging station integrated with battery energy storage and PV generation. IEEE Trans. Smart Grid10, 2096–2106. doi:10.1109/tsg.2017.2788440
Yunus, K., De La Parra, H. Z., and Reza, M. (2011). “Distribution grid impact of plug-in electric vehicles charging at fast charging stations using stochastic charging model,” in Proceedings of the 2011 14th European Conference on Power Electronics and Applications (IEEE), 1–11.
Zhang, H., Hu, Z., Xu, Z., and Song, Y. (2016). Evaluation of achievable vehicle-to-grid capacity using aggregate pev model. IEEE Trans. Power Syst.32, 784–794. doi:10.1109/tpwrs.2016.2561296
Zhang, H., Li, P., Jin, H., Bi, R., and Xu, D. (2022). Nonlinear wave energy dissipator with wave attenuation and energy harvesting at low frequencies. Ocean. Eng.266, 112935. doi:10.1016/j.oceaneng.2022.112935
Zhao, H., Zhang, H., Bi, R., Xi, R., Xu, D., Shi, Q., et al. (2020). Enhancing efficiency of a point absorber bistable wave energy converter under low wave excitations. Energy212, 118671. doi:10.1016/j.energy.2020.118671
Zhu, L., Hu, R., Xiang, Y., Yang, X., Chen, Z., Xiong, L., et al. (2021). Enhanced performance of li-s battery by constructing inner conductive network and outer adsorption layer sulfur-carbon composite. Int. J. Energy Res.45, 6002–6014. doi:10.1002/er.6220
Nomenclature

Keywords: vehicle-to-grid service, energy reserve distribution, service agreement, day-ahead analysis, profit optimization
Citation: Peng C and Niu Y (2023) Optimal serving strategy for vehicle-to-grid business: service agreement, energy reserve estimation, and profit maximization. Front. Energy Res. 11:1199442. doi: 10.3389/fenrg.2023.1199442
Received: 03 April 2023; Accepted: 09 June 2023;
Published: 06 July 2023.
Edited by:
Tao Zhang, University of Science and Technology Beijing, ChinaReviewed by:
Dehao Qin, Clemson University, United StatesAleksandar Janjic, University of Niš, Serbia, Serbia
Muhammad Aziz, The University of Tokyo, Japan
Copyright © 2023 Peng and Niu. This is an open-access article distributed under the terms of the Creative Commons Attribution License (CC BY). The use, distribution or reproduction in other forums is permitted, provided the original author(s) and the copyright owner(s) are credited and that the original publication in this journal is cited, in accordance with accepted academic practice. No use, distribution or reproduction is permitted which does not comply with these terms.
*Correspondence: Chen Peng, Y2hlbi5wZW5nQGpzdS5lZHUuY24=