 Guofeng Ni
 Xiaoyuan Zhang1
95% of researchers rate our articles as excellent or good
Learn more about the work of our research integrity team to safeguard the quality of each article we publish.
Find out more
ORIGINAL RESEARCH article
Front. Energy Res. , 16 May 2023
Sec. Smart Grids
Volume 11 - 2023 | https://doi.org/10.3389/fenrg.2023.1198855
This article is part of the Research Topic Advances in Artificial Intelligence Application in Data Analysis and Control of Smart Grid View all 20 articles
Introduction: Smart grid financial market forecasting is an important topic in deep learning. The traditional LSTM network is widely used in time series forecasting because of its ability to model and forecast time series data. However, in long-term time series forecasting, the lack of historical data may lead to a decline in forecasting performance. This is a difficult problem for traditional LSTM networks to overcome.
Methods: In this paper, we propose a new deep-learning model to address this problem. This WOA-CNN-BiLSTM model combines bidirectional long short-term memory network BiLSTM and convolution Advantages of Neural Network CNN. We replace the traditional LSTM network with a bidirectional long short-term memory network, BiLSTM, to exploit its ability in capturing long-term dependencies. It can capture long-term dependencies in time series and is bidirectional modelling. At the same time, we use a convolutional neural network (CNN) to extract features of time series data to better represent and capture patterns and regularity in the data. This method combining BiLSTM and CNN can learn the characteristics of time series data more comprehensively, thus improving the accuracy of prediction. Then,to further improve the performance of the CNN-BiLSTM model, we optimize the model using the whale algorithm WOA. This algorithm is a new optimization algorithm, which has good global search ability and convergence speed, and can complete the optimization of the model in a short time.
Results: Optimizing the CNN-BiLSTM model through the WOA algorithm can reduce its calculation and training speed, improve the prediction accuracy of the smart grid financial market, and improve the prediction ability of the smart grid financial market. Experimental results show that our proposed CNN-BiLSTM model has better prediction accuracy than other models and can effectively deal with the problem of missing historical data in long-term sequence forecasting.
Discussion: This provides necessary help for the development of smart grid financial markets and risk management services, and can promote the development and growth of the smart grid industry. Our research results are of great significance in deep learning, and provide an effective method and idea for solving the financial market forecasting problem of smart grid.
Smart grid financial market refers to the market that provides financial support and risk management services for smart grid construction and operation through financial means and financial tools, with smart grid construction and function as the core and the financial market as the support (Ning et al., 2020). The main participants of the smart grid financial market include financial institutions, smart grid enterprises, investors, and government departments (Ning et al., 2023). The development of a smart grid financial market can promote the diversification of funding sources for smart grid construction and operation, reduce the financing cost of smart grid construction and operation, improve the operational efficiency and safety of smart grid, promote the deep integration of smart grid and financial market, and promote the development and growth of smart grid industry (Xiang et al., 2019). The main business of the smart grid financial market includes: Smart grid project financing. Smart grid asset securitization. Smart grid risk management. Smart grid investment. Smart grid financial innovation. Among them, smart grid asset securitization is one of the important businesses of the smart grid financial market. Packaging smart grid assets into securitized products attracts more investors to participate in smart grid construction and operation to improve the smart grid’s financing and capital utilization efficiency. In short, developing a smart grid financial market will provide more comprehensive and diversified funding sources and risk management services for smart grid construction and operation and promote the development and growth of the smart grid industry. There is a wide variety of smart grid financial market forecasting models, mainly using this model for time series forecasting (Li et al., 2017). The following is a brief overview of some of the models commonly used for smart grid financial market forecasting:
Time series models: ARIMA (Huang et al., 2023), SARIMA (Song et al., 2020), VAR model Cai et al. (2021), etc. These traditional time series models are better for modelling linear relationships, but for modelling nonlinear relationships These traditional time series models are better for modelling linear relations but weaker for modelling nonlinear relations. They need to rely on the assumptions of smoothness and periodicity of time series data, and if these assumptions do not hold, the prediction effect of the models may be affected.
Next, there are neural network models Song et al. (2021): BP neural network Zahid et al. (2019), RBF neural network Hammami et al. (2020) and CNN neural network Zhang et al. (2019), etc.; neural network models can model nonlinear relationships but require a large amount of data for training, and the model is poorly interpretable, making it difficult to explain the decision-making process of the model, while neural network models are prone to the problem of overfitting and require hyperparameter adjustment and regularization, etc.;
Models of machine learning: decision trees Fan et al. (2023), random forests Lin et al. (2020), support vector machines Dai and Zhao (2020), etc. Machine learning models can model nonlinear relationships but require feature engineering to extract useful features. Also, require processing such as hyperparameter adjustment and regularization, and the models are poorly interpretable, making it difficult to explain the decision-making process of the models;
Deep learning-based models: recurrent neural networks Lu and Hong (2019) and long and short-term memory networks Wu et al. (2022), etc. Deep learning-based models can model nonlinear relationships while automatically extracting features, but they require a large amount of data for training, and the models are poorly interpretable, making it difficult to explain the decision process of the model and also prone to overfitting problems;
Bayesian network model Bessani et al. (2020):Bayesian network model can model nonlinear relationships and simultaneously deal with uncertainty. Still, it requires learning Bayesian network structure and estimating parameters, which is more difficult. At the same time, the interpretability of the model could be better, and it is difficult to explain the model’s decision-making process.
At this stage, the widely used and effective temporal prediction model is the long short-term memory network LSTM Chen et al. (2022). Long short-term memory network (LSTM) is a commonly used time-series forecasting model, which can capture important features and trends in a sequence by modelling the long-term dependence of sequence data. However, LSTM models have problems, such as poor processing for long series and poor interpretability. This paper proposes a temporal sequence prediction model based on a bi-directional long and short-term memory network (BiLSTM) to solve these problems. The BiLSTM model adds a reverse layer to the LSTM model, which can better handle contextual information. The bi-directional model can consider past and future information when processing sequence data, making the model capture features and trends in the sequence more accurately. At the same time, the BiLSTM model also has better interpretability, which can help users better understand the model’s decision process. To further improve the model prediction accuracy and reduce the training time and computation, this paper adopts the Whale Algorithm (WOA) to optimize the CNN-BiLSTM network. The WOA algorithm is an emerging optimization algorithm that finds the optimal solution by simulating whales’ foraging behaviour. The WOA algorithm has a faster convergence speed and stronger global search capability than traditional optimization algorithms. In this paper, the WOA algorithm is applied to the optimization of the CNN-BiLSTM network to optimize the model’s prediction effect by adjusting the network’s weights and biases. The experimental results show that the CNN-BiLSTM model optimized with the BiLSTM model and WOA algorithm achieves better performance in temporal sequence prediction. The model can accurately capture the features and trends in the sequences and has better interpretability and higher prediction accuracy. At the same time, the training time and computational effort of the optimized model using the WOA algorithm are effectively reduced, which helps to improve the practicality and application value of the model.
In the rest of this paper, we present recent related work in Section 2. Section 1 offers our proposed methods: overview, convolutional neural network, bi-directional long and short-term memory network BiLSTM, and WOA whale algorithm. Section 4 presents the experimental part, including practical details and comparative experiments. Section 5 concludes.
The VAR model is a Vector Autoregression Model (VAR). It is a widely used method for time series analysis to explore the dynamics between a set of correlated variables. The VAR model assumes that the current value of each variable is correlated with the past matters and the current values of the other variables He and Ye (2022). In the VAR model, each variable is modeled as a linear combination of the other variables. The core idea of the model is to predict the values of multiple variables at the current point in time from the importance of various variables at the past point in time. Zhang et al. (2023) proposed an enterprise supply chain management system based on deep learning and game theory, and achieved good results, further reducing the financial risk and carbon emissions of enterprises. Thus, the VAR model can be used to predict future values of one variable and multiple variables. VAR models can be applied in various fields, such as economics, finance, meteorology, etc., to analyze the relationship between variables and future trends.
BP neural network is a common artificial neural network called back propagation neural network, which is usually used to solve classification and regression problems. BP neural network is a directed graph that consists of an input layer, an output layer, and at least one hidden layer. In the network, each neuron is connected to all neurons in the previous layer, and each connection has a weight. The BP algorithm adjusts the weights by backpropagation error to make the network output results closer to the actual results Li et al. (2023).
The training process of the BP neural network is usually divided into two stages: forward propagation and backward propagation. In the forward propagation process, the input signal reaches the output layer from the input layer through the hidden layer and generates the network output result. The error between the network output result and the actual result is calculated in the backpropagation process. The error is propagated backward from the output layer to the input layer. Finally, the weight of each connection is adjusted to reduce the error. BP neural networks have many applications, such as image recognition, natural language processing, speech recognition, financial prediction, and other fields. However, the training process of BP neural networks usually requires a lot of computational resources and time and is prone to overfitting problems. In recent years, significant breakthroughs have been made in developing deep learning technology, and deep neural networks have become important tools for various application areas.
Bayesian Network (BN) is a probabilistic graphical model for representing probabilistic dependencies between variables. It usually uses directed acyclic graphs (DAGs) to define conditional dependencies between variables. Each node represents a variable, and each edge represents a conditional probability. The combination of nodes and edges forms a directed acyclic graph Bessani et al. (2020). Bayesian network models have two types of nodes: random variable nodes and parameter nodes. The random variable nodes represent the variables in the model, and the parameter nodes represent the parameters in the model, such as the mean and variance. Each random variable node has a conditional probability distribution that represents the probability distribution of that node given its parent node. In Bayesian networks, we can use Bayes’ theorem to compute the posterior probabilities. Suppose we want to calculate the probability distribution of a variable given certain conditions of evidence; we can use Bayes’ formula to do so.
Bayesian networks can be used in various applications such as risk assessment, medical diagnosis, financial analysis, natural language processing, etc. It has the advantages of simple modeling, good interpretability, and good generalization ability.
In this paper, we use the WOA-CNN-BiLSTM model to predict changes in the financial market of smart grids, first combining the advantages of the CNN and BiLSTM models to incorporate into the CNN-BiLSTM model. Using the WOA whale algorithm to optimize the model and finally integrating it into the WOA-CNN-BiLSTM model, after training, the model is used to predict the financial market of the smart grid; the overall flow of the model is shown in Figure 1:

FIGURE 1. Overall flow chart of WOA-CNN-BiLSTM network.
After the data input in Figure 1 enters the CNN module, extracting the text’s key features with the help of the CNN network elements, then passes through the Dropout layer to avoid overfitting the neural network. The obtained characteristics are fed into the bidirectional long and short-term memory network to get the temporal information of the text for the prediction of the smart grid financial market. Then it is processed by the fully connected layer and normalization, optimized by the WOA layer, and finally, the prediction results are output.
Convolutional Neural Network (CNN) is a deep learning algorithm commonly used in image recognition, computer vision, natural language processing, etc Yang et al. (2023). The main features of CNN are its ability to automatically extract features from data and its parameter sharing and sparse connectivity. It consists of several convolutional, pooling, and fully connected layers (Cheng et al., 2023). In the convolutional layer, CNN extracts the features of an image by convolving the input data using a convolutional kernel. In the pooling layer, the CNN improves the features’ robustness by reducing the feature map’s size. Finally, in the fully connected layer, CNN classifies the pooled feature maps by feeding them into a fully connected neural network. A flowchart of the CNN network is shown in Figure 2:
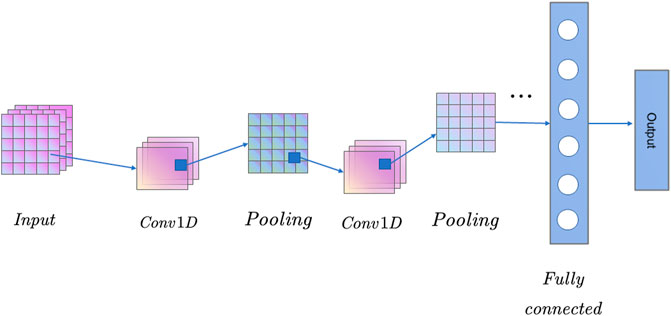
FIGURE 2. CNN network operation flow chart (This article uses one-dimensional convolution, after two convolutions and pooling, and finally output through the fully connected layer).
CNN can effectively reduce the number of parameters in a neural network and avoid the phenomenon of overfitting, thus improving the model’s generalization ability. In addition, CNNs can also quickly build models with powerful recognition capabilities through pre-training techniques and migration learning. One-dimensional CNN has the same structure and processing method as multidimensional CNN. Still, the difference lies in the number of dimensions of the input data and the way the convolution kernel slides over the data.
where: i is the serial number of the convolution kernel, c is the bias of the convolution kernel, Y(i) is the result of the ith convolution operation, x is the input data, ω is the corresponding weight, n is the dimension of the input data.
BiLSTM (Bidirectional Long Short-Term Memory) is a bi-directional recurrent neural network model that combines the advantages of LSTM (Long Short-Term Memory) and a bi-directional recurrent neural network. BiLSTM model can consider both forward and backward contextual information, thus better capturing the long-term dependencies in the sequence. The flow chart of the BiLSTM model is shown in Figure 3:
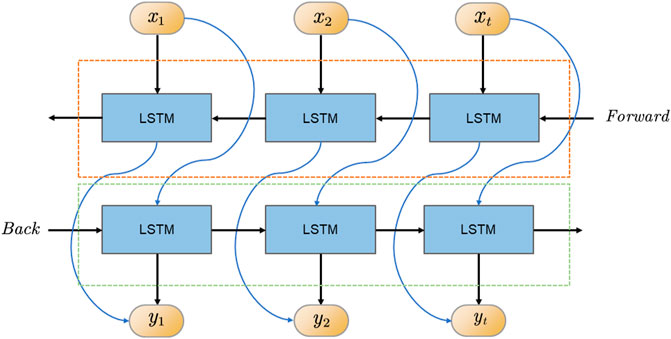
FIGURE 3. Flow chart of two-way long and short-term memory network (This article uses a two-way structure, which can better identify past and future texts and improve prediction accuracy).
The input to the BiLSTM model is a sequence, and each element is a vector. Each piece is fed into an LSTM cell for processing in the model. The LSTM cell can remember the previous state and update the state and output based on the current and last input. In the BiLSTM model, each element is fed into two LSTM units: a forward LSTM unit and a backward LSTM unit. The bold LSTM cell starts processing from the first element of the sequence Munawar et al. (2022), and the back LSTM cell starts processing from the last part. Ultimately, the output of the BiLSTM model is a stitching of the results of the forward and backward LSTM units. The BiLSTM model performs well in natural language processing tasks like sentiment analysis, named entity recognition, machine translation, etc.
BiLSTM is used to extract periodic features from the load data, and the BiLSTM network is used to calculate the forward and backward propagation states, respectively, as follows:
Where:
The WOA (Whale Optimization Algorithm) whale algorithm is an optimization algorithm based on the behavior of whale populations, proposed by Mirjalili et al., in 2016. The algorithm simulates the food-seeking behavior of a whale population and searches for the optimal solution through continuous search and iteration Adetunji et al. (2020). The basic idea of the WOA algorithm is to divide the whale population into three categories: leader whales, follower whales, and peripheral whales. The leader whales are the individuals with the optimal solution in the whole group, and their positions and fitness values play a decisive role in the search direction of the entire group. The follower whales update their posts by imitating the behavior of the leader whales, while the peripheral whales search for a better solution by random search (Zhu et al., 2020).
First, for the whale to surround the prey before spitting bubbles, swimming in a straight line, the individual whale tends to the optimal personal position, a certain range of space for the roundup; the formula is as follows:
Where:
Another whale predation model is bubble spitting predation, an optimization algorithm based on the behavior of whale populations. First, the distance between each individual within the people and the optimal individual is calculated and then constrained according to the mathematical modeling formula of spitting bubbles. Then, the search space is restricted to the helix according to the idea of local search to find the optimal solution. The bubble helix modeling is shown in Figure 4:
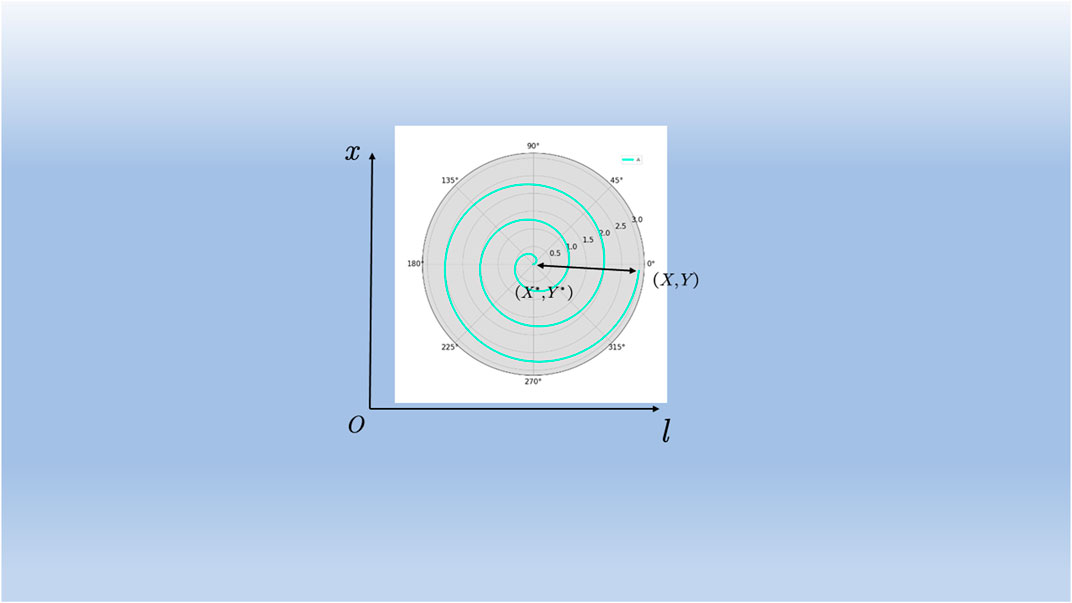
FIGURE 4. WOA helix position search range.
The search formula for this mechanism is as follows:
Based on the characteristics of the smart grid financial market, this paper selected four datasets Smart grid control systems (SGCSs) datasets, National Renewable Energy Laboratory (NREL), Dow Jones and S&P 500, one directly from the smart grid financial market, one from the energy market and two from the financial market.
Smart Grid Control Systems (SGCS) are advanced computer-based systems that help manage and control the grid more efficiently Ben Youssef (2022). They use modern communication technologies and advanced analytics to monitor the grid’s performance and make real-time adjustments to optimize energy delivery. SGCSs are designed to provide a range of features, including: Monitoring and controlling tides: SGCSs are equipped with sensors and smart meters that allow them to monitor energy flows in real-time. They can detect interruptions or anomalies and adjust the power flow to minimize consumer impact. Demand Response: SGCS can help manage peak demand by encouraging consumers to shift their usage to off-peak hours. They can also prioritize certain areas of the grid to prevent outages or power drops. Renewable energy grid integration: SGCS can manage renewable energy grid integration. This allows for more efficient use of renewable energy sources and reduces reliance on traditional power sources. Fault detection and isolation: SGCS can detect faults in the grid and isolate affected areas to prevent cascading faults and widespread outages. Asset Management: SGCS monitors the health of grid assets and predicts maintenance needs to reduce downtime and improve reliability.
Overall, SGCSs play a key role in ensuring the reliability and efficiency of the modern grid. They are important for managing the transition to a more sustainable renewable energy future.
The National Renewable Energy Laboratory (NREL) is a research laboratory in Golden, Colorado, United States, dedicated to developing and disseminating renewable energy and energy efficiency technologies Singh and Mahajan (2021). It is part of the U.S. Department of Energy’s (DOE) National Laboratory Network. NREL’s research activities cover a wide range of renewable energy and energy efficiency areas, including solar, wind, geothermal, hydrogen, fuel cells, energy storage, bioenergy, and advanced manufacturing. The laboratory conducts research in materials science, engineering, and technology development, as well as analysis and modeling of renewable energy systems and markets. NREL also operates several test and evaluation facilities, including the National Wind Energy Technology Center, the National Bioenergy Center, and the Energy Systems Integration Facility. These facilities enable researchers and industry partners to test and validate new renewable energy technologies under realistic conditions. In addition to its research activities, NREL provides technical assistance and information to help individuals, businesses, and government agencies adopt renewable energy and energy efficiency technologies. This includes training and workshops, developing tools and resources, and providing technical support for renewable energy projects.
Overall, NREL is a key player in developing and diffusing renewable energy and energy efficiency technologies in the United States and worldwide.
The Dow Jones Index, also known as the Dow Jones Industrial Average (Dow Jones), is a stock market index created by Dow Jones & Company in 1896 Metlek (2022). It is one of the indices used to reflect the overall situation of the U.S. stock market and is one of the world’s most famous stock market indices. The Dow Jones Index consists of 30 stocks of publicly traded companies representing the major sectors of the U.S. economy. These companies cover various industries, such as finance, retail, manufacturing, and energy, and include large, well-known U.S. companies such as Apple, Microsoft, and Coca-Cola. At the end of each trading day, the gains and losses of the Dow Jones are widely reported and become one of the key indicators of market conditions. It is important to note that the Dow Jones does not represent the entire U.S. stock market, as it only selects 30 stocks and is based on a price-weighted index, meaning that companies with higher stock prices have a greater impact on the index. Therefore, some believe that the S&P 500 is a better reflection of the overall U.S. stock market.
The S&P 500 Index (S&P 500 Index) is a stock market index compiled by Standard & Poor’s, which selects a sample of 500 large U.S. companies, including companies in various industries from NASDAQ to NYSE, to reflect the overall U.S Bera et al. (2020). stock market. The S&P 500 is a market capitalization-weighted index calculated by adding up the market capitalization of each company and then assigning index weights proportionally. This calculation method allows companies with larger market capitalizations to have a greater impact on the index, while companies with smaller market capitalizations have a smaller effect on the index. The S&P 500 is one of the most representative indices of the U.S. stock market and one of the world’s most famous stock market indices. It is widely used in investment management, stock market analysis, and asset allocation. The S&P 500 is also the reference index for many funds, exchange-traded funds (ETFs), and financial derivatives, and investors can track the index’s performance by purchasing funds or ETFs.
Smart grid financial market forecast indicators can involve several aspects: such as smart grid market size, policy environment, technological innovation, competitive landscape, consumer demand, energy prices, global economic situation, and seven categories of primary indicators, which can be divided into several secondary hands, in Table 1, this paper selects the indicators of which, as the input variables of the model.
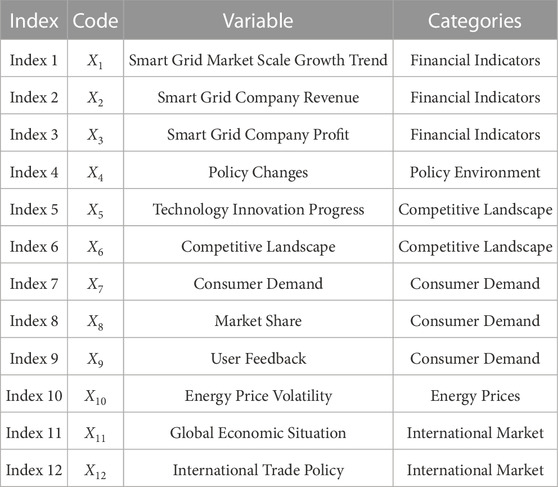
TABLE 1. Key indicators of smart grid investment.
To test the running effectiveness of our models, we choose three baseline models, LSTM, CNN-LSTM, CNN-BiLSTM, and five innovative models Bit et al., Dia et al. Then we also test the accuracy and recall (Precision & Recall) of different models; the model’s prediction accuracy is one of the important indicators of the model, which can be a good measure of the model’s performance. Secondly, we will also compare the lift value and the amount of operations Flops (G) of different models; the larger the lift (lift index), the better the model. The smaller the value of Flops(G), the less the number of text processed by the model, and the faster the training and computing speed. Finally, we compare different models’ stability index (population stability index), PSI, on other datasets.
In Figure 5, we compare the inference speed of different models in two simple datasets, Dow Jones for dataset 1 and S&P 500 for dataset 2. In Figure 5, we compare the inference speed of LSTM Stryczek and Natkaniec (2023) and CNN-LSTM Kuyumani et al. (2023): CNN-BiLSTM Yanmei et al. (2023) and our model for different amounts of historical data. Similarly, in Fig. b, we compare the inference speed of Bitirgen and Filik (2023), Diaba and Elmusrati (2023), BiLSTM, CNN-LSTM, Bit et al., and our model for a total of six models, and the results show that our model outperforms the other models in terms of inference speed, both in dataset 1 and in dataset 2.
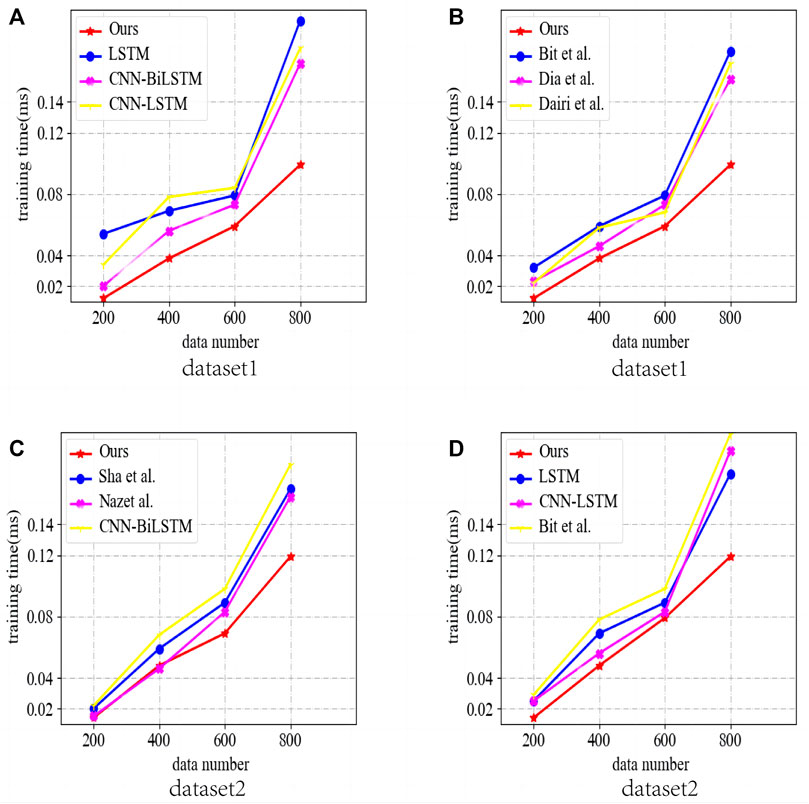
FIGURE 5. Comparison of inference speed of different models in different datasets (Dataset 1 is the Dow Jones index (Dow Jones), and dataset 2 is the S & P 500 index (S & P 500), both of which are simpler datasets because they have only financial variables, (A,B) are from data set 1, (C,D) from Dataset 2).
Figure 6 compares the inference speed of different models in more complex datasets. The ability to handle complex datasets is one of the important metrics of time series forecasting models, where Figure 6A compares the number of inferences of four models, LSTM, CNN-LSTM, Bit et al., and our model in dataset 3, Figure 6B compares the number of assumptions of three models, LSTM, CNN-LSTM, CNN-BiLSTM and our model in dataset 3, Figure 6C compares the number of inferences of three models, Bit et al. CNN-BiLSTM and our model for different historical data on dataset 3. Figure 6C reaches the inference speed of Bit et al., Dia et al., and Dairi et al. (2023). The results show that the inference speed of our model is still faster than other models in complex datasets, showing good generalization.
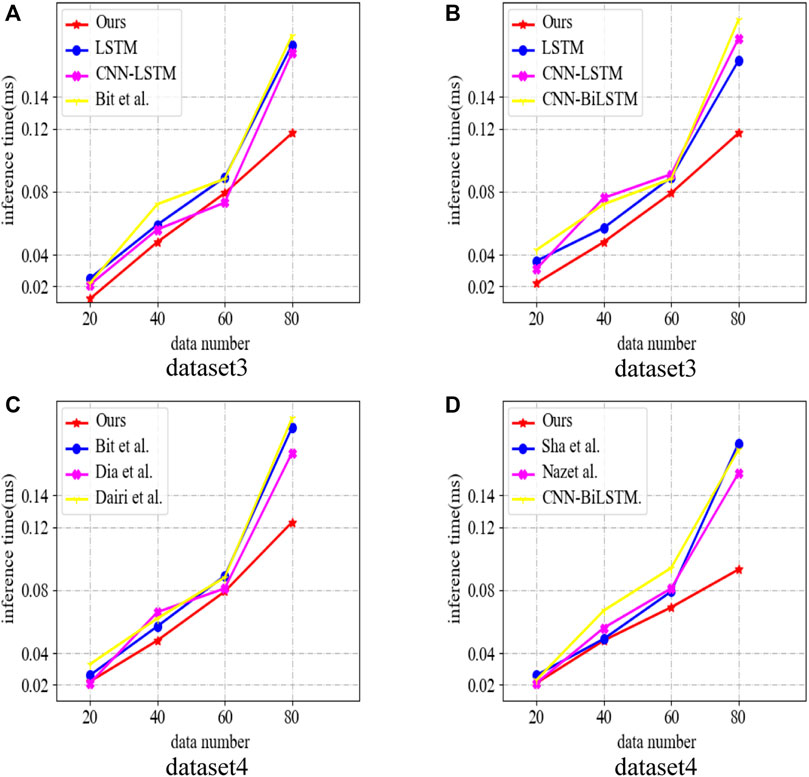
FIGURE 6. Comparison of inference speed of different models in different datasets (dataset 3 is Smart grid control systems (SGCSs) datasets, and dataset 4 is National Renewable Energy Laboratory (NREL) datasets, because these two datasets contain indicators of the policy environment, technological innovation, competitive landscape, consumer demand, energy prices, etc., and are therefore more complex datasets, (A,B) are from data set 3, (C,D) from Dataset 4).
In Figure 7, we compare the accuracy and Recall of different models for different data, where accuracy is the ratio of the number of relevant documents retrieved to the total number of records retrieved, which measures the accuracy of the retrieval system. The Recall is the ratio of the number of relevant documents retrieved to the total number of relevant documents in the document library, which measures the completeness of the retrieval system. Both values are between 0 and 1; the closer the matter is to 1, the higher the accuracy or completeness rate. In Figure 7A, we compare the Precision and Recall (Precision & Recall) of LSTM, CNN-LSTM, CNN-BiLSTM, Bit et al., and in Figure 7B, we compare the Precision and Recall (Precision & Recall) of LSTM, CNN-LSTM, CNN-BiLSTM, Bit et al., Dia et al., Dairi et al., Shanmugapriya and Baskaran (2023), Nazir et al. (2023) and our models on Dataset 3 and Dataset 4. Recall). The results show that the Precision and Recall (Precision & Recall) of our model, in all four datasets, are better than the other models, showing strong generalization and accuracy.
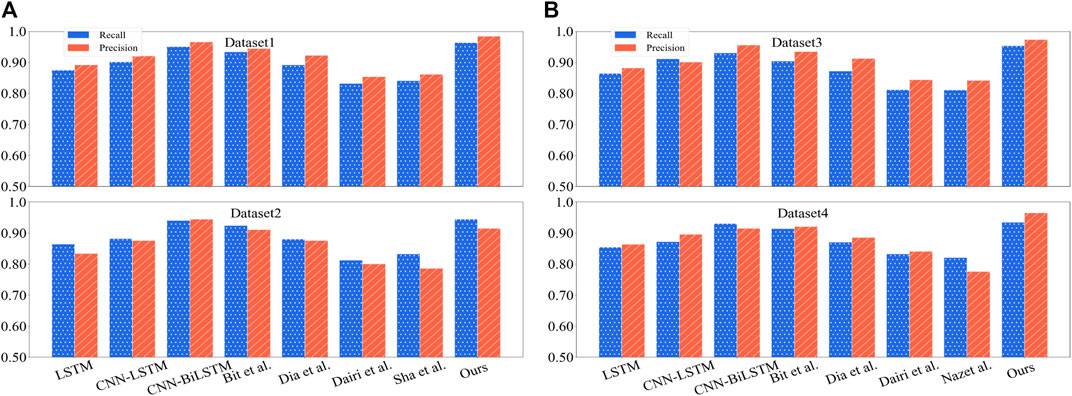
FIGURE 7. Comparison of Recall Precision values for different models in different datasets (Dataset 1 is Dow Jones, Dataset 2 is S & P 500, Dataset 3 is Smart grid control systems (SGCSs) datasets, Dataset 4 is National Renewable Energy Laboratory (NREL) datasets, (A) are from data set 1 and 2, (B) from Dataset 3 and 4).
In Figure 8, we compare the amount of operations Flops (G) of different models; the size of the functions of a model is one of the important indicators of model performance. Therefore, we compare the LSTM, CNN-LSTM, CNN-BiLSTM, Bit et al., and Dia et al. The results show that after the feature extraction of CNN and the optimization of the WOA whale algorithm, our model’s operations are significantly reduced compared with other models, which means that our model’s training time and prediction time can be shorter. The performance of our model is This means that our model’s training time and forecast time can be faster, and the version of our model is better than other models.
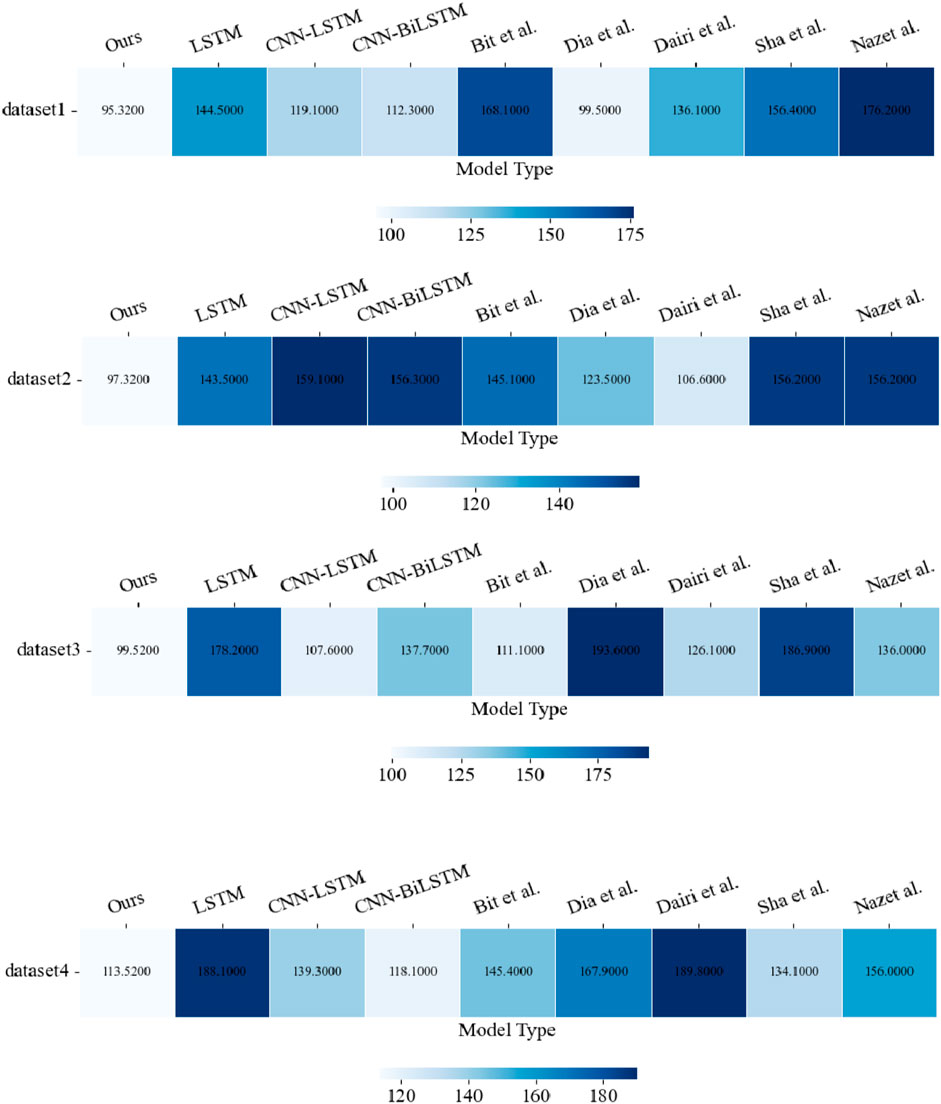
FIGURE 8. Comparison of different models in different datasets (Dataset 1 is Dow Jones, Dataset 2 is S&P 500, Dataset 3 is Smart grid control systems (SGCSs) datasets, Dataset 4 is National Renewable Energy Laboratory (NREL) datasets).
In Figure 9, we compare the Lift values of different models, and the lift metric is more intuitive and easy to understand in practical applications. It can be used to measure the effectiveness of a model for a specific group of a certain size based on business requirements. In a given scenario, the binary classification model has a random rate, representing the probability of an unexpectedly positive response or the proportion of actual positive samples to the entire piece (equivalent to empirical data). With a classification model, the population can be effectively targeted. ”Valid” means that the proportion of positive observations in the top ranking (e.g., top 0.1) is higher than the random rate when all words are ranked in descending order of predicted probability. Boosting can be calculated as the proportion of positive observations among the top comments to the random rate. The numerator is the capture rate. The higher the lift value, the better the performance of the model. X-axis numbers 1 to 9 represent this model LSTM, CNN-LSTM, CNN-BiLSTM, Bit et al., Dia et al., Dairi et al., Sha et al., Nazet al., and our model, respectively. The results show that the lift value of our model is significantly higher in four different data sets. The results show that our model has substantially higher Lift values in four different data sets than the other models, which means that our model has the ”better” predictive power and the model best runs.
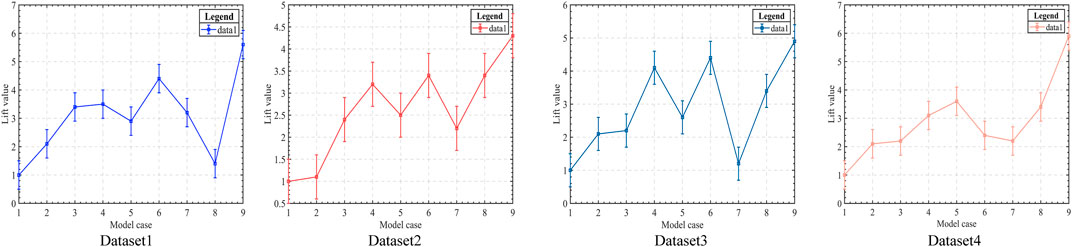
FIGURE 9. Comparison of Lift values for different models (The lift curve measures how much ”better” the model is at predicting compared to not using the model; the larger the lift, the better the model runs.
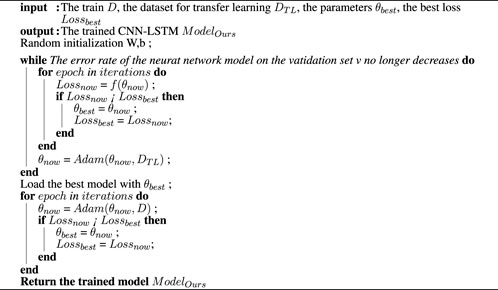
This is the flow chart of the model Algorithm 1; first input the historical data of the smart grid financial market, preprocess and normalize the data at the data input layer, and then put the data set into a one-dimensional CNN unit for feature Extract and process the data set to reduce the dimensionality, and then input the feature data into the BiLSTM layer to learn the historical data of the smart grid financial market, and then optimize the WOA whale algorithm to obtain the optimal parameters of the model, improve the accuracy of prediction, and increase the reasoning time, and finally output the predicted value.
Algorithm 1.
In Figure 10, we use a scatter plot to more visually compare the PSI values of our model when the number of inferences varies. The sample stability index (PSI) is commonly used to measure the stability of a sample. For example, if the model is stable between 2 months, a PSI value of less than 0.1 for a variable indicates that the change is less significant. If the PSI value is between 0.1 and 0.25, it means a more substantial change. If the PSI value is greater than 0.25, the variable changes more dramatically and requires special attention. As can be seen from the figure, even with a higher number of inferences, the stability of our model’s operation still has a better performance compared to other models, and the strength of our model has a good performance in different data sets, which is due to the high convergence speed and global search capability of the Whale Algorithm (WOA), and after optimization using the Whale Algorithm (WOA), the operation of our model’s stability is significantly better than other models.
Table 2 compares the accuracy, computation, and parameter size of the models mentioned in the paper with our model. The table shows that our model has significant advantages in these aspects.
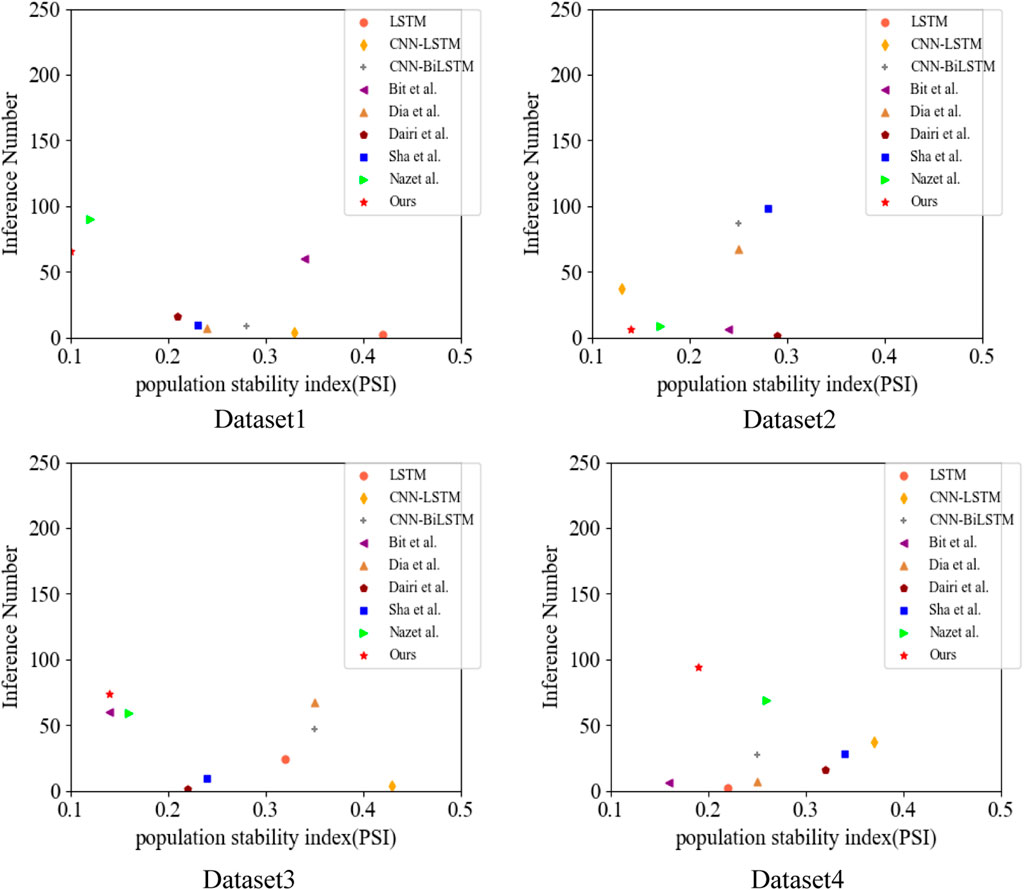
FIGURE 10. Comparison of population stability index, PSI for different models on different datasets (dataset 1 is Dow Jones, dataset 2 is S&P 500, dataset 3 is Smart grid control systems (SGCSs) datasets, and National Renewable Energy Laboratory (NREL) datasets for dataset 4).

TABLE 2. A comparison of different models.
This paper uses a WOA-based CNN-BiLSTM model to predict the smart grid financial market. Firstly, it is determined that the long short-term memory network model (LSTM), which performs better in long-term prediction, is used. Then, the bi-directional long short-term memory network model (BiLSTM) to consider both forward and backward contextual information is more applicable for the smart grid financial market, and then the one-dimensional CNN network is selected by combining the feature selection characteristics of convolutional neural network (CNN) for historical data filtering, optimizing the input data of BiLSTM for shorter training time, faster prediction, and higher accuracy of prophecy, and finally the Whale Algorithm (WOA) with higher convergence speed and global search capability, which is suitable for solving a variety of optimization problems. Combining it with the CNN- BiLSTM model, the advantages of WOA can effectively solve the problem of missing historical data that may occur in the BiLSTM network in the prediction of long time series, which leads to the reduction of prediction accuracy, and also has the advantages of speeding up the model operation, improving the AUC value and reducing the operation volume.
The contribution points of this paper are as follows.
• Compared with traditional time series models, our model has improved the prediction accuracy of the smart grid financial market due to the inherent advantages of deep learning models and the optimization of other models.
•Compared with neural network models such as BP neural network, RBF neural network, and CNN neural network, our model is much more interpretable. With the dimensionality reduction of the CNN network, our model is much less computationally intensive than neural network models.
•Compared with deep learning models, including recurrent neural networks and long and short-term memory networks, etc., our model can avoid the problem of missing historical data when dealing with a large amount of historical data, thus improving the model’s prediction accuracy.
At the same time, the method in this paper still has some limitations; compared with other deep learning algorithms, its training speed is greatly accelerated, but the reduction of computing is not very obvious at the same time because this paper combines three models, the overall structure of the model framework has some complex, for the above problems, our sub-module test comparison, continue to optimize each module, compared with other deep learning algorithms. Based on the LSTM model, we look for modules that are more suitable for solving the smart grid financial market prediction.
Smart grid financial market prediction also helps to promote the rapid development of smart grid-related industries. With the rapid changes in the energy industry, smart grid technologies and solutions have become the focus of many companies Li et al. (2020); ? The rapid development of this technology has brought a lot of investment opportunities and business opportunities, but there are also certain investment risks. By forecasting the smart grid financial market, investors can better understand the risks and opportunities of the market and develop investment strategies accordingly. For example, predicting future market demand and supply conditions can help investors decide which areas are more promising and which should be avoided. Policymakers can use financial market forecasts to facilitate the rapid development of smart grids. Policy-making requires understanding market demand and conditions and forecasting future market trends to develop appropriate policies and measures. By predicting the direction of the smart grid financial market, policymakers can better plan future policies to promote industry development. Entrepreneurs can use financial market forecasts to adjust their strategies and investments to adapt to future market changes. For example, based on market forecasts, companies can decide whether to enter a new market, adopt a new marketing strategy, or adjust their product lines.
In summary, smart grid financial market forecasting is important for promoting the sustainable development of smart grids. Our work can help investors, policymakers, and entrepreneurs better understand market trends and future directions to make more informed decisions and promote the rapid development of the smart grid industry.
The original contributions presented in the study are included in the article/supplementary material, further inquiries can be directed to the corresponding author.
GN, XZ, and XN contributed to conception and design of the study. XC organized the database. XM performed the statistical analysis. GN wrote the first draft of the manuscript. XZ, GN, XC, and XN wrote sections of the manuscript. All authors contributed to manuscript revision, read, and approved the submitted version. All authors listed have made a substantial, direct, and intellectual contribution to the work and approved it for publication.
The authors declare that the research was conducted in the absence of any commercial or financial relationships that could be construed as a potential conflict of interest.
All claims expressed in this article are solely those of the authors and do not necessarily represent those of their affiliated organizations, or those of the publisher, the editors and the reviewers. Any product that may be evaluated in this article, or claim that may be made by its manufacturer, is not guaranteed or endorsed by the publisher.
Adetunji, K., Hofsajer, I., and Cheng, L. (2020). “A coordinated charging model for electric vehicles in a smart grid using whale optimization algorithm,” in Proceeding of the 2020 IEEE 23rd International Conference on Information Fusion (FUSION), Rustenburg, South Africa, July 2020 (IEEE), 1–7.
Ben Youssef, N. E. H. (2022). Analytical analysis of information-centric networking in smart grids. Int. J. Wirel. Inf. Netw. 29, 354–364. doi:10.1007/s10776-022-00565-8
Bera, B., Saha, S., Das, A. K., and Vasilakos, A. V. (2020). Designing blockchain-based access control protocol in iot-enabled smart-grid system. IEEE Internet Things J. 8, 5744–5761. doi:10.1109/jiot.2020.3030308
Bessani, M., Massignan, J. A., Santos, T. M., London, J. B., and Maciel, C. D. (2020). Multiple households very short-term load forecasting using bayesian networks. Electr. Power Syst. Res. 189, 106733. doi:10.1016/j.epsr.2020.106733
Bitirgen, K., and Filik, Ü. B. (2023). A hybrid deep learning model for discrimination of physical disturbance and cyber-attack detection in smart grid. Int. J. Crit. Infrastructure Prot. 40, 100582. doi:10.1016/j.ijcip.2022.100582
Cai, W., Liu, D., Ning, X., Wang, C., and Xie, G. (2021). Voxel-based three-view hybrid parallel network for 3d object classification. Displays 69, 102076. doi:10.1016/j.displa.2021.102076
Chen, B.-R., Liu, Z., Song, J., Zeng, F., Zhu, Z., Bachu, S. P. K., et al. (2022). “Flowtele: Remotely shaping traffic on internet-scale networks,” in Proceedings of the 18th International Conference on emerging Networking EXperiments and Technologies, November 2022 (ACM), 349–368.
Cheng, K., Huang, Z., Wang, P., Sun, L., Ghasemi, H., Ardebili, H., et al. (2023). Antibacterial flexible triboelectric nanogenerator via capillary force lithography. J. Colloid Interface Sci. 630, 611–622. doi:10.1016/j.jcis.2022.10.129
Dai, Y., and Zhao, P. (2020). A hybrid load forecasting model based on support vector machine with intelligent methods for feature selection and parameter optimization. Appl. energy 279, 115332. doi:10.1016/j.apenergy.2020.115332
Dairi, A., Harrou, F., Bouyeddou, B., Senouci, S.-M., and Sun, Y. (2023). “Semi-supervised deep learning-driven anomaly detection schemes for cyber-attack detection in smart grids,” in Power systems cybersecurity: Methods, concepts, and best practices (Springer), 265–295.
Diaba, S. Y., and Elmusrati, M. (2023). Proposed algorithm for smart grid ddos detection based on deep learning. Neural Netw. 159, 175–184. doi:10.1016/j.neunet.2022.12.011
Fan, X., Zhao, S., Zhang, X., and Meng, L. (2023). The impact of improving employee psychological empowerment and job performance based on deep learning and artificial intelligence. J. Organ. End User Comput. (JOEUC) 35, 1–14. doi:10.4018/joeuc.321639
Hammami, Z., Sayed-Mouchaweh, M., Mouelhi, W., and Ben Said, L. (2020). Neural networks for online learning of non-stationary data streams: A review and application for smart grids flexibility improvement. Artif. Intell. Rev. 53, 6111–6154. doi:10.1007/s10462-020-09844-3
He, F., and Ye, Q. (2022). A bearing fault diagnosis method based on wavelet packet transform and convolutional neural network optimized by simulated annealing algorithm. Sensors 22, 1410. doi:10.3390/s22041410
Huang, H., Shen, B., Zhong, L., and Zhou, Y. (2023). “Protecting data integrity of web applications with database constraints inferred from application code,” in Proceedings of the 28th ACM International Conference on Architectural Support for Programming Languages and Operating Systems, Volume 2, January 2023 (ACM), 632–645.
Kuyumani, E., Hasan, A. N., and Shongwe, T. (2023). A hybrid model based on cnn-lstm to detect and forecast harmonics: A case study of an eskom substation in South Africa. Electr. Power Components Syst. 1–15, 746–760. doi:10.1080/15325008.2023.2181883
Li, Y., Shen, B., Zhang, J., Gan, X., Wang, J., and Wang, X. (2017). Offloading in hcns: Congestion-aware network selection and user incentive design. IEEE Trans. Wirel. Commun. 16, 6479–6492. doi:10.1109/twc.2017.2724027
Li, Y., Wang, C., and Li, G. (2020). A mini-review on high-penetration renewable integration into a smarter grid. Front. Energy Res. 8, 84. doi:10.3389/fenrg.2020.00084
Li, C., Chen, Z., and Jiao, Y. (2023). Vibration and bandgap behavior of sandwich pyramid lattice core plate with resonant rings. Materials 16, 2730. doi:10.3390/ma16072730
Lin, R., Pei, Z., Ye, Z., Wu, B., and Yang, G. (2020). A voted based random forests algorithm for smart grid distribution network faults prediction. Enterp. Inf. Syst. 14, 496–514. doi:10.1080/17517575.2019.1600724
Lu, R., and Hong, S. H. (2019). Incentive-based demand response for smart grid with reinforcement learning and deep neural network. Appl. energy 236, 937–949. doi:10.1016/j.apenergy.2018.12.061
Metlek, S. (2022). Forecasting of dow jones sukuk index prices using artificial intelligence systems. Economic computation & economic cybernetics studies & research 56.
Munawar, S., Javaid, N., Khan, Z. A., Chaudhary, N. I., Raja, M. A. Z., Milyani, A. H., et al. (2022). Electricity theft detection in smart grids using a hybrid bigru–bilstm model with feature engineering-based preprocessing. Sensors 22, 7818. doi:10.3390/s22207818
Nazari, M., Nazifi, S., Huang, Z., Tong, T., Ouro-Koura, H., Bao, J., et al. (2020). Surface tension nanogates for controlled ion transport. ACS Appl. Nano Mater. 3, 6979–6986. doi:10.1021/acsanm.0c01304
Nazir, A., Shaikh, A. K., Shah, A. S., and Khalil, A. (2023). Forecasting energy consumption demand of customers in smart grid using temporal fusion transformer (tft). Results Eng. 17, 100888. doi:10.1016/j.rineng.2023.100888
Ning, X., Duan, P., Li, W., and Zhang, S. (2020). Real-time 3d face alignment using an encoder-decoder network with an efficient deconvolution layer. IEEE Signal Process. Lett. 27, 1944–1948. doi:10.1109/lsp.2020.3032277
Ning, X., Tian, W., He, F., Bai, X., Sun, L., and Li, W. (2023). Hyper-sausage coverage function neuron model and learning algorithm for image classification. Pattern Recognit. 136, 109216. doi:10.1016/j.patcog.2022.109216
Shanmugapriya, J., and Baskaran, K. (2023). Rapid fault analysis by deep learning-based pmu for smart grid system. Intelligent Automation Soft Comput. 35, 1581–1594. doi:10.32604/iasc.2023.024514
Singh, N. K., and Mahajan, V. (2021). End-user privacy protection scheme from cyber intrusion in smart grid advanced metering infrastructure. Int. J. Crit. Infrastructure Prot. 34, 100410. doi:10.1016/j.ijcip.2021.100410
Song, Z., Mellon, G., and Shen, Z. (2020). Relationship between racial bias exposure, financial literacy, and entrepreneurial intention: An empirical investigation. J. Artif. Intell. Mach. Learn. Manag. 4, 42–55.
Song, Z., Johnston, R. M., and Ng, C. P. (2021). Equitable healthcare access during the pandemic: The impact of digital divide and other sociodemographic and systemic factors. Appl. Res. Artif. Intell. Cloud Comput. 4, 19–33.
Stryczek, S., and Natkaniec, M. (2023). Internet threat detection in smart grids based on network traffic analysis using lstm, if, and svm. Energies 16, 329. doi:10.3390/en16010329
Wu, S., Wang, J., Ping, Y., and Zhang, X. (2022). “Research on individual recognition and matching of whale and dolphin based on efficientnet model,” in Proceeding of the 2022 3rd International Conference on Big Data, Artificial Intelligence and Internet of Things Engineering (ICBAIE), Xi’an, China, July 2022 (IEEE), 635–638.
Xiang, C., Wu, Y., Shen, B., Shen, M., Huang, H., Xu, T., et al. (2019). “Towards continuous access control validation and forensics,” in Proceedings of the 2019 ACM SIGSAC conference on computer and communications security, November 2019 (ACM), 113–129. doi:10.1145/3319535.3363191
Yang, Z., Sun, L., Sun, Y., Dong, Y., and Wang, A. (2023). A conceptual model of home-based cardiac rehabilitation exercise adherence in patients with chronic heart failure: A constructivist grounded theory study. Patient Prefer. adherence 17, 851–860. doi:10.2147/ppa.s404287
Yanmei, J., Mingsheng, L., Yangyang, L., Yaping, L., Jingyun, Z., Yifeng, L., et al. (2023). “Enhanced neighborhood node graph neural networks for load forecasting in smart grid,” in International journal of machine learning and cybernetics (Springer), 1–20. doi:10.1007/s13042-023-01796-8
Zahid, M., Ahmed, F., Javaid, N., Abbasi, R. A., Zainab Kazmi, H. S., Javaid, A., et al. (2019). Electricity price and load forecasting using enhanced convolutional neural network and enhanced support vector regression in smart grids. Electronics 8, 122. doi:10.3390/electronics8020122
Zhang, R., Zeng, F., Cheng, X., and Yang, L. (2019). “Uav-aided data dissemination protocol with dynamic trajectory scheduling in vanets,” in Proceeding of the ICC 2019-2019 IEEE International Conference on Communications (ICC), Shanghai, China, May 2019 (IEEE), 1–6.
Zhang, H., Zhang, F., Gong, B., Zhang, X., and Zhu, Y. (2023). The optimization of supply chain financing for bank green credit using stackelberg game theory in digital economy under internet of things. J. Organ. End User Comput. (JOEUC) 35, 1–16. doi:10.4018/joeuc.318474
Keywords: WOA, CNN, BiLSTM, smart grid, financial market forecasting
Citation: Ni G, Zhang X, Ni X, Cheng X and Meng X (2023) A WOA-CNN-BiLSTM-based multi-feature classification prediction model for smart grid financial markets. Front. Energy Res. 11:1198855. doi: 10.3389/fenrg.2023.1198855
Received: 02 April 2023; Accepted: 04 May 2023;
Published: 16 May 2023.
Edited by:
Praveen Kumar Donta, Vienna University of Technology, AustriaReviewed by:
Lia Elena Aciu, Transilvania University of Brașov, RomaniaCopyright © 2023 Ni, Zhang, Ni, Cheng and Meng. This is an open-access article distributed under the terms of the Creative Commons Attribution License (CC BY). The use, distribution or reproduction in other forums is permitted, provided the original author(s) and the copyright owner(s) are credited and that the original publication in this journal is cited, in accordance with accepted academic practice. No use, distribution or reproduction is permitted which does not comply with these terms.
*Correspondence: Guofeng Ni, MDgwMjYwQHNkeXUuZWR1LmNu
Disclaimer: All claims expressed in this article are solely those of the authors and do not necessarily represent those of their affiliated organizations, or those of the publisher, the editors and the reviewers. Any product that may be evaluated in this article or claim that may be made by its manufacturer is not guaranteed or endorsed by the publisher.
Research integrity at Frontiers
Learn more about the work of our research integrity team to safeguard the quality of each article we publish.