 Peng Tao
 Hao Ma
- State Grid Hebei Marketing Service Center, Shijiazhuang, China
In recent years, the reduction of high carbon emissions has become a paramount objective for industries worldwide. In response, enterprises and industries are actively pursuing low-carbon transformations. Within this context, power systems have a pivotal role, as they are the primary drivers of national development. Efficient energy scheduling and utilization have therefore become critical concerns. The convergence of smart grid technology and artificial intelligence has propelled transformer load forecasting to the forefront of enterprise power demand management. Traditional forecasting methods relying on regression analysis and support vector machines are ill-equipped to handle the growing complexity and diversity of load forecasting requirements. This paper presents a BERT-based power load forecasting method that leverages natural language processing and image processing techniques to enhance the accuracy and efficiency of transformer load forecasting in smart grids. The proposed approach involves using BERT for data preprocessing, analysis, and feature extraction on long-term historical load data from power grid transformers. Multiple rounds of training and fine-tuning are then conducted on the BERT architecture using the preprocessed training datasets. Finally, the trained BERT model is used to predict the transformer load, and the predicted results are compared with those obtained based on long short-term memory (LSTM) and actual composite values. The experimental results show that compared with LSTM method, the BERT-based model has higher short-term power load prediction accuracy and feature extraction capability. Moreover, the proposed scheme enables high levels of accuracy, thereby providing valuable support for resource management in power dispatching departments and offering theoretical guidance for carbon reduction initiatives.
1 Introduction
With the continuous development of the global economy, energy consumption continues to increase, leading to rising greenhouse gas emissions, which intensifies the global climate crisis and the speed of climate change. Therefore, achieving carbon neutrality and reducing carbon emissions has become a common goal of all countries. As an important part of it, power system management is particularly important for realizing the goal. Power system scheduling can achieve the energy manage and utilizing more efficiently, both renewable and non-renewable. Moreover, power system resource management can also encourage and promote the development and application of renewable energy.Through technological innovation and cooperation and sharing, power companies can achieve more intelligent, efficient and sustainable power system resource management, and make greater contributions to carbon neutrality and carbon reduction actions Yuan et al. (2023).
Figure 1, distribution transformers which are distributed in urban and rural areas, are the most important terminal equipment in the power system with a large number and complex structure. Their safe and economic operation is an essential condition to ensure the high-quality development of the power grid. With the deep integration of big data, artificial intelligence technology and power grid business, power distribution transformer load prediction has become an important basis to support power grid production and operation, and the accuracy of its load prediction is of great significance for transformer key monitoring, active rush repair, bearing capacity analysis and other businesses.

FIGURE 1. The typical architecture of transformers and power monitoring center.
The current technologies for load forecasting mainly include artificial neural networks, support vector regression, decision trees, linear regression, and fuzzy set Jahan et al. (2020). These methods are all based on the correlation mining of historical coincident data and forecast data. In other words, the regression analysis method is based on the causality model to predict the corresponding data, and the time series forecasting method completes the load forecasting through the curve fitting and parameter estimation of the load historical data. These methods are due to their simple structure and poor flexibility. It is difficult to meet the prediction accuracy Hou et al. (2022) required by practice. The above methods have the following problems 1) Usually the historical load data series are short, and usually face the challenge of insufficient data samples; Zhao et al. (2021). 2) The prediction accuracy of traditional forecasting methods is not high, and it is difficult to be applied in production practice. 3) The performance and universality of the prediction method are poor.
1.1 Motivation
Recently, due to the advantages of artificial intelligence methods in data forecasting and intelligent analysis, power system load forecasting based on machine learning (ML) Liao et al. (2021); Yuan et al. (2023) has gradually emerged. For example, the load forecast based on the time series model can be extended to a multi-class regression model to predict the power load by establishing a time series model for the grid power or the method based on the support vector machine (SVM) can use its own excellent binary classification characteristics.
However, these traditional ML prediction schemes, such as LSTM, convolutional neural network (CNN), and recurrent neural networks (RNN), all have problems of poor prediction accuracy and low efficiency. The bidirectional encoder representations from transformers (BERT) model innovatively encodes the sequence by using self-attention and position embedding Qu et al. (2023), which has nothing to do with timing and can be calculated in parallel, thereby achieving higher load prediction accuracy. However, the traditional forecasting algorithm is a structure improved by RNN, which has the concept of time series and cannot be calculated in parallel. Second, traditional model structures (such as LSTM, CNN, and RNN) are not interpretable Wang et al. (2021), while the self-attention mechanism of BERT’s transformers can produce more comprehensive models. This is very beneficial to the smart grid system. In view of BERT’s powerful ability to process and understand high-dimensional data, it can achieve high load forecasting effect. This paper proposes a BERT-based power system load forecasting architecture. That is, through reasonable load forecasting, the utilization rate of renewable energy can be maximized, the proportion of renewable energy in the power system can be increased.
1.2 Related work
Load forecasting is a crucial component of power system operation and plays an indispensable role in achieving carbon neutrality and reducing emissions. It enables power system managers to accurately predict future power demand, facilitating optimal planning of power production and distribution Ahmad et al. (2022). By employing scientific load forecasting, excessive or insufficient power production can be avoided, resulting in reduced power waste and carbon emissions. For instance, to address the challenges of power system emergency control and uncertainty, Huang et al. (2019) proposed an adaptive emergency control scheme based on deep reinforcement learning (DRL). They also developed an open-source platform called reinforcement learning grid control (RLGC), which provides various power system control algorithms and benchmark algorithms, supporting and enhancing the field. In Gasparin et al. (2022), deep learning techniques are applied to power load forecasting. The study evaluates the impact of different architectures, such as feedforward and recurrent neural networks, sequence-to-sequence models, and time convolutional neural networks, on load forecasting performance. Architecture variant experiments are conducted to compare the robustness and effectiveness of these models for load forecasting. From a power system network security perspective; Liu et al. (2020) proposes a network security assessment method based on deep Q-network (DQN). This approach approximates the optimal attack migration strategy by determining the required number of migrations, leading to improved power system security. The authors of Biagioni et al. (2022) introduce a flexible modular extension framework that serves as a simulation environment and experimental platform for various agent algorithms in power systems. They validate the framework’s performance using the multi-agent deep deterministic policy gradient algorithm, addressing a gap in power system agent training. In Tan and Yue (2022), a BERT-based time series forecasting model is utilized to predict the wind power generation load in the power grid. This method effectively forecasts future load patterns.
In the realm of user electricity consumption behavior, various studies have been conducted. For instance, in Barman and Choudhury (2020), the authors analyze the demand-compliant behavior of electricity consumers and propose a hybrid parameter selection strategy that combines the gray wolf optimization algorithm and support vector machine. This approach considers changes in user demand to predict power system load. In Wang (2017), multiple factors that commonly influence load, such as weather conditions, are taken into account. The authors employ multiple linear regression analysis to determine regression coefficients and standard deviations, enabling load prediction under different weather conditions. Considering the power load scenario in a city, Li et al. (2018) introduces a data-driven linear clustering strategy. This strategy involves data preprocessing and modeling to construct an optimal autoregressive integrated moving average model. The method demonstrates efficient error forecasting and improved accuracy for predicting the city’s power system load. In Saviozzi et al. (2019), the authors address the business needs of distribution system operators and propose an integrated artificial neural network-based load forecasting and compliance modeling method for modern distribution management systems. The method exhibits better adaptability and higher performance, as validated through practical usage.
In contrast to the aforementioned methods, Du et al. (2020) addresses the limitations of traditional large-scale nonlinear time series load data forecasting methods. They propose an attention-BiLSTM network that utilizes BiLSTM to predict short-term power load sums. The attention mechanism employed in this method leads to improved prediction accuracy and stability. To enhance the temporal characteristics of composite data, Yin and Xie (2021) introduces a multi-time-spatial scale method for data processing and proposes a short-term rich deterioration prediction approach. In Chapaloglou et al. (2019), a coincidence prediction algorithm is designed using a feedforward artificial neural network. The algorithm performs predictions based on the current load curve shape classification. Combining feed-forward deep neural networks and recursive deep neural networks, Din and Marnerides (2017) predicts the short-term load of the power system. This approach effectively identifies the primary factors influencing load and power consumption, enabling accurate short-term load prediction. Research conducted in Yin et al. (2020) focuses on the deep forest regression method, utilizing two complete random forests for effective training and data learning. This method improves prediction accuracy while mitigating the impact of deep learning method parameter configuration. To address the low prediction accuracy of traditional methods, Rafi et al. (2021) proposes a prediction method based on convolutional neural networks and long short-term memory networks, achieving high prediction accuracy. In Kong et al. (2017), behavioral analysis is conducted on the scope of residents’ activities. The authors propose a deep learning framework based on long-term and short-term memory of device consumption sequences, enabling accurate prediction of electricity load in the smart grid.
1.3 Contribution and organization
The main contributions of this paper is organized as following:
• Different from the existing literature on power load forecasting, this paper proposes a Bert-based short-term forecasting method for transformer load data. The method is suitable for unpredictability and long sequence prediction Zhao et al. (2021). It can maximize the mining of hidden relationships behind sequences and related variables.
• Datasets abnormal values detection, processing and feature extraction are executed to establish the formal datasets. For all observation periods, the corresponding verification datasets and test datasets were divided according to a fixed proportion. During the formal training process of data, the efficiency of model learning is ensured by normalizing and standardizing all datasets.
• Leveraging the powerful data feature extraction capabilities of BERT, our proposed algorithm excels in extracting features from composite data over time, enabling accurate prediction of composite data within a specific future time range. Through rigorous experimentation and data analysis, the proposed model has demonstrated remarkable load prediction accuracy and performance for power system transformer load forecasting compared to the LSTM.
1.3.1 Organization
The paper is structured as follows: Section 2 delves into the BERT-based load forecasting scheme. Section 3 provides a detailed description of the datasets used in this study. In Section 4, the experimental setup and analysis of results are presented. Finally, Section 5 concludes the paper.
2 BERT-based load forecasting method
2.1 Bidirectional encoder representation from transformers (BERT)
BERT, a deep learning-based natural language processing technology, is utilized in this paper for data processing Devlin et al. (2018). The BERT model typically involves pre-training and fine-tuning stages. It has found widespread applications in question answering systems, sentiment analysis, and language reasoning. In this study, the BERT model is employed to extract power load characteristics from composite power system data. These characteristics include transformer ID, date, time stamp, wind speed, flight direction, ambient average temperature, maximum temperature, minimum temperature, humidity, reactive power, and active power. Subsequently, these extracted features and time series data are fed into the forecasting model for training. The steps involved in the BERT-based power load data processing are as follows:
2.1.1 Data preprocessing
In our study, we performed data preprocessing on the load data of 52 transformer sets spanning multiple years. This preprocessing involved handling missing values, outliers, and type conversion. Finally, we applied normalization and standardization techniques to the data. For the normalization and standardization process, we employed the following method on the input data x:
where δ is the variance of the sample. The data normalized by normalization is scaled between [0,1].
2.1.2 Coding
In the load prediction task, BERT encodes the input data using transformer. The input to BERT consists of token embeddings, segment embeddings, and position embeddings. These three vectors are combined to form the final input vector. Additionally, BERT is capable of encoding the input data from multiple perspectives, enhancing its understanding of transformer load data. The position code, as described in Kazemnejad (2019), comprises a pair of sine and cosine functions, each with a decreasing frequency along the vector dimension. Mathematically, it can be represented as follows:
where ωk represents the position index of the token in the sequence, taking integer values ranging from 0 to the maximum sequence length minus 1 (MLen-1). The variable d denotes the dimensionality of the position vector, which is equal to the hidden state dimension of the entire model. The variable i is an integer ranging from 0 to d/2-1, specifically 0, 1, 2, … , 383.
Based on the aforementioned position encoding, BERT facilitates the model in performing calculations involving relative positions more effectively. The rectified linear unit (ReLU) function is employed as the activation function, which can be expressed as:
In the context of activation functions, the input is denoted as z. When sigmoid or other functions involving exponential operations are used to calculate the activation function, the computational load tends to be high. Moreover, when reverse propagation is applied to compute the error gradient, the derivative often involves division, resulting in a relatively large computational burden. In contrast, the computation involved in ReLU is significantly reduced. The utilization of ReLU leads certain neurons to output zero, thereby promoting network sparsity. This reduction in interdependence among parameters helps alleviate the occurrence of overfitting issues.
2.1.3 Training
BERT utilizes historical power grid load data from a specific time period as input. This data is fed into a fully connected layer Franco et al. (2023) to generate forecast outputs. The model is trained using the mean square error as the loss function. Through training, the model adjusts its parameters to minimize the loss, continuously improving its accuracy. This iterative process continues until convergence is achieved.
2.1.4 Prediction
By training the BERT model, load values of specific transformers in the near future can be predicted. These predictions serve as valuable references and guidance for power grid enterprises in terms of power demand. To ensure higher prediction accuracy, we adopt training samples with the same prediction length during the training stage. This is achieved through the use of sliding windows, allowing for the construction of training and test sets.
Figure 2 illustrates the utilization of transformer-based bidirectional encoding in BERT. Unlike the full transformer model, BERT exclusively employs the encoder part. Each encoder unit consists of multi-head attention, layer normalization, feedforward layers, and additional layer normalization, stacked and combined across multiple layers. Self-attention, a crucial component of BERT, is integrated with position encoding to address temporal correlation in the training data. Its primary function is to dynamically calculate weights during information propagation. Multi-head attention aggregates the outputs of multiple distinct units and subsequently combines them through fully connected dimensionality reduction and output. Layer normalization plays a role in regularization. It gathers the outputs of self-attention, applies layer normalization, and then normalizes each row within the batch.
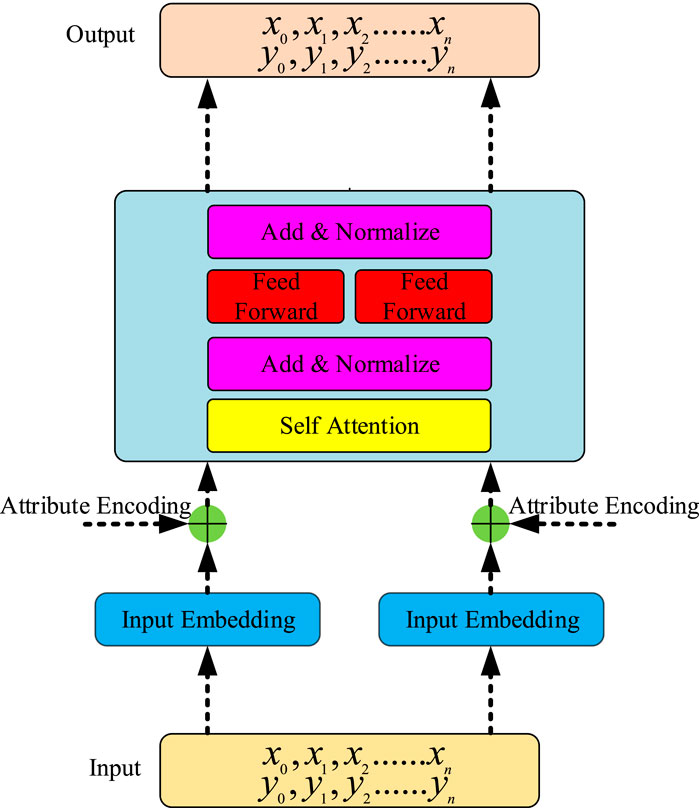
FIGURE 2. Schematic diagram of typical BERT.
During the model training process for specific load data, as depicted in Figure 2, we take into account various factors that influence the power system load. These factors include transformer ID, date, time stamp, wind speed, flight direction, ambient average temperature, maximum temperature, minimum temperature, humidity, reactivated power, activated power, and more. Since these data are interrelated, we utilize the Embedding + Positional method to incorporate the correlation between historical load data attributes into the data. Embedding involves mapping the training data to corresponding dimensions. By employing BERT, we can train the model, extract features from the input rich and deteriorating data, and ultimately achieve short-term power compliance prediction.
2.2 BERT’s attention mechanism
The core component of BERT is the Transformer, and the theoretical foundation of the Transformer lies in the attention mechanism. The attention mechanism enables the neural network to focus on specific parts of the input. It involves three main concepts: Query, Value, and Key. The Query represents the target word, the Value represents the original representation of each word in the context, and the Key represents the vector representation of each word in the context. BERT calculates the similarity between the Query and Key, and then combines the Value to generate the attention value for the target word. In other words, the attention mechanism allows BERT to selectively attend to relevant information during processing.
The self-attention mechanism has certain limitations, such as being overly focused on its own position. To address this issue, BERT employs the multi-head attention mechanism. This mechanism allows BERT to mitigate the self-attention’s excessive self-focus and promotes a more balanced attention across the input sequence. Additionally, the use of the multi-head attention mechanism in BERT enhances the model’s expressive power. It enables the attention layer’s output to contain encoding representation information from different subspaces. By performing multiple sets of self-attention processing on the original input sequence and combining the results through linear transformations, BERT improves its feature understanding capability. This enhancement contributes to a more comprehensive representation of the input data, thereby improving the model’s overall performance.
2.3 The architecture of proposed model
The prediction network model, as depicted in Figure 3, is composed of the integration of historical loads and extracted variables through feature extraction. These upper-layer feature vectors, along with the historical loads, are fed into the BERT network. The BERT network processes the inputs and generates hidden features, which are then passed through a fully connected network with sizes of 512, 1024, and 96. Dropout functions with a probability of 0.3 are applied after the first and second fully connected layers to mitigate overfitting. The final output consists of load predictions for different transformers.
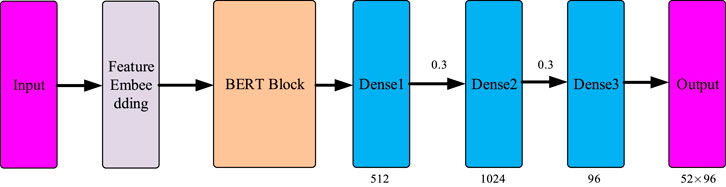
FIGURE 3. The architecture of proposed predicting model based on BERT.
To obtain more accurate predictions of future loads, we utilize Mean Squared Error (MSE) as the loss function during model training. The MSE can be expressed as:
where N represents the discrete vector samples, where yi denotes the actual load value and
where g represents the gradient of the current batch, and θ represents the model parameters. To obtain the optimized weight update, the biased estimation of the first moment can be represented as:
where s represents the moment vector and ρ1 is the decay rate. The biased estimation of the second moment can then be written as:
where q is the second moment vectors. ρ2 denotes the decay rates. Furthermore, the bias corrected moment estimation can be denoted as
Then, the model parameters can be updated by
where θ denotes the model parameters, and β represents the learning rate. The primary advantage of using the adaptive moment estimation (Adam) optimizer is its ability to adaptively select the update step size. This approach can achieve the goal of annealing the learning rate while also minimizing the impact of the gradient scale on optimization.
3 Description of datasets
3.1 Basics and preprocessing of datasets
In order to accurately predict the average load, comprehensive datasets were constructed using load data from 52 different transformers in the same area, collected over a period of 584 days. The data was collected at a 15-min interval for each transformer, resulting in approximately 96 discrete samples per day for each transformer. The total dataset size is approximately 52 × 96 × 584. The objective of this study is to predict future load values based on historical data and related variables, aiming to achieve intelligent power scheduling, improve energy efficiency, reduce carbon dioxide emissions, and enable efficient and intelligent scheduling. Each sample in the dataset includes eight environmental parameters: maximum temperature, minimum temperature, average temperature, maximum humidity, minimum humidity, extreme wind speed, wind direction, and 24-h precipitation. Table 1 provides further details on these parameters.
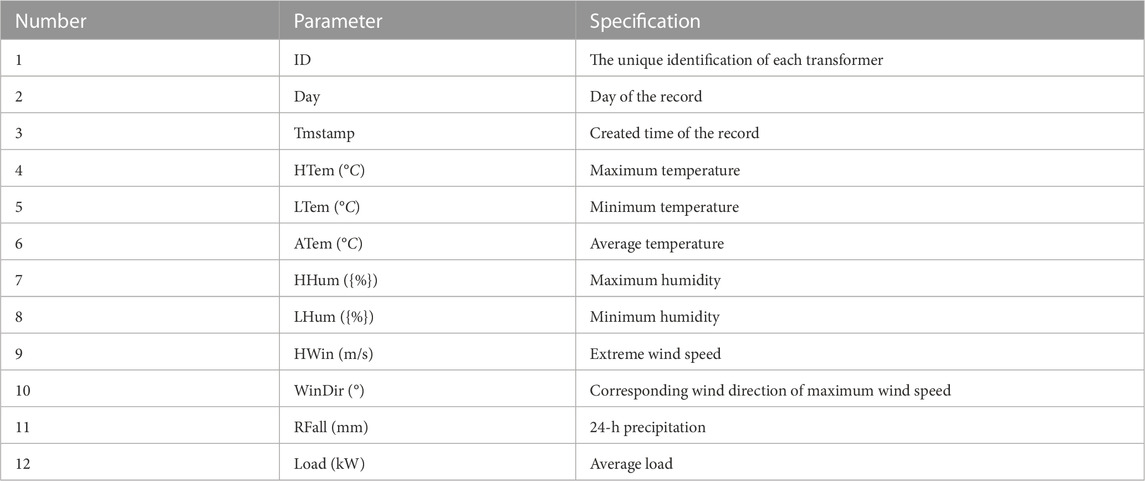
TABLE 1. The detailed description about the semantic meaning of each related variables which included in the datasets.
Figure 4 depicts the detailed trends of the environmental variables. On the left side of the figure, it can be observed that the ambient temperature exhibits fluctuations. Over the 584-day acquisition period, the ambient temperature shows both local and periodic fluctuations. Local temperature fluctuations are influenced by random factors such as short-term rainfall, while long-term fluctuations are driven by large seasonal changes. Temperature variations have a significant impact on the power load fluctuations of residents and various enterprises in the region, making it a crucial factor in the load variations of different transformers across the area.
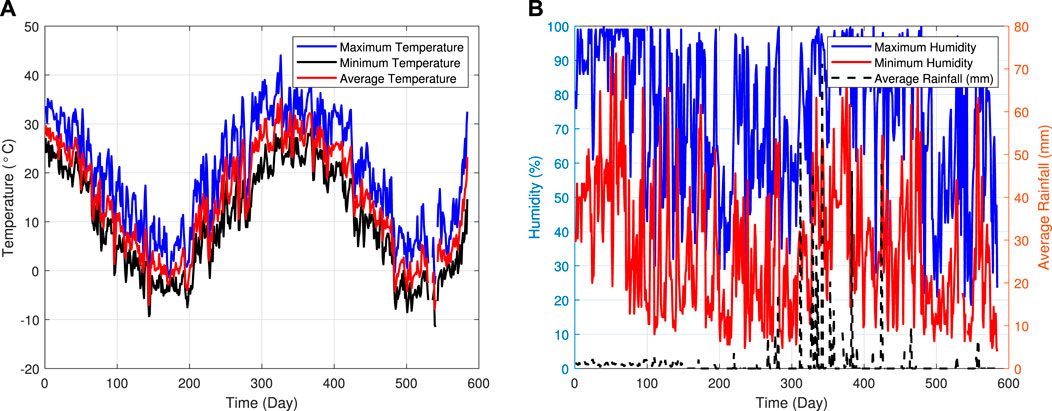
FIGURE 4. The corresponding temperature (A), humidity and rainfall (B).
On the right-hand side of Figure 4, the variations in humidity over different sampling intervals are depicted. The blue curve represents the maximum humidity recorded during the day, while the red curve represents the minimum humidity. This metric partially indicates the need for dehumidification in the area and contributes to the system load. The black curve represents the amount of rainfall recorded during the day, which directly affects environmental humidity. It can be observed from the chart that the overall humidity of the system is high during periods of heavy rainfall. This aspect reflects local weather conditions and the availability of photovoltaic power generation to supplement household and factory power consumption. Therefore, these three factors illustrated in the figure play a significant role in system load fluctuations and are considered as relevant impact factors.
Figure 5 presents the statistics of environmental wind speed, wind direction, and the total load of the 52 transformers in the region during the data collection period. On the left side of the figure, the maximum daily wind speed shows both local fluctuations and long-term periodic changes that correspond to the data collection cycle. Short-term fluctuations are influenced by the measurement location, while long-term changes are related to larger cycles, similar to the temperature variations mentioned earlier. Moreover, the maximum wind direction exhibits a strong correlation with the maximum wind speed. Considering wind speed in load scheduling is crucial as it is associated with wind power generation, which can be integrated into the grid for intelligent scheduling purposes. On the right side of the figure, the overall load of the different transformers throughout the entire collection cycle is analyzed using summation statistics. Transformer number 4 has the highest load based on the statistical analysis. Classifying transformers based on their overall load statistics can lead to more intelligent maintenance and scheduling strategies. Additionally, factors such as photovoltaic (PV) systems, wind turbines (WT), gas turbine generators (GTG), and energy storage systems (ESS) are important components of the power system and influential factors in transformer load. PV and WT have experienced rapid deployment and development in recent years, contributing to diversified power supply systems. These power sources are influenced by environmental factors such as wind speed and sunlight, which can affect power supply in the system. GTG, on the other hand, is a stable and controllable power source that enables intelligent scheduling and maximizes energy utilization by predicting future regional loads. ESS, as an emerging technology, facilitates energy storage and release in the power grid. It helps achieve more precise intelligent scheduling, reducing the inherent variability of wind and photovoltaic power generation and ensuring optimal energy utilization throughout the scheduling system.
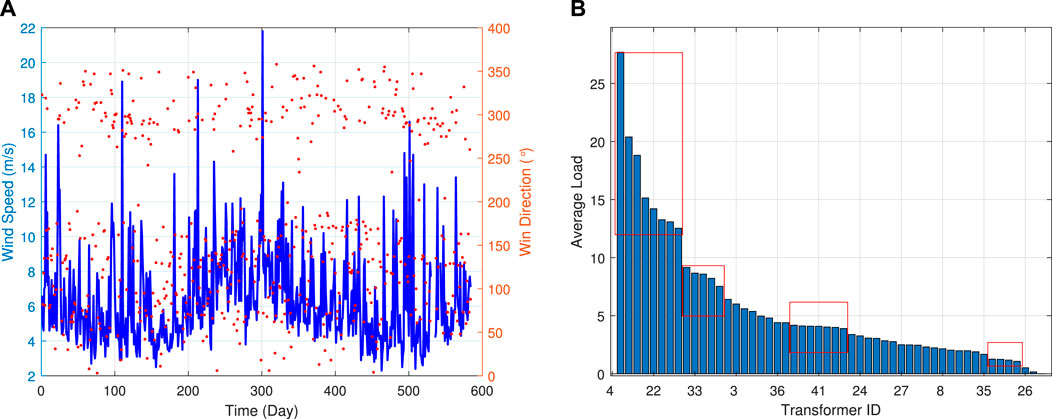
FIGURE 5. The corresponding wind speed/direction (A), average system load of different transformer (B).
3.2 Features of datasets
A comprehensive statistical analysis was conducted to analyze the distribution of the variables discussed in the previous chapter, aiming to provide a deeper understanding of their feature engineering. Figure 6 presents the results of this analysis. The analysis reveals that air temperature follows a basic normal distribution. However, due to large periodic changes, the distribution can be divided into three distinct intervals, each reflecting different characteristics. On the other hand, the distribution of maximum humidity is more dispersed and cannot be accurately described by mathematical models. Nonlinear neural networks based on machine learning models are better suited for capturing the complex characteristics and relationships of this variable. Wind speed variables conform to a Gaussian distribution, indicating a more regular pattern. The direction of the wind is strongly linked to the magnitude of the wind speed. Most wind directions exhibit oscillations to the left and right, while a wide range of wind directions corresponds to the maximum wind speed. In contrast, rainfall indicators exhibit sparse distribution characteristics. Careful characterization of this variable is necessary to fully understand its role in the system’s compliance and accurately capture its impact. Overall, the statistical analysis provides valuable insights into the distribution patterns and characteristics of the variables, guiding the subsequent modeling and feature engineering processes.
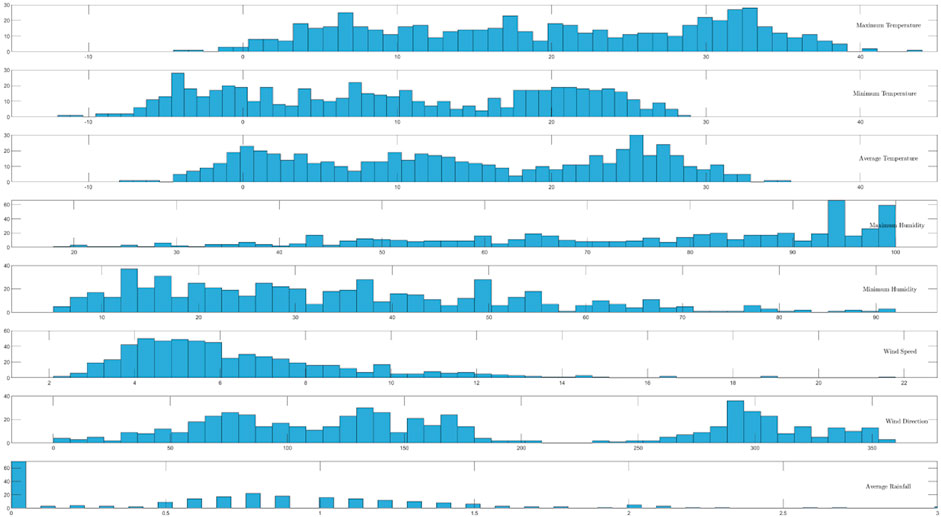
FIGURE 6. The description related features’ distribution of the observation period.
To explore the interrelationships among different variables, a correlation analysis was performed on all variables and the system statistical load. The results are presented in Figure 7, where the correlation coefficient ranges from −1 to 1. A negative value indicates a negative correlation, a positive value indicates a positive correlation, and a value closer to 1 indicates a stronger correlation. The analysis reveals several key findings. Firstly, there is a strong correlation among the three temperature-related variables, indicating their close interdependence. Temperature and humidity also exhibit a high correlation, suggesting a relationship between these two factors. Furthermore, wind speed and direction are highly correlated, indicating that they influence each other. Precipitation shows a common correlation with other variables, suggesting its influence on the overall system. Notably, there is a strong negative correlation between the system load and temperature as well as humidity. This implies that higher temperatures and humidity levels are associated with lower system loads, indicating a potential inverse relationship. Overall, the correlation analysis highlights the complex and hidden relationships among the system statistical load and the various variables. Given these intricate relationships, large-scale neural networks can be employed to model nonlinear patterns and facilitate accurate load forecasting for the future.
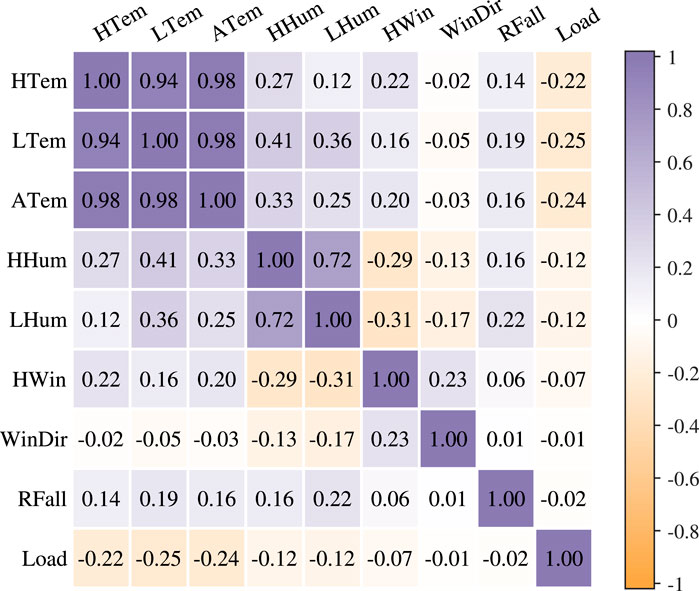
FIGURE 7. Heat map of related feature correlation matrix.
4 Experiment setup and results analysis
4.1 Experiment setup
The feature vectors consist of temperature, humidity, wind speed, wind direction, and rainfall, represented by numerical values. These feature vectors serve as the input to the BERT network, which predicts the load of the transformer in the next time period. During training, the BERT network is trained using a loss function and optimized using gradient descent to adjust the weights. After training, the model is applied to predict the load of multiple transformers in the test datasets. The accuracy of the predictions is evaluated using metrics such as mean absolute percentage error (MAPE), mean absolute error (MAE), and root mean squared error (RMSE). By comparing the predicted values with the actual values, the performance of the model is assessed, and model parameters can be adjusted accordingly. Experimental results demonstrate that the proposed model effectively predicts the load of multiple transformers with high accuracy. The model exhibits good robustness and generalization capabilities, indicating its ability to handle various scenarios and generalize well to unseen data.
The BERT-based algorithm for load data prediction in this experiment was developed using Python 3.8 and TensorFlow 2.7. The dataset used comprised 584 days of load data from 52 transformers belonging to the Hebei Electric Power Company. During the training process, the algorithm underwent 200 epochs with a batch size of 512 and a learning rate of 5e-3. The dataset was split into a training set covering days 1–451 and a validation set covering days 452–500 which is displayed in Figure 8. The Adam optimizer was utilized, and the parameter values used in the experiment are provided in Table 2.
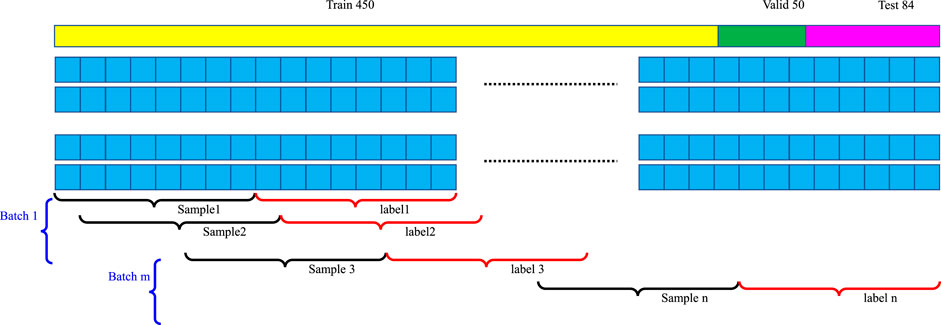
FIGURE 8. The corresponding training and validation strategy.
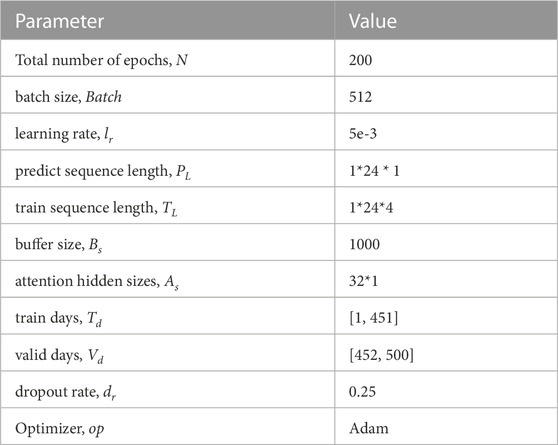
TABLE 2. Experiment parameters configuration.
4.2 Results analysis
Figure 9 illustrates the comparison of the loss function and prediction accuracy curves during the training of the BERT-based load forecasting algorithm. The results demonstrate that initially, the algorithm exhibits unstable fluctuations in the loss function, which is expected due to the limited number of training epochs. However, as the BERT model iteratively adjusts its parameters, the loss function gradually converges and stabilizes, indicating the algorithm’s superior convergence properties. Furthermore, Figure 9 compares the predicted load values generated by the BERT algorithm with the actual load values. The comparison shows that the BERT load forecasting algorithm effectively learns from historical transformer load data, captures relevant features from multiple factors influencing power load, and adapts to the characteristics of load changes, leading to higher prediction accuracy.
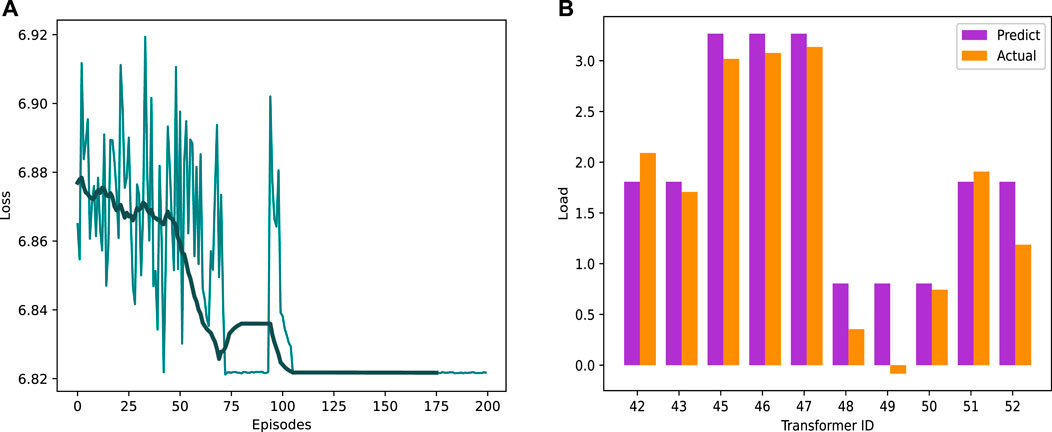
FIGURE 9. Training loss (A) and load prediction bar chart (B).
In Figure 10, the load prediction results for the last 10 transformers are presented, and the predicted results are visually depicted through a histogram of the error rates. The results demonstrate that our proposed BERT-based transformer power load forecasting algorithm generally achieves better forecasting accuracy, with most error values kept within a small range of 0.2 and the majority of error rates maintained below 10%. However, a small portion of the error rates fluctuate significantly, as observed for the No. 47 and No. 48 transformers. This could be attributed to the training data collected with high fluctuations, resulting in a slight increase in the prediction error rate for these transformers. Overall, our proposed BERT-based transformer power load forecasting algorithm exhibits satisfactory forecasting results and demonstrates superior feature extraction and expansion capabilities compared to traditional CNN and LSTM models. These findings have practical implications and are valuable for addressing the needs and making adjustments in the power system industry.
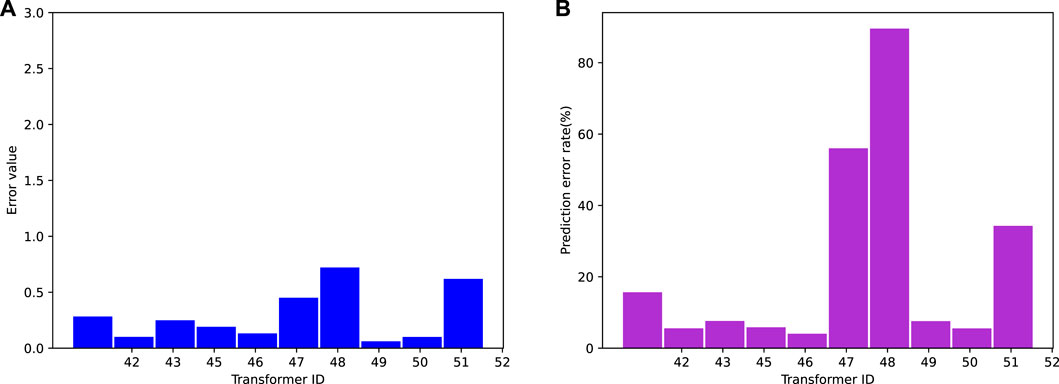
FIGURE 10. The corresponding training (A) and validation strategy (B).
Figure 11 presents the load prediction results for all transformers in the LSTM-based area. It is evident that there is a certain difference between the actual transformer load and the prediction based on LSTM. However, through careful observation and leveraging historical data, a certain level of compensation can be achieved to achieve accurate load predictions for the future. The right side of the figure shows the predicted values of different transformers for the next time period. It can be observed that the majority of transformer predicted values closely match the actual load values, with only a few predictions showing slight deviations. To further evaluate the difference between the predicted values and the actual values, Figure 12 displays the absolute error and relative error. The left side of the figure shows the absolute error values, indicating that only transformers numbered 43, 45, and 46 exhibit relatively large absolute errors, while the absolute errors of other transformers remain low. However, when considering the relative error, transformer number 49 stands out with a significant relative error. This can be attributed to the current load of the transformer being negative, leading to a substantial relative error. Overall, the results demonstrate the performance of the LSTM-based load forecasting model. While there may be some differences between the predicted and actual values, the model achieves accurate predictions for the majority of transformers, with only a few exceptions.
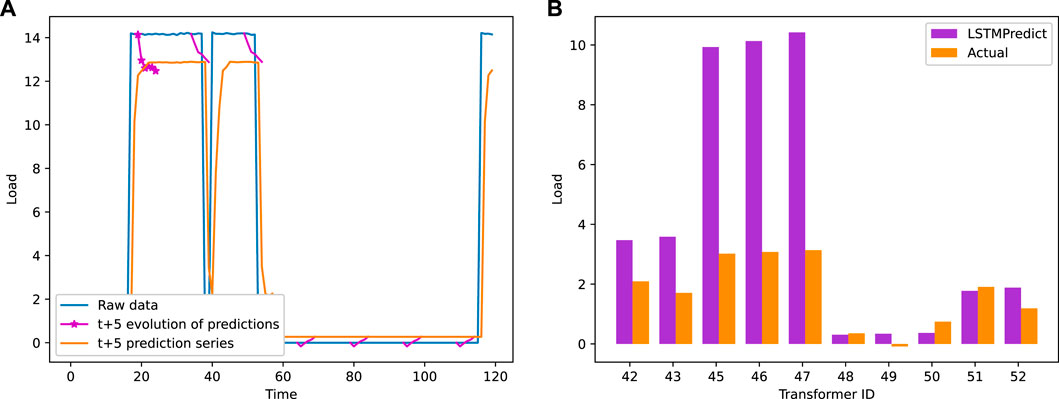
FIGURE 11. LSTM prediction results (A) and practical load prediction (B).
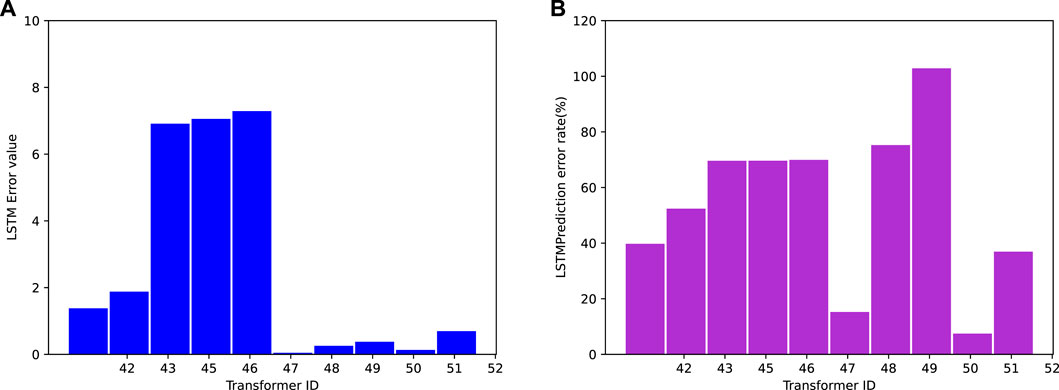
FIGURE 12. LSTM predicted results absolute error (A) and relative error (B).
Figure 13 presents the comparison of the BERT and LSTM models using the same training data and batch size. The results demonstrate that, under the same training parameters, the BERT network achieves a lower average absolute error compared to the LSTM network. This can be attributed to the BERT network’s ability to effectively learn from the entire training set using a deep network model, while the LSTM network relies on time series relationships and may not achieve optimal predictive performance through global comprehensive learning. Figure 14 provides a comparison of the relative error between the two models. It shows that the BERT network achieves a smaller relative error than the LSTM model, indicating better stability in its prediction results. The average error results, as presented in Table 3, further support the superiority of the BERT network model. Across different evaluation indicators, the BERT network consistently demonstrates better performance gains. Overall, the transformer load prediction based on the BERT network model exhibits high accuracy and stability. It can be effectively applied to existing power systems, enhancing the intelligent dispatch capability of regional electricity.
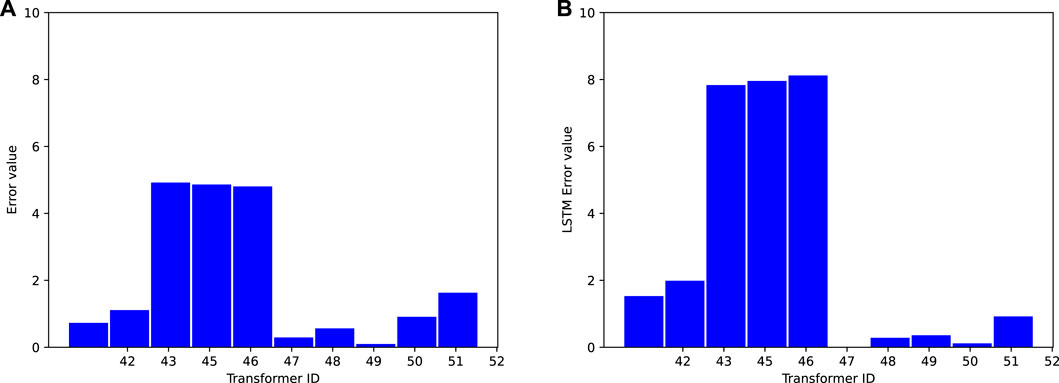
FIGURE 13. Absolute error of the BERT (A) and LSTM (B) algorithms with same batch size.
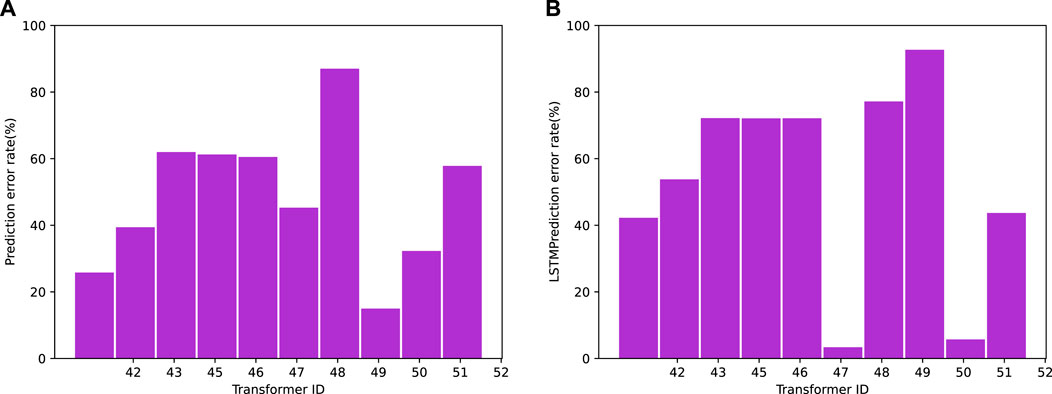
FIGURE 14. Relative error of the BERT (A) and LSTM (B) algorithms with same batch size.

TABLE 3. The experiment error results of BERT and LSTM with same batch size.
5 Conclusion
This paper introduces a novel BERT-based transformer power load forecasting algorithm that surpasses existing algorithms in order to enhance energy utilization efficiency and significantly reduce carbon dioxide emissions within power dispatching departments. The proposed algorithm leverages BERT’s powerful model extraction capabilities by preprocessing, encoding, and training historical load data obtained from the power grid. Consequently, it exhibits improved data understanding and achieves more accurate load forecasting compared to traditional LSTM approaches. Unlike conventional time series algorithms, our experimental results demonstrate that the BERT-based load forecasting method exhibits superior accuracy and robustness. The empirical analysis is based on actual power load data collected over a 2-year period from a power grid company, encompassing the composite data of 52 transformers. The dataset employed in this study includes various influential factors such as transformer ID, date, time stamp, wind speed, wind direction, ambient average temperature, maximum temperature, minimum temperature, humidity, reactive power, and active power. Our BERT-based method employs multiple preprocessing techniques and dataset analyses, leading to accurate load change predictions across different time periods and identification of key factors influencing power load. In contrast to traditional time series algorithms, our approach can effectively capture all relevant factors impacting power load. The proposed BERT-based power load forecasting algorithm serves as a valuable reference for power grid enterprises in terms of power demand planning and operation. Optimized training parameters enable the majority of transformers to achieve an average error rate of less than 10%. In comparison, the LSTM-based load forecasting model yields an average relative error of approximately 53.52%, indicating inferior performance compared to the BERT-based method with the same training parameters. Thus, the BERT-based scheme facilitates precise energy scheduling and utilization, maximizing energy efficiency, and offering valuable insights for the digital low-carbon transformation of power dispatching departments. Future work will focus on exploring distributed federated learning algorithms to enhance the model’s robustness and adaptability.
Data availability statement
The original contributions presented in the study are included in the article/supplementary materials, further inquiries can be directed to the corresponding author.
Author contributions
HM contributed to the research concept and design, code development, data collection, data analysis, and interpretation. PT was responsible for writing the paper and providing critical revisions. CL contributed to data analysis and paper writing, while LL contributed to data processing and paper writing. HM contributed to the manuscript revision. PT was responsible for adding the relative experiments. All authors contributed to the article and approved the submitted version.
Conflict of interest
Authors PT, HM, CL and LL were employed by State Grid Hebei Marketing Service Center.
Publisher’s note
All claims expressed in this article are solely those of the authors and do not necessarily represent those of their affiliated organizations, or those of the publisher, the editors and the reviewers. Any product that may be evaluated in this article, or claim that may be made by its manufacturer, is not guaranteed or endorsed by the publisher.
References
Ahmad, N., Ghadi, Y., Adnan, M., and Ali, M. (2022). Load forecasting techniques for power system: Research challenges and survey. IEEE Access10, 71054–71090. doi:10.1109/ACCESS.2022.3187839
Barman, M., and Choudhury, N. B. D. (2020). A similarity based hybrid gwo-svm method of power system load forecasting for regional special event days in anomalous load situations in Assam, India. Sustain. Cities Soc.61, 102311. doi:10.1016/j.scs.2020.102311
Biagioni, D., Zhang, X., Wald, D., Vaidhynathan, D., Chintala, R., King, J., et al. (2022). “Powergridworld: A framework for multi-agent reinforcement learning in power systems,” in Proceedings of the thirteenth ACM international conference on future energy systems, 565–570.
Chapaloglou, S., Nesiadis, A., Iliadis, P., Atsonios, K., Nikolopoulos, N., Grammelis, P., et al. (2019). Smart energy management algorithm for load smoothing and peak shaving based on load forecasting of an island’s power system. Appl. energy238, 627–642. doi:10.1016/j.apenergy.2019.01.102
Devlin, J., Chang, M.-W., Lee, K., and Toutanova, K. (2018). Bert: Pre-training of deep bidirectional transformers for language understanding. arXiv preprint arXiv:1810.04805.
Din, G. M. U., and Marnerides, A. K. (2017). “Short term power load forecasting using deep neural networks,” in 2017 International conference on computing, networking and communications (ICNC) (IEEE), 594–598.
Du, J., Cheng, Y., Zhou, Q., Zhang, J., Zhang, X., and Li, G. (2020). “Power load forecasting using bilstm-attention,” in IOP conference series: Earth and environmental science (England: IOP Publishing), 440, 032115.
Franco, L., Placidi, L., Giuliari, F., Hasan, I., Cristani, M., and Galasso, F. (2023). Under the hood of transformer networks for trajectory forecasting. Pattern Recognit.138, 109372. doi:10.1016/j.patcog.2023.109372
Gasparin, A., Lukovic, S., and Alippi, C. (2022). Deep learning for time series forecasting: The electric load case. CAAI Trans. Intell. Technol.7, 1–25. doi:10.1049/cit2.12060
Hou, H., Liu, C., Wang, Q., Wu, X., Tang, J., Shi, Y., et al. (2022). Review of load forecasting based on artificial intelligence methodologies, models, and challenges. Electr. Power Syst. Res.210, 108067. doi:10.1016/j.epsr.2022.108067
Huang, Q., Huang, R., Hao, W., Tan, J., Fan, R., and Huang, Z. (2019). Adaptive power system emergency control using deep reinforcement learning. IEEE Trans. Smart Grid11, 1171–1182. doi:10.1109/tsg.2019.2933191
Jahan, I. S., Snasel, V., and Misak, S. (2020). Intelligent systems for power load forecasting: A study review. Energies13, 6105. doi:10.3390/en13226105
Kong, W., Dong, Z. Y., Hill, D. J., Luo, F., and Xu, Y. (2017). Short-term residential load forecasting based on resident behaviour learning. IEEE Trans. Power Syst.33, 1087–1088. doi:10.1109/tpwrs.2017.2688178
Li, Y., Han, D., and Yan, Z. (2018). Long-term system load forecasting based on data-driven linear clustering method. J. Mod. Power Syst. Clean Energy6, 306–316. doi:10.1007/s40565-017-0288-x
Liao, Z., Pan, H., Fan, X., Zhang, Y., and Kuang, L. (2021). Multiple wavelet convolutional neural network for short-term load forecasting. IEEE Internet Things J.8, 9730–9739. doi:10.1109/JIOT.2020.3026733
Liu, X., Ospina, J., and Konstantinou, C. (2020). Deep reinforcement learning for cybersecurity assessment of wind integrated power systems. IEEE Access8, 208378–208394. doi:10.1109/ACCESS.2020.3038769
Qu, K., Si, G., Shan, Z., Wang, Q., Liu, X., and Yang, C. (2023). “Forwardformer: Efficient transformer with multi-scale forward self-attention for day-ahead load forecasting,” in IEEE transactions on power systems, 1–12. doi:10.1109/TPWRS.2023.3266369
Rafi, S. H., Deeba, S. R., and Hossain, E. (2021). A short-term load forecasting method using integrated cnn and lstm network. IEEE Access9, 32436–32448. doi:10.1109/access.2021.3060654
Saviozzi, M., Massucco, S., and Silvestro, F. (2019). Implementation of advanced functionalities for distribution management systems: Load forecasting and modeling through artificial neural networks ensembles. Electr. Power Syst. Res.167, 230–239. doi:10.1016/j.epsr.2018.10.036
Tan, L., and Yue, H. (2022). Application of bert in wind power forecasting-teletraan’s solution in baidu kdd cup 2022.
Wang, J. (2017). “Power system short-term load forecasting,” in 2017 5th international conference on machinery, materials and computing technology (ICMMCT 2017) (Beijing, China: Atlantis Press), 250–253.
Wang, Y., Chen, J., Chen, X., Zeng, X., Kong, Y., Sun, S., et al. (2021). Short-term load forecasting for industrial customers based on tcn-lightgbm. IEEE Trans. Power Syst.36, 1984–1997. doi:10.1109/TPWRS.2020.3028133
Yin, L., Sun, Z., Gao, F., and Liu, H. (2020). Deep forest regression for short-term load forecasting of power systems. IEEE Access8, 49090–49099. doi:10.1109/access.2020.2979686
Yin, L., and Xie, J. (2021). Multi-temporal-spatial-scale temporal convolution network for short-term load forecasting of power systems. Appl. Energy283, 116328. doi:10.1016/j.apenergy.2020.116328
Yuan, J., Chen, S.-Z., Yu, S. S., Zhang, G., Chen, Z., and Zhang, Y. (2023). A kernel-based real-time adaptive dynamic programming method for economic household energy systems. IEEE Trans. Industrial Inf.19, 2374–2384. doi:10.1109/TII.2022.3181034
Keywords: carbon reduction, smart grid, transformer load, digital transformation, energy scheduling, BERT model
Citation: Tao P, Ma H, Li C and Liu L (2023) Intelligent grid load forecasting based on BERT network model in low-carbon economy. Front. Energy Res. 11:1197024. doi: 10.3389/fenrg.2023.1197024
Received: 31 March 2023; Accepted: 30 May 2023;
Published: 15 June 2023.
Edited by:
Zijun Zhang, City University of Hong Kong, Hong Kong SAR, ChinaReviewed by:
Feng Hong, North China Electric Power University, ChinaNeeraj Kumar Singh, NeST Digital, India
Copyright © 2023 Tao, Ma, Li and Liu. This is an open-access article distributed under the terms of the Creative Commons Attribution License (CC BY). The use, distribution or reproduction in other forums is permitted, provided the original author(s) and the copyright owner(s) are credited and that the original publication in this journal is cited, in accordance with accepted academic practice. No use, distribution or reproduction is permitted which does not comply with these terms.
*Correspondence: Hao Ma, aGFvbWEuc2dobXNjQG91dGxvb2suY29t