 Jia Chen1*
 Jie Dai
- 1School of Information Engineering, Wenzhou Business College, Wenzhou, China
- 2School of Software Engineering, Changzhou Institute of Technology, Changzhou, China
- 3School of Advanced Studies, University of Malaya, Kuala Lumpur, Malaysia
- 4Taizhou Branch, China National Offshore Oil Corporation (CNOOC), Taizhou, Jiangsu Province, China
1 Introduction
The concept of Management Information Systems (MIS) dates back to the early 1930s when Bird emphasized the role of decision-making in organizational management. In 1985, Gorden B. Davis, the founder of MIS and a renowned professor at the Carlson School of Management at the University of Minnesota, provided a comprehensive definition of MIS as “a user-machine system that employs computer hardware and software, manual work, analysis, planning, control and decision models, as well as databases. It provides information to support the operations, management, and decision-making functions of a business or organization.” In early studies of MIS for energy systems, Monte Carlo simulations were frequently used to estimate the stresses caused by annual energy balance and power mismatch of the grid in complex situations with considerable uncertainty (Almeida et al, 2015; Zhang et al, 2016; Gholami-Moghadam et al, 2017; Zhu et al, 2017). These studies evaluated the overall performance of the design based on three criteria: annual energy balance reliability, grid stress, and initial investment, using user-defined weighted factors. However, Chakir et al’s (2020) case study shows that the optimal energy design depends largely on the definition of zero-energy buildings (ZEB), existing policy tools, and current energy market conditions. Due to the influence of the grid-connected electricity price of photovoltaic, the optimal design is fossil fuel cogeneration and large capacity photovoltaic power generation, which has a significant impact on the power grid. Therefore, the practical utility of MIS in some fields of energy is the subject of debate.
González et al (2021) categorize energy management systems into six levels based on the hardware system, including the energy-using equipment layer, data acquisition layer, data processing layer, data storage layer, web publishing layer, and remote user layer. These six levels can supply energy consumption data to the upper modules of the entire energy management system. Rathor et al (2020) also share a similar view, highlighting that energy management systems provide equipment monitoring and fault alarms for enterprises based on energy consumption monitoring data and provide a data basis for upper-level data mining. Therefore, energy consumption data processing plays a crucial role in the entire energy management system. It has several characteristics, such as mass, heterogeneity, real-time, redundancy, and unreliability. In recent years, with the advancement of communication technology, energy management systems based on the Internet of Things typically deploy a relatively large-scale perception network and have numerous data sensing devices (Granderson et al, 2020; Pourghebleh et al, 2022). This has ushered in an era of cloud service, intelligence, and diversification for MIS in the energy sector.
The current energy cloud platform mainly provides services that solve real-time processing and storage issues of large-scale IoT data, using technologies such as cloud computing and the Hadoop computing framework. Among these services, Web-based energy management is considered highly valuable for research (Chou and Truong, 2019; Chen et al, 2021). Web-based energy monitoring systems offer the advantage of monitoring and managing data from different locations through a web browser, which enables efficient and cost-effective maintenance (Motegi et al, 2020). Web-based energy information systems are relatively new and have not yet been fully explored, but they use web technology to collect, process, and publish energy data, making it more convenient for users to monitor and manage energy use (Capehart and Middelkoop, 2020). The development and application of web technology in energy management has become a research hotspot, including energy data visualization, energy efficiency evaluation, and intelligent control. However, despite the recognized benefits of web-based energy management systems, research on the current frontiers and hotspots of MIS in the energy field has been limited. Some scholars believe that MIS has been widely applied in various research areas related to energy, such as human energy, wearable energy, biology, and geography. In this article, we use Citespace software to explore the research trends and frontiers in web-based energy information systems over the past few years.
2 Methodology
2.1 Data collection
We conducted a search on the Web of Science core collection with the following subject line: (“web-based energy management system” OR “web-based energy information systems” OR “web-based energy monitoring system” OR “web-based energy scheduling”) and a publication time range of (2003-01-01 to 2022-12-31). The search retrieved a total of 1451 papers. To identify the main topics and subtopics discussed in the literature, we conducted a content analysis of the retrieved papers. Based on this analysis, we categorized the topics into two groups: “core knowledge domains” and “peripheral knowledge domains.” The “core knowledge domains” refer to the main topics that were most frequently discussed in the literature, while the “peripheral knowledge domains” refer to the subtopics that were discussed less frequently.
2.2 Structural transformation model
To measure the impact of new papers or scholars on changes in the structure of existing citation networks, we employed the Structural Variation Analysis (SVA) model proposed by Prof. Chaomei Chen in 2012. The SVA model uses three main measures to quantify the degree of structural transformation: the rate of change of patternedness (ΔM), the rate of change of links between clusters (ΔCLw), and the degree of centrality dispersion (ΔCkl).
The rate of pattern change (ΔM) measures the increase in network links among cited documents that may appear in the same or different academic groups. The rate of linkage change between clusters (ΔCLw) focuses on the impact of linkage between different clusters before and after the introduction of new literature into the network. Centrality dispersion (ΔCkl) measures the changes in the network structure caused by new literature before and after considering the introduction of new literature. The equations for these measures are as follows.
(1) The rate of pattern change (△M) mainly considers the increase of knowledge base network links among the cited documents, and these increased links may appear in the same academic group or different academic groups. The more significant the increase of network links caused by the cited documents, the larger the value of the pattern change rate index, and the more significant the potential impact of the corresponding new documents on the whole network.
(2) The rate of linkage change between clusters (△CLw) focuses on the impact of linkage between different clusters before and after introducing new literature into the network.
(3) The centrality dispersion (△Ckl) is based on the mediated centrality index of all nodes in the network, which measures the changes in the network structure caused by new literature before and after considering the introduction of new literature.
The basic computational procedure of the structural transformation model is as follows: assume that the co-citation network G is divided into k clusters by partition C such that G = c1 + c2 + … + ck. First define Q (G,C) as follows:
Where m is the total number of edges in the network G and n is the number of nodes in G. Known as Kronecker’s delta, it is 1 if nodes ni and nj belong to the same cluster and 0 otherwise. In addition, deg (ni) is the degree of node ni.
Network patterns are a measure of the overall network structure, which ranges between −1 and 1. The rate of change of patterns of scientific papers is mainly referred to the relative structural change of the network baseline of published papers. For each article (scholar)a and a base network Gbaseline, the rate of change in patterns is defined as follows.
where Gbaseline and Ga are network baselines updated based on the information in article a. For example, assuming that reference nodes ni and ni are not connected to the network baseline of co-cited references but are co-cited by article a, new links between ni and ni will be added to the network baseline such that the article changes the structure of the network base, and the remaining two metrics inter-cluster link change rate and centrality dispersion are measured similarly.
3 Results
3.1 Knowledge base evolution
In mapping the knowledge evolution of the research area “Web-based Energy Management Information System,” this study divides the data from 2003 to 2022 into two phases (Figure 1). The first stage is from 2003 to 2012 (Figure 1A), and the second is from 2013 to 2022 (Figure 1B). The core knowledge areas are distributed in “1. MATHEMATICS, SYSTEMS, MATHEMATICAL” and “3. ECOLOGY, EARTH, MARINE” in 2003–2012. The core knowledge base is “1. SYSTEM, COMPUTING, COMPUTER,” “2. ENVIRONMENT, TOXICOLOGY, NUTRITION,” and “10. PLANT, ECOLOGY, ZOOLOGY.” The marginal knowledge bases are “5. HEALTH, NURSING, MEDICINE,” “7. PSYCHOLOGY, EDUCATION, SOCIAL”, “8. MOLECULAR, BIOLOGY, GENETICS,” “12. ECONOMICS, ECONOMIC, POLITICAL”. In 2013-2022, the core knowledge areas were distributed in “1. MATHEMATICS, SYSTEMS, MATHEMATICAL,” “3. ECOLOGY, EARTH, MARINE” and “7. VETERINARY, ANIMAL, SCIENCE.” The core knowledge base is “1. SYSTEM, COMPUTING, COMPUTER,” “2. ENVIRONMENT, TOXICOLOGY, NUTRITION,” and “10. PLANT, ECOLOGY, ZOOLOGY.” The marginal knowledge bases are “5. HEALTH, NURSING, MEDICINE,” “7. PSYCHOLOGY, EDUCATION, SOCIAL,” “8. MOLECULAR, BIOLOGY, GENETICS,” “9. SPORTS, REHABILITATION, SPORT,” “12. ECONOMICS, ECONOMIC, POLITICAL.”
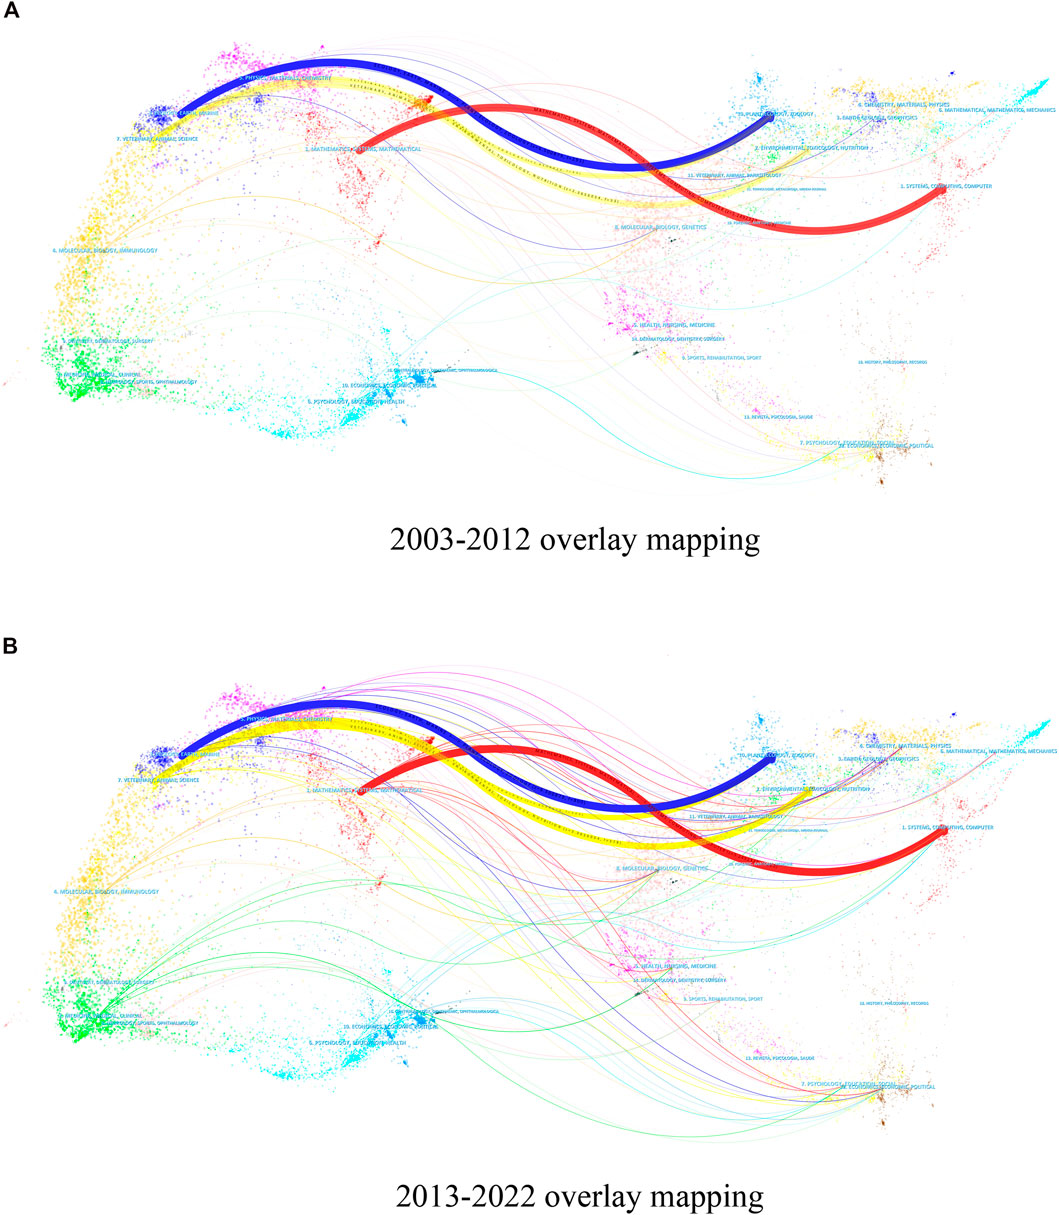
FIGURE 1. Overlay mapping. (A) 2003-2012 overlay mapping. (B) 2013-2022 overlay mapping.
3.2 Research hotspot analysis
The keywords are often a high summary of the research theme of literature, so the keyword analysis of the literature can clearly grasp the research theme of the literature and then grasp the research hotspots and frontiers of the literature. The basic principle is to count the co-occurrence of keywords or noun phrases in the literature, reflecting the strength of association between different keywords or noun phrases, and represent the research hotspots and research frontiers in the subject area according to the frequency of co-occurrence of these keywords or noun phrases. In order to reveal the research hotspots in the field of “Web-based energy management information system,” this study used CiteSpace software to analyze the keyword co-occurrences in the dataset from 2003 to 2022. The parameters were set as: time 2003-2022, Node Types = Keyword, and the threshold value was chosen as g index k = 15, and the network density was 0.0231. It was found that the cryptocurrency research domain had 375 nodes with 1621 connections in the keyword co-occurrence network from 2003 to 2022 (Figure 2). The top 20 keywords with the highest frequency of co-occurrence were listed as keyword information (Table 1). Based on this, the top 20 keywords with the highest frequency of co-occurrence were listed as keyword information (Table 1).
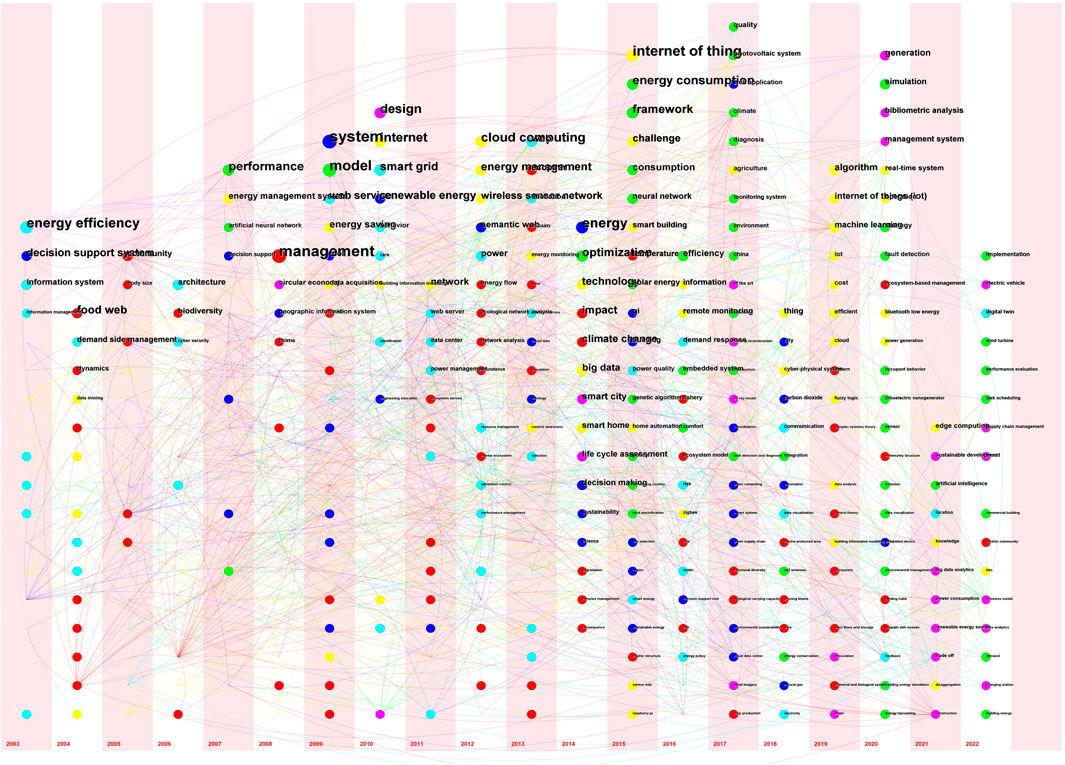
FIGURE 2. TimeZong view of keyword co-occurrence network.
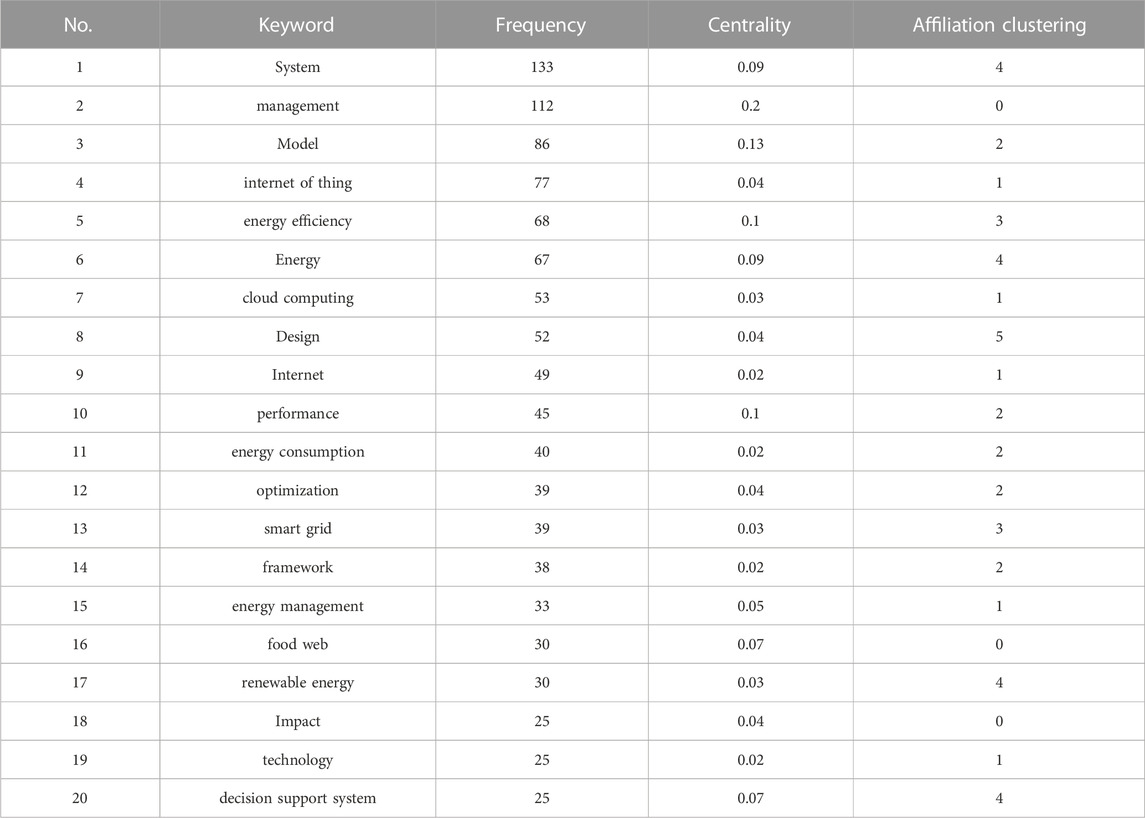
TABLE 1. Information table of main keywords.
According to the TimZone view of the keyword co-occurrence network from 2003 to 2022 (Figure 2), it can be found that the number of new keywords in the research field of “Web-based energy management information system” increases gradually every year, indicating that the scholars’ attention to this field cannot be increased continuously. The system’s frequency is 133 with a centrality of 0.09, the frequency of management is 112 with a centrality of 0.2, and the frequency of the model is 86 with a centrality of 0.13. The frequency of the Internet of Things is 77, with a centrality of 0.04. The frequency of the keyword energy efficiency is 68; the centrality is 0.1. The frequency of the keyword energy is 67; the centrality is 0.09. The frequency of the keyword cloud computing is 53; the centrality is 0.03. The frequency of the keyword design is 52; the centrality is 0.04. The frequency of the keyword design is 52; the centrality is 0.04. The frequency of the internet is 49 times with a centrality of 0.02. The frequency of performance is 45 times with a centrality of 0.1. The frequency of energy consumption is 40 times with a centrality of 0.02 (Table 1).
From 2003 to 2022, there were six hot topics in the research area of “Web-based energy management information system” (Figure 3). The main keywords in the food web hotspot are management, food web, impact, climate change, and energy efficiency. The main keywords in food web hot topics are management, food web, impact, climate change, eco path, community, temperature, biodiversity, dynamics, and energy flow. Internet of things hot topics are the main keywords in the hot topics of the internet of things, cloud computing, internet, energy management, technology, wireless sensor network, and challenge. Photovoltaic system hot topics are model, performance, energy consumption, optimize. The main keywords in the hot topics of the photovoltaic system are model, performance, energy consumption, optimization, framework, consumption, efficiency, simulation, and neural network. Energy efficiency hot topics are energy efficiency, smart grid, web service, web, power, architecture, information system, and demand side management. The keywords in the semantic web hot topics are system, energy, renewable energy, decision support system, semantic web, and decision making. Circular economy hot topics are design, smart city, generation, life cycle assessment, management system, and management system: life cycle assessment, management system, bibliometric analysis, and circular economy.

FIGURE 3. Keyword co-occurrence clustering mapping.
3.3 Research frontier analysis
Burst word analysis is a method of word relevance analysis using keyword co-occurrence data. Its basic idea is to discover the correlation between keywords by analyzing the number of co-occurrence between keywords, to uncover some potential hot knowledge. Specifically, burst word analysis is to find the correlation between keywords by comparing the number of co-occurrences between keywords, to discover the correlation between keywords, and dig out some potential hot knowledge. In this study, Burst analysis in CiteSpace software is used to explore the correlation between different keywords in the research field of “Web-based energy management information system” and the impact of emergent keywords on the research field. This study helps scholars to understand more deeply the development hotspots in the research field, adjust the research direction in time, and seize development opportunities.
From 2003 to 2022, we found a total of 27 Burst keywords in the research field of “Web-based Energy Management Information System,” which can be divided into three phases in general (Table 2). The first phase is from 2003 to 2009; the hotspots are information systems and dynamics. The second phase is from 2010 to 2017. The hotspots are the smart grid, food web, wireless sensor network, energy efficiency, eco path, eco slim, and energy management information system. The third phase is from 2018 to 2022. The research hotspots are the internet of things (IoT), internet, smart building, algorithm, framework, generation, real-time systems, and dynamics. Generation, real-time system, simulation, management system, bibliometric analysis.
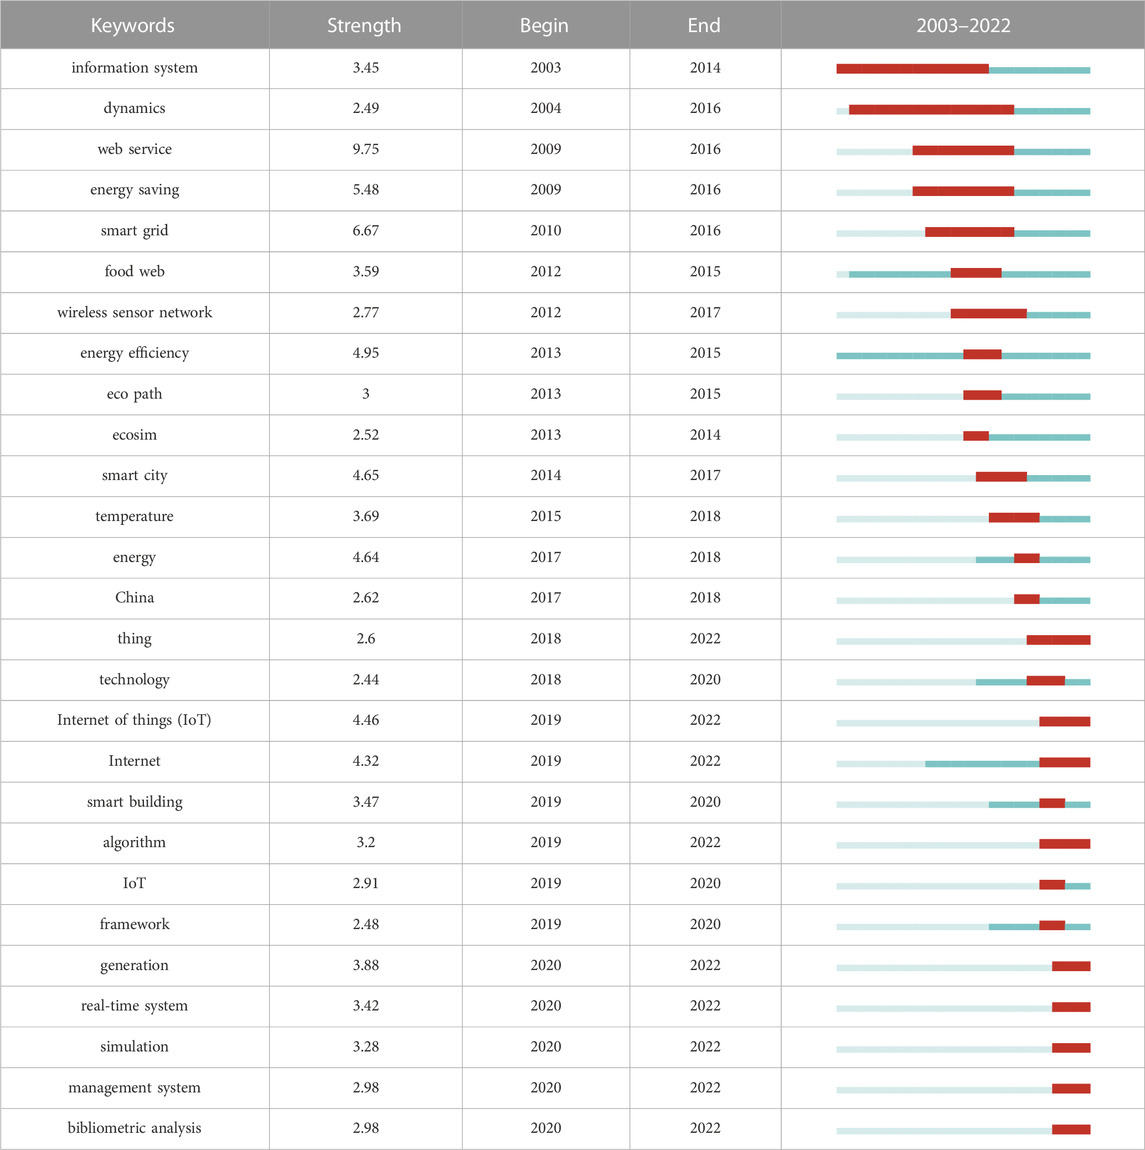
TABLE 2. Top27 keywords with the strongest citation bursts.
3.4 Potential impact paper forecast
The given passage presents a study that predicts potentially influential literature on “Web-based energy management information system” based on pattern change rates (△M), inter-cluster linkage change rates (△CLw), and centrality dispersion (△Ckl) indices. The study finds nine papers with a pattern change rate greater than 0, indicating a change in the research trend or direction. Out of these nine papers, five have an inter-cluster linkage change rate greater than 0, indicating a change in the relationship between clusters of research. However, there are no papers with a centrality dispersion index greater than 0, suggesting no significant change in the importance of authors’ roles in the network.
The passage lists the top five papers with high pattern change rates and inter-cluster link change rates, which are considered to be noteworthy. These papers are “A framework for integrating BIM and IoT through open standards,” “Designing Low-Res Lighting Displays as Ambient Gateways to Smart Devices,” “IoT big data and HPC based smart flood management framework,” “Energy Harvesting towards Self-Powered IoT Devices,” and “Toward Sustainable Energy-Independent Buildings Using Internet of Things.”
Furthermore, Table 3 provides the model change rate of the top 20 English literature, including the nine papers mentioned earlier. The table lists the pattern change rate (△M), inter-cluster linkage changes rate (△CLw), centrality dispersion (△Ckl), title, author, and publication date of each paper. The table shows that all the papers in the top 20 have a pattern change rate of 100, indicating a significant change in the research trend or direction. Additionally, five papers have an inter-cluster linkage change rate greater than 0, indicating a change in the relationship between clusters of research. However, there are no papers with a centrality dispersion index greater than 0, which is consistent with the findings presented in the passage.
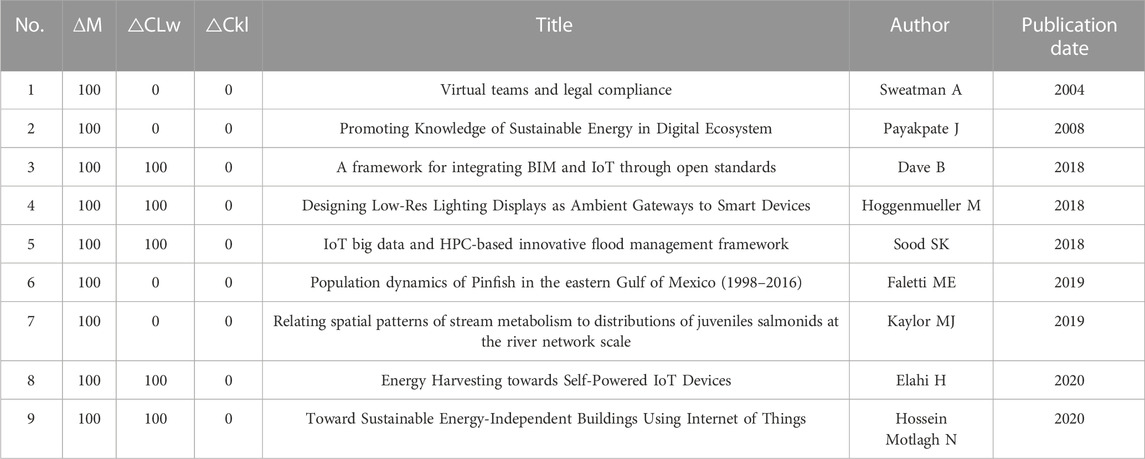
TABLE 3. The model change rate of English literature (Top20).
4 Discussion
This study provides valuable insights into research trends and developments in the field of web-based energy management. The study used a bibliometric approach to analyze a dataset of 2,798 articles published in the Web of Science database over a 20-year period (2002–2021). The results of the study revealed several interesting findings. Research productivity in the field of Web-based energy management has been increasing significantly over the years. The United States, China and Germany are the leading countries in terms of research output. In addition, the study identified several research hotspots, such as smart grids, wireless sensor networks, energy efficiency, eco-paths and energy management information systems. One of the most notable findings of the study is the emergence of the Internet of Things (IoT) as a research hotspot in the field of web-based energy management. This finding is not surprising given the increasing adoption of IoT devices and sensors in energy management systems. The study also identified other emerging research hotspots such as smart buildings, algorithms, and real-time systems.
The study also highlights the importance of interdisciplinary research in the field of network-based energy management. The authors note that research in this area needs to integrate various disciplines, such as computer science, electrical engineering and environmental science. In addition, the study suggests that future research should focus on developing new frameworks and models for web-based energy management systems that integrate data from different sources and enable real-time monitoring and control.
Overall, the study provides valuable insights into research trends and developments in the field of network-based energy management. The findings can inform future research in this area and guide the development of new frameworks and models for energy management systems. In addition, the study highlights the importance of interdisciplinary research and collaboration in addressing the complex challenges of energy management.
5 Conclusion
Energy management system is being popularized and applied in many medium and large enterprises, which is the concrete embodiment of the deep integration of production process and information technology in manufacturing enterprises. Based on the review of the research on energy management information systems from 2003 to 2022, this paper draws the following conclusions.
(1) When mapping the evolution of knowledge in the research area “Web-based Energy Management Information System,” we found no significant changes in the distribution of core knowledge areas between the first and second phases.
(2) The co-occurrence of keywords in the dataset from 2003 to 2022 using CiteSpace software shows that the number of new keywords in the research field of “web-based energy management information systems” is gradually increasing every year, indicating that scholars’ interest in this field is not continuously increasing.
(3) From 2003 to 2022, there are six hot topics in the research area of “Web-based Energy Management Information Systems.” They are: Internet of Things, photovoltaic systems, energy efficiency, circular economy, and semantic web, food web.
(4) From 2003 to 2022, we found 27 Burst keywords in the research area “Web-based Energy Management Information Systems,” which can be generally divided into three phases. They represent new research hotspots that will emerge at different stages.
(5) By predicting the potential and influential literature in “web-based energy management information systems,” we found that nine papers had a pattern change rate (△M) greater than 0, five papers had an inter-cluster linkage change rate (△CLw) greater than 0, and zero papers had a centrality dispersion (△Ckl) index greater than 0.
Data availability statement
The original contributions presented in the study are included in the article/supplementary material, further inquiries can be directed to the corresponding authors.
Author contributions
JC and JZ Contributed to the study conception and design. Material preparation, data collection, and analysis were performed by JC and JD. The draft of the manuscript was written by JD and HW. All authors contributed to the article and approved the submitted version.
Funding
This study was supported by Zhejiang Natural Science Foundation Project “Research and Development of Key Technologies and Devices for Pipe Attitude Identification and Control Based on Machine Vision” (No. LGG22F020021). Thanks to the support from “Fengcheng Talent Program” of Taizhou Association for Science and Technology. This study was also supported by the Outstanding Youth Special Project of 2023 “Jiangsu Science and Technology Think Tank Talent Program” (Grand Number: JSKJZK2023123).
Acknowledgments
This research thanks for the comments from reviewers. The authors would like to take this opportunity to thank the data collection assistants and the anonymous respondents who responded to the questionnaire.
Conflict of interest
The authors declare that the research was conducted in the absence of any commercial or financial relationships that could be construed as a potential conflict of interest.
Publisher’s note
All claims expressed in this article are solely those of the authors and do not necessarily represent those of their affiliated organizations, or those of the publisher, the editors and the reviewers. Any product that may be evaluated in this article, or claim that may be made by its manufacturer, is not guaranteed or endorsed by the publisher.
References
Almeida, C. M. D., Tjahjono, B., and Mann, B. P. (2015). Real-time energy management in discrete manufacturing: A simulation-based approach. J. Clean. Prod. 87, 8–18.
Capehart, B. L., and Middelkoop, T. (2020). Handbook of web based energy information and control systems. Florida, United States: CRC Press.
Chakir, A., Tabaa, M., Moutaouakkil, F., Medromi, H., Julien-Salame, M., Dandache, A., et al. (2020). Optimal energy management for a grid connected PV-battery system. Energy Rep. 6, 218–231. doi:10.1016/j.egyr.2019.10.040
Chen, J. I. Z., and Yeh, L. T. (2021). Graphene based web framework for energy efficient IoT applications. J. Inf. Technol. 3 (01), 18–28. doi:10.36548/jitdw.2021.1.003
Chou, J. S., and Truong, N. S. (2019). Cloud forecasting system for monitoring and alerting of energy use by home appliances. Appl. Energy 249, 166–177. doi:10.1016/j.apenergy.2019.04.063
Gholami-Moghadam, M., Soltanalian, M., and Far, B. H. (2017). A review of smart grid and its key technologies. Renew. Sustain. Energy Rev. 68, 835–855.
González, I., Calderón, A. J., and Portalo, J. M. (2021). Innovative multi-layered architecture for heterogeneous automation and monitoring systems: Application case of a photovoltaic smart microgrid. Sustainability 13 (4), 2234. doi:10.3390/su13042234
Granderson, J., Piette, M. A., Ghatikar, G., and Price, P. (2020). “Building energy information systems: State of the technology and user case studies,” in Handbook of web based energy information and control systems (Denmark, Europe: River Publishers), 133–182.
Motegi, N., Piette, M. A., Kinney, S., and Herter, K. (2020). “Introduction to web-based energy information systems for energy management and demand response in commercial buildings,” in Information technology for energy managers (Denmark, Europe: River Publishers), 55–66.
Pourghebleh, B., Hekmati, N., Davoudnia, Z., and Sadeghi, M. (2022). A roadmap towards energy-efficient data fusion methods in the Internet of Things. Concurrency Comput. Pract. Exp. 34 (15), e6959. doi:10.1002/cpe.6959
Rathor, S. K., and Saxena, D. (2020). Energy management system for smart grid: An overview and key issues. Int. J. Energy Res. 44 (6), 4067–4109. doi:10.1002/er.4883
Zhang, D., Huang, G. Q., and Qu, T. (2016). Energy efficiency optimization in discrete manufacturing processes with energy recovery using a genetic algorithm. J. Clean. Prod. 112, 3272–3282.
Keywords: energy system, web-based, scientometrics, energy management, data analysis
Citation: Chen J, Zhang J, Wei H and Dai J (2023) Frontiers in web-based energy management research: a scientometric data report. Front. Energy Res. 11:1195243. doi: 10.3389/fenrg.2023.1195243
Received: 28 March 2023; Accepted: 18 May 2023;
Published: 26 May 2023.
Edited by:
Ronghui Zhang, Sun Yat-sen University, ChinaReviewed by:
Mehran Hashemian, Urmia University, IranDezhi Chen, Shenyang University of Technology, China
Copyright © 2023 Chen, Zhang, Wei and Dai. This is an open-access article distributed under the terms of the Creative Commons Attribution License (CC BY). The use, distribution or reproduction in other forums is permitted, provided the original author(s) and the copyright owner(s) are credited and that the original publication in this journal is cited, in accordance with accepted academic practice. No use, distribution or reproduction is permitted which does not comply with these terms.
*Correspondence: Jia Chen, Y2hlbmppYS53emJjQG91dGxvb2suY29t; Jie Dai, czIwMzAzNzNAc2lzd2EudW0uZWR1Lm15