 Shaokun Zou1*
 Ning Zhang
 Baoze Wei
95% of researchers rate our articles as excellent or good
Learn more about the work of our research integrity team to safeguard the quality of each article we publish.
Find out more
ORIGINAL RESEARCH article
Front. Energy Res. , 05 May 2023
Sec. Process and Energy Systems Engineering
Volume 11 - 2023 | https://doi.org/10.3389/fenrg.2023.1194139
This article is part of the Research Topic Digital Technologies by Empowered Sustainable Electrical Energy Development View all 10 articles
Digital technology is rapidly advancing, and the resulting digitization of energy is becoming an inevitable trend. Integrating digital technology with energy planning can enable efficient utilization of renewable energy (RE); the fluctuation of RE generation, such as wind and photovoltaic (PV), can be reduced, and the reliability of the power grid can be ensured. A better solution for RE utilization and planning based on digital technology is proposed in this paper. First, an operation mechanism of a multi-energy complementary power station is proposed based on the complementary characteristics of multiple energy sources in the power generation process. The current status and related issues of multi-energy complementary power stations are studied in this paper. Second, a two-layer model of optimization that integrates the complementary features of multiple energy sources and system planning requirements is developed in this paper based on the aforementioned power station operation mechanism. The two layers of the model are nested with each other to realize the operation of the power station. The upper model includes the RE utilization rate and the benefits of the energy storage (ES) system. The lower model includes the operating cost of the power station. The solution model includes the highest utilization rate of RE and the lowest operation cost. Finally, the simulation operation is performed based on the data on a provincial power grid. The model and operation strategy of the multi-energy complementary power station based on digital technology proposed by this paper are verified.
The green and low-carbon economy has received considerable global attention as a result of resource and environmental limitations. Numerous countries are presently investigating strategies to attain a low-carbon economy by confronting these challenges (Li et al., 2021; Li et al., 2022; Zhang et al., 2022). RE plays a critical role in realizing this goal. Nevertheless, the inherently unpredictable characteristics of wind and PV power generation may lead to substantial resource wastage (Joseph and Balachandra, 2020). Digital technologies are being used effectively to accurately model and optimize various processes (Li et al., 2020; Song et al., 2021; Yang et al., 2023). Thus, to enhance the utilization of RE resources and encourage efficient energy consumption, establishing a coordination mechanism for multi-energy complementation through digital technologies is imperative.
Due to its cost-saving and environmentally friendly advantages, RE is positioned to become the primary power source in the future. However, in order to achieve low-carbon development, the fluctuation of RE output must be addressed (Li et al., 2019; Olsen et al., 2019; Sanjari et al., 2020). To this end, the adoption of multi-energy complementarity represents a crucial step forward in promoting energy modernization and the creation of a green and efficient energy system (Tan and Novosel, 2017; Li et al., 2020; Auguadra et al., 2023). The field of research related to RE is currently in a phase of rapid development. However, several issues need to be addressed in order to optimize the planning, construction, scheduling, operational technology, and institutional mechanisms. These issues can be broadly categorized as follows: first, there is a need to determine the optimal combination of wind, PV, hydro, and thermal storage to achieve the best operating results. Second, reducing energy waste and improving the utilization of RE are critical challenges that require further research. Third, the instability of RE sources, such as wind and PV, due to weather fluctuations during power generation, can lead to reduced power generation efficiency. Strategies for mitigating this instability and replacing the output of conventional power stations with RE to minimize costs must be developed. Fourth, determining the appropriate pricing mechanism for electricity generated from RE sources remains a key issue that needs to be addressed.
At present, scholars have studied the multi-energy complementary coordination mechanism. An optimal operation strategy for an independent regional grid based on the synergistic operation of wind–PV–water-storage during the dry period is proposed, as seen in Liu et al. (2019). This strategy mitigates the impact of seasonal and daily fluctuations in RE output on power supply reliability while also avoiding the risk of decreased hydroelectric generation during dry periods due to water shortages. In the paper by shafiei and Ghasemi-Marzbali (2023), a fast-charging station model is developed by integrating RE and ES systems. The uncertainty of RE is reduced, and the profitability of the charging station is improved. A grid-interactive microgrid based on a DC–DC multi-source converter configuration consisting of PV, wind, and hybrid ES is proposed in an article by Ravada et al. (2021). It can effectively reduce the fluctuations in generation caused by wind and PV. A coordinated optimization model for a hybrid water–wind–solar system based on the uncertainty of scenic power generation is proposed by Wei et al. (2019). The proposed operation strategy can improve the efficiency of RE utilization and reduce environmental pollution at the same time. An agent-based transactive energy trading platform is proposed in the article by Nunna et al. (2020) to integrate ES systems into the energy management system of a microgrid. The proposed model can effectively improve the system’s revenue. In the paper by Sun et al. (2017), a scenario-based stochastic model is proposed for dispatching a power system that integrates battery-based ES and transportation. The model aims to minimize the operating cost of the power system by reducing the amount of wind and electricity that is abandoned. An interconnected power system water–thermal–wind–PV complementary operation model is proposed by Wang et al. (2018). This model couples the complementary features of multi-energy and multi-area operations to optimize the utilization of RE sources and minimize carbon emissions. Additionally, this model mitigates the issue of abandonment in multi-energy and multi-regional power systems. A collaborative energy management strategy based on on-the-fly prediction is proposed in an article by Bazmohammadi et al. (2019). The proposed strategy solves the coupling constraint problem. It achieves multi-energy complementarity and improves energy utilization. A multi-energy supply geothermal–solar–wind RE hub framework was established by Xu et al. (2022). This framework maximizes the complementary features of the geothermal–PV–wind hybrid RE system, resulting in improved economic performance. A scheduling strategy structure that considers the stochastic characteristics caused by wind power and PV is proposed in the paper by Dong et al. (2020). A coordinated dispatching model with optimization objectives and profit maximization is developed in this paper. The proposed scheduling strategy can effectively improve the system’s revenue. In the paper by Oskouei et al. (2021), a unified decision structure consisting of network partitioning and optimal operational planning problems is proposed. The structure determines the optimal allocation of wind, PV, and ES systems. The RE utilization is increased, and the abandonment rate is reduced. A techno–economic–environmental energy dispatch framework for a multi-energy microgrid system is presented in an article by Karimi et al. (2023). The model improves the flexibility and reliability of the microgrid system. It also optimizes the operational cost, carbon emission, groundwater extraction, and independence of the multi-energy system. The independence of the multi-energy microgrid system is improved.
In this paper, a planning model is developed to facilitate the integration of multiple energy sources, specifically wind, PV, hydro, thermal, and storage. The proposed model encompasses the storage of electricity during periods of low RE generation, which can be utilized during peak periods for the regulation of peak loads. Moreover, surplus power generated during low-energy periods can be exchanged with the power grid. In situations where the energy supply is insufficient, power can be procured from suppliers by comparing prices to select the most viable option. The implementation of this planning model for multi-energy complementarity power stations is anticipated to enhance the utilization of RE, lower operational costs, and advance low-carbon development.
Its contributions can be briefly expressed as follows:
1. A power station operation mechanism that takes into account wind, PV, water, thermal, and ES is proposed by considering the coupling relationship between several different energy sources. Digital techniques are utilized to optimize the economic performance of the multi-energy complementary power station and to maximize the profitability of the station.
2. In this paper, a multi-energy complementary power station model is developed that takes into account the operating costs of the station, the revenue of the ES system, and the utilization of RE. The model is segmented into two parts: upper and lower. Different optimization algorithms are used to solve the model separately.
3. A power station planning model based on digital technology proposed in this paper reduces the waste of resources and supports the development of RE. At the same time, it solves the problem of low utilization of RE, which is in line with the green and low-carbon development goal.
The remaining sections can be summarized as follows: in Section 2, the master planning model of the multi-energy complementary power station is presented, and an objective function is established to maximize the power station’s benefits at minimum cost. Section 3 discusses the simulation results and validates the model’s feasibility. The paper concludes with the main findings in Section 4.
The power station planning process is shown in Figure 1. The operation strategy that enables the power station to be economically optimal can be obtained by following the planning steps in Figure 1. The planning process is as follows: first, the operating cost of each unit is calculated by inputting the cost of each unit. Next, the RE utilization capacity is calculated, and finally, the sum return of the power station is calculated. If the calculated value is optimal, it is outputted. Otherwise, the process iteratively updates the particle until the optimal value is obtained.
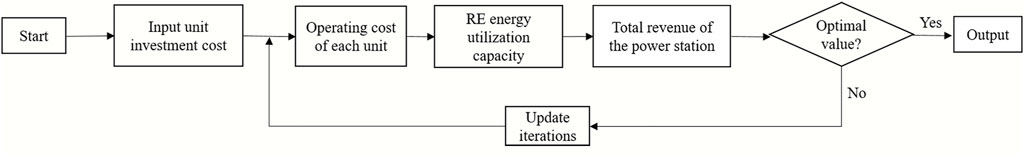
FIGURE 1. Planning flow chart.
The objective function of the multi-energy complementary power station is established as follows:
The objective function C represents the relationship between the total revenue of the power station and the cost of each unit. The objective function is established by maximizing the total revenue of the power station and minimizing the cost of each unit (Li et al., 2021).
The primary source of revenue for ES systems is to store electricity during peak usage periods and sell it to the power grid, earning the price differential.
The formula for calculating the revenue generated by the ES system during operation is given in Eq. 2. Since the ES system cannot both charge and discharge at the same time, one of
The operating cost of an ES system consists of three components, which are investment cost, operation and maintenance (O&M) cost, and kWh cost.
If it is not possible to determine, the aforementioned cost factors are generally approximated by a percentage of the initial investment to calculate the O&M costs, that is,
The formula for calculating the annual power generation of the ES system is given in Eq. 9, and the annual power generation is calculated by the conversion efficiency of the ES station and the annual utilization hours of the electricity storage of the ES station.
Therefore, the model with the greatest operating benefits of the ES system is
The relationship between the benefits and costs of the ES system is given in Eq. 10 as total benefits equal to operating benefits minus costs.
The formula for calculating the average annual cost is given in Eq. 11. The equivalent annual value of the cost of a thermal power station can be calculated by Eq. 11.
where
The relationship between O&M costs and investment costs of thermal power units is represented by Eq. 12.
The formula for calculating the cost of fuel consumed by thermal power units during peaking is given in Eq. 13.
To sum up, the charge for the thermal power turbine is
where
where
where
The ability to consume RE resources is expressed by the abandoned wind, PV, and water. The less wind, PV, and water are discarded, the higher the ability to consume RE resources in the system, and the opposite is lower.
where
K denotes the penalty price for wasting RE. When more electricity is abandoned, the larger K is, and the lower the utilization rate of RE will be. When the abandoned electricity is less, the smaller K means a higher utilization rate of RE. Therefore, in the planning process, the smaller the K, the better, that is, the smaller the abandoned power, the higher the energy utilization.
The whole system needs to satisfy the law of energy conservation. The power balance equation is given by Eq. 19, where the power generated by each unit at moment t is equal to the load power, which is also equivalent to the load when the ES system is charged and to the generator set when it is discharged (Yang et al., 2022).
where
where
where
where
Since the ES capacity of the ES system cannot be zero, the maximum and minimum ES capacities at moment t are limited, as shown in Eq. 24. The ES capacity at moment t increases as the ES system is charged and decreases as the ES system is discharged. When the RE output is enough to meet the load, the ES system charges to store the excess electricity and the electricity can be sold when the storage is not enough. When the RE output is not enough to meet the load, the ES system discharges, and if it is not enough, the electricity needs to be purchased.
The charging and discharging power of the ES system is limited and cannot be infinitely charged or discharged, so some constraints should be added, as shown in Eq. 25.
In a multi-party bidding situation, when the power grid tariff is higher than the tariff of other power companies, the option is to sell the excess power to the power grid.
The bidding relationship between the grid and the power supply company is represented by Eq. 26. The power station always selects the party with the most favorable price. If the price of buying electricity from the grid is higher than the price of the other power supply companies, it chooses to buy electricity from the other companies. It chooses to sell power to the grid if the price of buying power from the grid is higher than the price of the other supply companies.
This paper analyses a modified example of an actual system at a provincial level in China. The planning of multi-energy complementary power stations in the next 5 years is studied in this paper based on the current established commissioning plan situation of the province. The main economic parameters of each type of power source in the built multi-energy complementary power stations are indicated in Table 1. In Table 1, it can be seen that, for the time being, relatively few RE sources, such as wind turbines and PV units, have been put into operation because their power generation is unstable, and therefore, the utilization of RE sources is currently limited.
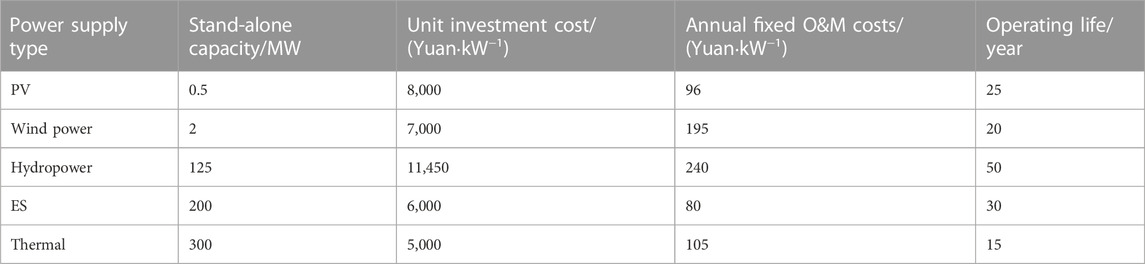
TABLE 1. Main economic parameters of various types of power sources in a multi-energy complementary power station.
The overview diagram of the power plant operation scenario is shown in Figure 2. A multi-energy complementary power station consists of wind turbines, photovoltaic units, hydroelectric units, thermal units, and energy storage systems. The power station supplies power to the load, and excess power can be stored until the power supply is low and the energy storage is discharged. The power balance can also be maintained by trading power with the power supplier to gain benefits.
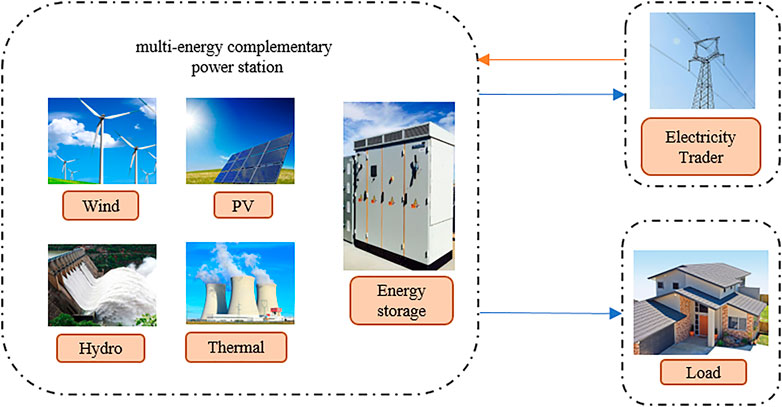
FIGURE 2. Overview diagram of the power plant operation scenario.
The main economic parameters of the units selected for wind, PV, water, thermal power, and ES systems are illustrated in Table 1. During the simulation process, the selected units’ economic parameters should be characterized by moderate cost and long service life. Due to the advantages of large installed capacity, high stability, long continuous discharge time, and wide regulation range, ES systems choose pumped storage. By using pumped storage power stations, the electricity system’s stability can be effectively improved and the utilization of its RE capacity can be enhanced.
Figure 3 shows the wind, PV, and hydropower output curves for a typical day in spring.
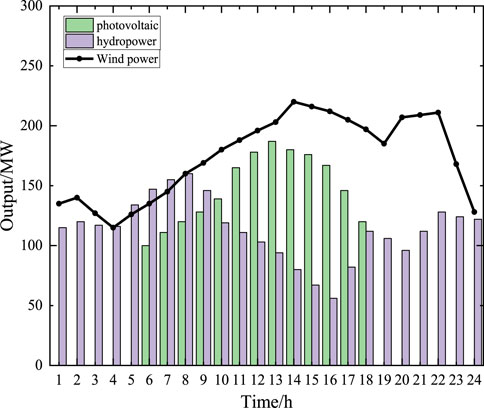
FIGURE 3. Daily output curve in spring.
In Figure 3, it can be seen that PV turbines mainly work from 12:00 to 14:00 and their output power peaks at 13:00. Hydropower units mainly work from 22:00 to 10:00 of the following day, and the output power peaks at 9:00. The wind turbines mainly work from 9:00 to 12:00, and the output power peaks at 15:00.
Figure 4 shows the wind, PV, and hydropower output curves for a typical day in summer.
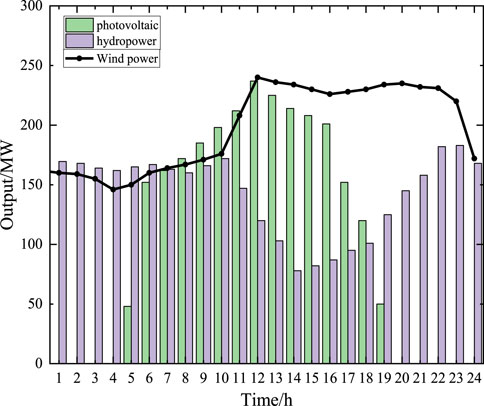
FIGURE 4. Daily output curve in summer.
In Figure 4, it can be seen that PV turbines mainly work from 6:00 to 18:00 and their output power peaks at 12:00. Hydropower units mainly work from 19:00 to 10:00 of the following day, and the output power peaks at 23:00. The wind turbines mainly work from 10:00 to 24:00, and the output power peaks at 13:00.
Figure 5 shows the wind, PV, and hydropower output curves for a typical day in autumn.
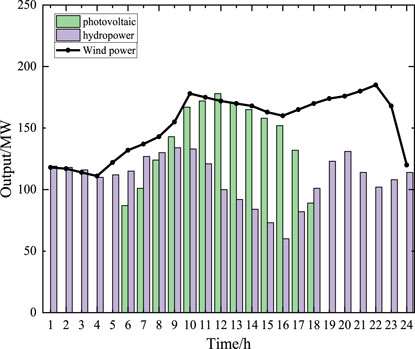
FIGURE 5. Daily output curve in autumn.
In Figure 5, it can be seen that PV turbines mainly work from 6:00 to 18:00, and their output power peaks at 12:00. Hydropower units mainly work from 19:00 to 14:00 of the following day, and the output power peaks at 20:00. The wind turbines mainly work from 8:00 to 24:00, and the output power peaks at 10:00 and 23:00.
Figure 6 shows the wind, PV, and hydropower output curves for a typical day in winter.
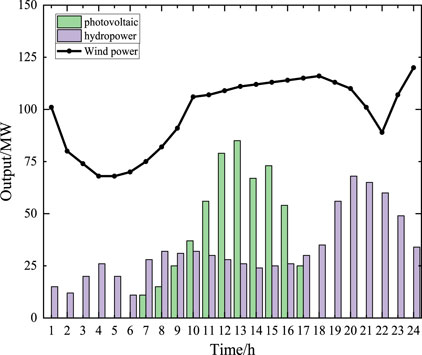
FIGURE 6. Daily output curve in winter.
In Figure 6, it can be seen that PV turbines mainly work from 10:00 to 16:00, and their output power peaks at 13:00. Hydropower units mainly work from 18:00 to 24:00, and the output power peaks at 20:00. The wind turbines mainly work from 9:00 to 24:00, and the output power peaks at 24:00.
As the typical day is highly representative, the criterion for selecting the typical day for all seasons is based on the day with the highest daily load. The RE output data for this typical day are then used as input data to more accurately reflect the operation of the power station.
By comparing the output curves for a typical day in spring, summer, autumn, and winter, it can be seen that the complementary situation of the three renewable resources is obvious and that the fluctuations in power generation can be reduced by making full use of the complementary t characteristics of the energy sources. This also illustrates again the indeterminate of RE and the necessity of establishing multi-energy complementary power stations. Therefore, the reasonable coordination of several energy sources can improve the utilization of RE and reduce the waste of resources.
Based on the original data on the province, the planning results can be obtained, and the added installed capacity of various electricity sources in the province is shown in Table 2. It can be found that wind power and PV have been put into operation every year during the planning period, and the capacity has been increasing year by year, which also shows that the development prospect of renewable resources is good and applicable. Thermal power is mainly used to take the basic load and part of the peak load of the system and has a relatively stable installed capacity during the planning period. Due to the influence of the construction period, independent hydropower units are not put into operation in the first 3 years of the planning period, while 490 MW and 1530 MW are put into operation in years 4 and 5, respectively. As shown in Table 2, ES units were commissioned according to the original plan of the province, and 800MW and 280 MW were commissioned in years 3 and 4 of the planning period, which were separate. The ES units were not put into operation in the fifth year. This is due to the optimization of the operating economy of the power station, which had already been optimized to the maximum in the third and fourth years, and further input is not conducive to the operation of the power station. Therefore, ES units are only put into operation in years 3 and 4.
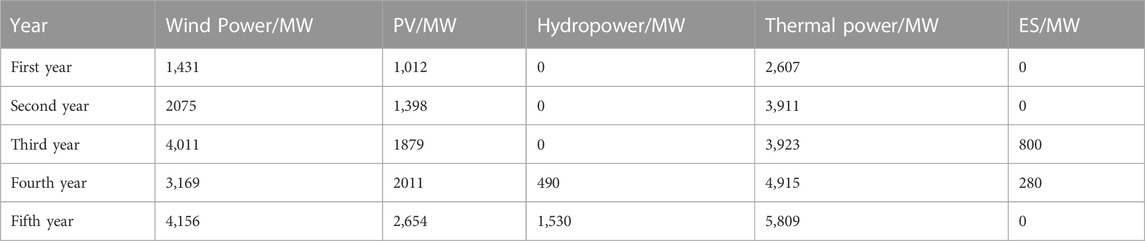
TABLE 2. New production capacity of various power supplies during the planning period.
From the aforementioned details, we can see that in the next 5 years, thermal power, wind power, and PV will become the leading power generation methods of the system, while the share of wind and PV power connected to the grid is expected to increase annually. The reason is that the incorporation of ES fully utilizes the complementary nature of various energy sources, improves the use of RE, and reduces the waste of renewable resources, which is an extremely important step in achieving low-carbon development in countries around the world.
Taking the fifth year as an example, the discharge curves of the typical days of ES in summer and winter are shown in Figures 7, 8. It can be observed that the peak discharge periods of ES in summer are mainly from 8:00 to 13:00 and 19:00 to 23:00, and the peak discharge periods of ES in winter are mainly from 10:00 to 11:00 and 19:00 to 23:00. The price of electricity is higher than usual during these periods, and the power station can sell electricity during these periods to generate increased revenue. Therefore, it is possible to get a clear picture of the operating revenue of the whole power station through the hourly operation of the ES system during a typical day.
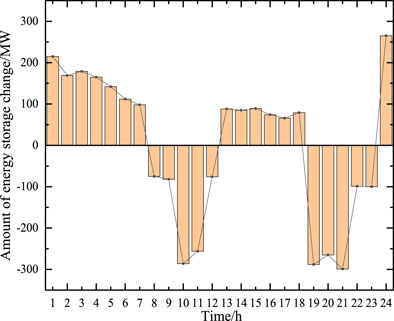
FIGURE 7. ES operation results in summer.

FIGURE 8. ES operation results in winter.
On the premise of promoting low-carbon development and improving the utilization of RE, a planning model is established in this article based on the characteristics of energy complementarity. The model takes full advantage of the complementarity of energy sources. Furthermore, the capacity changes of various types of installed energy devices in different time periods are analyzed, while the flexibility of the system is improved. By simulating the model, it is clear from the simulation results in Section 3 that in the next 5 years, energy complementarity will be fully utilized due to the access to the multi-energy complementary power station, and the use of renewable resources for power generation will increase.
The model of a multi-energy complementary power station based on digital technology developed in this study can improve the capacity of RE consumption. In contrast to existing models, the model in this study is more comprehensive in consideration. With a large number of RE sources connected to the grid, using the complementary relationship between energy sources to improve energy utilization has practical implications for reducing environmental pollution and for the electricity market.
The original contributions presented in the study are included in the article/Supplementary Material; further inquiries can be directed to the corresponding author.
SZ: responsible for research direction establishment, methodology design, writing—original draft preparation, and project administration. NZ: writing—original draft preparation, software, implementation of specific algorithms, investigation, and analysis of results. BW: data curation, analysis of results, visualization, validation, and writing—reviewing and editing.
The paper is supported by the National Natural Science Foundation of China (Project No. 62203004).
SZ was employed by Sungrow Renewables Development Co., Ltd.
The remaining authors declare that the research was conducted in the absence of any commercial or financial relationships that could be construed as a potential conflict of interest.
All claims expressed in this article are solely those of the authors and do not necessarily represent those of their affiliated organizations, or those of the publisher, the editors, and the reviewers. Any product that may be evaluated in this article, or claim that may be made by its manufacturer, is not guaranteed or endorsed by the publisher.
Auguadra, M., Ribó-Pérez, D., and Gómez-Navarro, T. (2023). Planning the deployment of energy storage systems to integrate high shares of renewables: The Spain case study. Energy 264, 126275. doi:10.1016/j.energy.2022.126275
Bazmohammadi, N., Tahsiri, A., Anvari-Moghaddam, A., and Guerrero, J. M. (2019). Stochastic predictive control of multi-microgrid systems. IEEE Trans. Industry Appl. 55 (5), 5311–5319. doi:10.1109/TIA.2019.2918051
Dong, H., Li, S., Dong, H., Tian, Z., and Hillmansen, S. (2020). Coordinated scheduling strategy for distributed generation considering uncertainties in smart grids. IEEE Access 8, 86171–86179. doi:10.1109/ACCESS.2020.2992342
Joseph, A., and Balachandra, P. (2020). Smart grid to energy internet: A systematic review of transitioning electricity systems. IEEE Access 8, 215787–215805. doi:10.1109/ACCESS.2020.3041031
Karimi, H., Jadid, S., and Hasanzadeh, S. (2023). Optimal-sustainable multi-energy management of microgrid systems considering integration of renewable energy resources: A multi-layer four-objective optimization. Sustain. Prod. Consum. 36, 126–138. doi:10.1016/j.spc.2022.12.025
Li, T., Chen, L., Jensen, C. S., Pedersen, T. B., Gao, Y., and Hu, J. “Evolutionary clustering of moving objects,” in Proceedings of the IEEE 38th International Conference on Data Engineering (ICDE)), Kuala Lumpur, Malaysia, May 2022, 2399–2411.
Li, T., Huang, R., Chen, L., Jensen, C. S., and Pedersen, T. B. (2020a). Compression of uncertain trajectories in road networks. Proc. VLDB Endow. 13 (7), 1050–1063. doi:10.14778/3384345.3384353
Li, Y., Gao, D. W., Gao, W., Zhang, H., and Zhou, J. (2021). A distributed double-Newton descent algorithm for cooperative energy management of multiple energy bodies in energy internet. IEEE Trans. Industrial Inf. 17 (9), 5993–6003. doi:10.1109/TII.2020.3029974
Li, Y., Gao, D. W., Gao, W., Zhang, H., and Zhou, J. (2020). Double-mode energy management for multi-energy system via distributed dynamic event-triggered Newton-raphson algorithm. IEEE Trans. Smart Grid 11 (6), 5339–5356. doi:10.1109/TSG.2020.3005179
Li, Y., Gao, W., Huang, S., Wang, R., Yan, W., Gevorgian, V., et al. (2021a). Data-driven optimal control strategy for virtual synchronous generator via deep reinforcement learning approach. J. Mod. Power Syst. Clean Energy 9 (4), 919–929. doi:10.35833/MPCE.2020.000267
Li, Y., Zhang, H., Liang, X., and Huang, B. (2019). Event-triggered-based distributed cooperative energy management for multienergy systems. IEEE Trans. Industrial Inf. 15 (4), 2008–2022. doi:10.1109/TII.2018.2862436
Liu, Z., Zhang, Z., Zhuo, R., and Wang, X. (2019). Optimal operation of independent regional power grid with multiple wind-solar-hydro-battery power. Appl. Energy 235, 1541–1550. doi:10.1016/j.apenergy.2018.11.072
Nunna, H. S. V. S. K., Sesetti, A., Rathore, A. K., and Doolla, S. (2020). Multiagent-based energy trading platform for energy storage systems in distribution systems with interconnected microgrids. IEEE Trans. Industry Appl. 56 (3), 3207–3217. doi:10.1109/TIA.2020.2979782
Olsen, D. J., Zhang, N., Kang, C., Ortega-Vazquez, M. A., and Kirschen, D. S. (2019). Planning low-carbon campus energy hubs. IEEE Trans. Power Syst. 34 (3), 1895–1907. doi:10.1109/TPWRS.2018.2879792
Oskouei, M. Z., Mohammadi-Ivatloo, B., Erdinç, O., and Erdinç, F. G. (2021). Optimal allocation of renewable sources and energy storage systems in partitioned power networks to create supply-sufficient areas. IEEE Trans. Sustain. Energy 12 (2), 999–1008. doi:10.1109/TSTE.2020.3029104
Ravada, B. R., Tummuru, N. R., and Ande, B. N. L. (2021). Photovoltaic-wind and hybrid energy storage integrated multisource converter configuration-based grid-interactive microgrid. IEEE Trans. Industrial Electron. 68 (5), 4004–4013. doi:10.1109/TIE.2020.2984437
Sanjari, M. J., Gooi, H. B., and Nair, N. K. C. (2020). Power generation forecast of hybrid PV–wind system. IEEE Trans. Sustain. Energy 11 (2), 703–712. doi:10.1109/TSTE.2019.2903900
shafiei, M., and Ghasemi-Marzbali, A. (2023). Electric vehicle fast charging station design by considering probabilistic model of renewable energy source and demand response. Energy 267, 126545. doi:10.1016/j.energy.2022.126545
Song, C., Xiao, J., Zu, G., Hao, Z., and Zhang, X. (2021). Security region of natural gas pipeline network system: Concept, method and application. Energy 217, 119283. doi:10.1016/j.energy.2020.119283
Sun, Y., Zhong, J., Li, Z., Tian, W., and Shahidehpour, M. (2017). Stochastic scheduling of battery-based energy storage transportation system with the penetration of wind power. IEEE Trans. Sustain. Energy 8 (1), 135–144. doi:10.1109/TSTE.2016.2586025
Tan, D., and Novosel, D. (2017). Energy challenge, power electronics and systems (PEAS) technology and grid modernization. CPSS Trans. Power Electron. Appl. 2 (1), 3–11. doi:10.24295/CPSSTPEA.2017.00002
Wang, X., Chang, J., Meng, X., and Wang, Y. (2018). Short-term hydro-thermal-wind-photovoltaic complementary operation of interconnected power systems. Appl. Energy 229, 945–962. doi:10.1016/j.apenergy.2018.08.034
Wei, H., Hongxuan, Z., Yu, D., Yiting, W., Ling, D., and Ming, X. (2019). Short-term optimal operation of hydro-wind-solar hybrid system with improved generative adversarial networks. Appl. Energy 250, 389–403. doi:10.1016/j.apenergy.2019.04.090
Xu, D., Yuan, Z.-L., Bai, Z., Wu, Z., Chen, S., and Zhou, M. (2022). Optimal operation of geothermal-solar-wind renewables for community multi-energy supplies. Energy 249, 123672. doi:10.1016/j.energy.2022.123672
Yang, L., Li, X., Sun, M., and Sun, C. (2023). Hybrid policy-based reinforcement learning of adaptive energy management for the energy transmission-constrained island group. IEEE Trans. Industrial Inf., 1–12. doi:10.1109/TII.2023.3241682
Yang, L., Sun, Q., Zhang, N., and Li, Y. (2022). Indirect multi-energy transactions of energy internet with deep reinforcement learning approach. IEEE Trans. Power Syst. 37 (5), 4067–4077. doi:10.1109/TPWRS.2022.3142969
Zhang, N., Sun, Q., Yang, L., and Li, Y. (2022). Event-triggered distributed hybrid control scheme for the integrated energy system. IEEE Trans. Industrial Inf. 18 (2), 835–846. doi:10.1109/TII.2021.3075718

Keywords: digital technology, multi-energy complementary, optimization planning, renewable energy, energy trading, energy storage system
Citation: Zou S, Zhang N and Wei B (2023) A capacity optimization and scheduling scheme of a multi-energy complementary power station considering energy trading. Front. Energy Res. 11:1194139. doi: 10.3389/fenrg.2023.1194139
Received: 26 March 2023; Accepted: 17 April 2023;
Published: 05 May 2023.
Edited by:
Yushuai Li, University of Oslo, NorwayReviewed by:
Yihuan Li, North China Electric Power University, ChinaCopyright © 2023 Zou, Zhang and Wei. This is an open-access article distributed under the terms of the Creative Commons Attribution License (CC BY). The use, distribution or reproduction in other forums is permitted, provided the original author(s) and the copyright owner(s) are credited and that the original publication in this journal is cited, in accordance with accepted academic practice. No use, distribution or reproduction is permitted which does not comply with these terms.
*Correspondence: Shaokun Zou, em91a3VuQHN1bmdyb3dwb3dlci5jb20=
Disclaimer: All claims expressed in this article are solely those of the authors and do not necessarily represent those of their affiliated organizations, or those of the publisher, the editors and the reviewers. Any product that may be evaluated in this article or claim that may be made by its manufacturer is not guaranteed or endorsed by the publisher.
Research integrity at Frontiers
Learn more about the work of our research integrity team to safeguard the quality of each article we publish.