 Chunhui Wang
 Zhigang Wu1*
 Zihui Lin
- 1School of Electric Power, South China University of Technology, Guangzhou, China
- 2Power Dispatching Control Center of Guangdong Power Grid Co., LTD., Guangzhou, China
In the construction of new power system, traditional methods and capabilities for regulating the power grid are no longer applicable due to the increasing types and quantities of source, load and storage agents. Currently, research on the participation of these agents in the electricity market has mainly focused on either traditional power systems or the demand side, without exploring the potential interaction between them. To address this issue, this paper proposes a real-time pricing regulation mechanism that incorporates source, load and storage agents into regulation. This mechanism is suitable for new power systems and satisfies the interests of the agents while meeting the needs of grid regulation. Specifically, it is based on time-of-use and real-time pricing regulation mechanisms. In a simulated scenario of load shifting, the proposed pricing regulation mechanism effectively meets the grid regulation requirements and improves the stability of grid operation. Overall, this approach offers a promising solution for the regulation of new power system with diverse and complex agents.
1 Introduction
The issue of carbon emissions is a global concern that constrains social development. The United Nations Framework Convention on Climate Change, passed by the United Nations General Assembly in 1992, is regarded as a good starting point for human society to address climate change. In December 2015, the Paris Agreement on Climate Change was adopted at the Paris Climate Conference, which set a long-term goal of limiting the global average temperature rise in the 21st century to within 2°C. In recent years, dozens of countries have successively proposed climate goals of “zero carbon” or “carbon neutrality,” which have become national strategies (Newell et al., 2019).
To promote the clean and low-carbon transformation of energy, building a new power system with the power supply dominated by new energy resources is the direction of future development for the power industry in China. In order to achieve the goals of “carbon peak in 2030, carbon neutralization in 2060,” Chinese Central Financial and Economic Conference in March 2021 clearly proposed the construction of a new power system with new energy as the agent. Therefore, it is necessary to vigorously develop new energies such as wind and solar energy. However, the high randomness and intermittency of new energy pose challenges to the stability of the power grid. As one of the largest carbon emitters, the power industry needs to deepen the reform of the power system and build a new power system that can adapt to and be compatible with new energies, so as to fulfill the obligation of carbon reduction and provide low-carbon, safe, and efficient power guarantee for the comprehensive construction of a modern country. In the context of the new power system, with the continuous emergence of new business models and patterns in the power industry, the demand for power services and consumption concepts is becoming increasingly diversified. Consequently, the business development and management of the power grid will undergo huge changes. Building a new power system poses multidimensional challenges in power production, consumption, transmission, and distribution, and requires designing a mechanism to meet energy demands, enhance social benefits, and provide effective support for the stable and efficient operation of the new power system (China Southern Power Grid Co., Ltd, 2021; China Southern Power Grid Co., Ltd, 2021; Chen et al., 2020; Zhou et al., 2018).
Previously, several scholars have argued that the power system is a complex system. They have used complex systems theory to conduct researches on the power system (Saleh et al., 2017; Zhao et al., 2021; Chen et al., 2021; You, 2021). Holland’s book “Emergence” mentions that there is emergent phenomena in complex systems, that is, the system of microscopic mechanisms of action of the agents at the macroscopic level emerge into the role and characteristics of the whole, a few rules and laws can produce complex systems, and in the form of changing new emergent phenomena (Holland, 2000). The nature of emergence arises from the interaction of altered physical objects (Langford and Langford, 2017). In the power system, the phenomenon of emergence is reflected in the interaction between source, grid, load and storage. In the new power system, these changes may lead to the emergence of new forms and functions due to the greater variety of agents and the significant increase in the number of agents. In order to ensure that the new power system achieves its predetermined functions, a set of rational mechanisms should be design to participate in this emergence process and to guide the micro-mechanisms between agents.
As the primary means of resource allocation, the market can provide effective assistance to coordinate the operation of the source, load, and storage. The traditional power market, which was mainly composed of large power plants, power grids, and large users, is no longer suitable for the market vision of involving full-chain users in transactions. With the access of huge amount of electric equipment, the market plays a decisive role in resource allocation. To meet the increasing demand for agent to participate in power market regulation, it is necessary to adjust or redesign existing market policies and mechanisms.
Currently, most research on the participation of source, load, and storage agent in the electricity market has focused solely on either the energy storage (Schick et al., 2020; Parvania et al., 2014; Su and El Gamal, 2013; Thatte and Xie, 2012) or the demand response aspect (Kirschen, 2003; Hao et al., 2016; Qdr, 2006; Sæle and Grande, 2011; Hobbs et al., 1993). At present, there is little research from the point of view of complex system theory on the regulation of market price guidance mechanisms for all agent participating in the power generation, load, and storage markets simultaneously. Furthermore, there is a lack of interactive trading mechanisms on the regulatory side to adapt to the vast amount of distributed and user-side resources. As a result, demand response has become difficult to promote in short time frames.
To address these issues, this paper proposes a real-time electricity price regulation mechanism that takes into account the background of the massive access of equipment in the new power system via multi-agent technique, including the increase in scale and business categories. This mechanism is designed to allow all agents of power generation, load, and storage to participate fully and adjust their own power generation and consumption strategies in response to changes in electricity prices. This is achieved through the simulation of peak shaving and valley filling scenarios in the power grid, which provides a background for the mechanism’s regulation. By doing so, this mechanism not only meets the interests of all agent involved but also fulfills the needs of power grid regulation.
2 The characteristics of new power system and the corresponding electricity market
2.1 The characteristics of new power system
The core task of power systems is to allocate the electric energy optimally to meet the energy demand of users. Therefore, in the traditional power system, the construction and operation of the power grid is designed by adjusting the output of large generators to meet the power demand of users, which is known as the “generation follows load” principle (McPherson and Stoll, 2020).
With the development of science and technology, the integration of massive power generation agent and large-scale new energy into the power system has made it difficult to predict the output of the power generation side. As the proportion of new energy continues to increase, the impact of the output fluctuations on the balance of power supply and demand is becoming increasingly severe. In some periods, there is abundant power supply while in other periods, power shortage becomes prominent. At the same time, the massive participation of electricity consumers in the power grid has made electricity demand further difficult to predict accurately.
To maintain the stability of the power system and the safety and convenience of electricity use by users, a new type of power system should be designed. The new power system has four important characteristics: safety and efficiency, clean and low-carbon, flexibility, and intelligent integration. Among them, safety and efficiency are the basic premise, clean and low-carbon is the core objective, flexibility is the important support, and intelligent integration is the basic guarantee. Together, the “four in one” framework system of the new power system has been constructed, which fully considers the market behavior of various agent involved in generation, transmission, distribution, and storage. The system should be designed to adapt to various agents, such as massive distributed energy and user-side resources, and to stimulate the enthusiasm of multiple agents to provide flexible services to the power grid.
In the traditional power system, the output of thermal and hydroelectric power plants is adjusted based on the current electricity demand information of users to achieve power balance. However, the changes in the types and scales of electricity consumers and electricity generators in the new power system make it more difficult to cope with the fluctuation. In traditional power systems, central agencies constrain the system to operate in a reasonable state by actively limiting uncertainty to tolerable ranges. On the contrary, in new power systems, full system control will not be possible, and randomness as an essential property is unlikely to be adequately limited proactively. What the grid needs to do is to design a mechanism to guide the uncertainty to a reasonable state. Electricity prices, as the core part of the electricity market, can intuitively reflect the relationship between electricity demand and supply. The tool of price regulation can guide various agent involved in generation, transmission, distribution, and storage to participate in power grid regulation and meet the operational requirements of the power grid.
The regulation mechanism adapted to the new power system should effectively reduce system power reserves and fill in power peaks and valleys, bringing significant economic and system reliability benefits. This paper will take the peak shaving and valley filling scenario as an example to analyze and study from the point of view of complex system that how the new mechanism of agent interaction brought by the power market in the new power system can demonstrate more advantageous grid operation effects.
2.2 Improved information systems in the new power system
The traditional scheduling automation system utilizes a “direct procurement and control” architecture (Bedi et al., 2018; Marzal et al., 2019; Franco et al., 2021) that is built based on business requirements. For example, in the Guangdong power grid of China, the scale of controlled items is approximately 10^5. However, with the massive influx of users into the power system, the number of control objects will increase by thousands of times, reaching a scale of 10^8. The traditional control system is no longer sufficient to control the resources of source, load, and storage efficiently and precisely.
In the current power grid automation system, the dispatch control is mainly based on the philosophy of “source-follow-load.” The corresponding “direct procurement and control” mode controls centralized objects such as thermal power, pumped storage, and nuclear power, and has become quite mature. However, the introduction of IoT and other related technologies along with the information system of traditional power systems can behave as the basic conditions to introduce additional interaction mechanism into the physical operation of the power system and fully tap the potential of various objects, thereby enhancing the operational efficiency of the power system.
The most important techniques mainly include the following.
2.2.1 Cloud computing
Cloud computing (A Vouk, 2008; Wang et al., 2008) is a type of distributed computing that involves breaking down large data processing programs into numerous small programs, which are then processed and analyzed through a system consisting of multiple servers connected over a network or “cloud.” The service types of cloud computing include Infrastructure as a Service (IaaS), Platform as a Service (PaaS), and Software as a Service (SaaS).
2.2.2 Edge computing
Edge Computing (Shi et al., 2016) is a computing paradigm that moves relevant application processing from centralized nodes to edge nodes to improve data processing efficiency and reduce latency caused by information transmission.
2.2.3 Cloud-edge collaboration
With the rapid development of communication technology and IoT, the power grid has proposed the distribution IoT as a solution for distribution network business (Bedi et al., 2018). The cloud analyzes and stores massive data and issues further instructions to the edge computing terminal, which then sends commands to various users and equipment. Cloud computing can connect huge system resource pools together to allocate corresponding computing and storage resources to edge computing terminals and users. The cloud-edge collaboration system can transfer some of the computing tasks originally belonging to the cloud computing center to the network edge equipment, thereby improving the processing efficiency of massive data.
The advent of new information technologies, such as communication technology and the Internet of Things (IOT) technology, has created additional opportunities for interactions between agents within the system. In traditional power system, due to the limitation of information technology, the grid control party has difficulty in real-time acquisition to the system for use of electrical information, which also makes it difficult to design the corresponding mechanism to guide the various parties of the system in the regulation. In the new power system, the addition of new information technology enables the power grid to understand the real-time power generation and consumption information and formulate current electricity prices through the study of historical power generation and consumption data. Various power generation and consumption agent can obtain real-time information on current electricity prices through IoT and adjust their current power generation and consumption accordingly. This research background involves multiple fields, such as power, IoT, and data analysis. Further exploration can be made on how to use advanced IT techniques to achieve intelligent power regulation, improve the efficiency and reliability of the power system, reduce the cost of power production and usage, and contribute to social and economic development.
It should be emphasized that this paper does not focus on the specific connotation of information technology itself, but rather on how the application of new technologies can provide a new mechanism for the all the participants in the new power system, especially how to provide technical conditions for the realization of the new power market mechanism described below.
2.3 Power market in the new power system
Research in the field of electricity markets began in the 1990s and has been ongoing for over 30 years. The traditional research approach starts from an economic perspective, using modeling methods such as microeconomics, econometrics, and game theory to study individual behavior (Pinto et al., 2013), and market conditions (Aliabadi et al., 2017) in the electricity market. The commonly used technical route is to model the individual optimal bidding decision process as a constrained optimization problem based on the assumption of complete rationality (Ruiz and Conejo, 2009; Vespucci et al., 2013), and to analyze the market game equilibrium process by combining multiple market participant models (Ruiz et al., 2011). These methods have a clear mathematical form, a clear economic meaning, and strong interpretability, making them the most widely used research approach in the field of electricity market research, achieving a large number of theoretical results.
However, traditional methods based on economic theory models have limitations that are closely linked to the lack of electricity market data in the past. Due to limitations in information technology, it was difficult for the power grid to obtain sufficient information on electricity consumption in the past, which made it challenging to use actual data for research purposes and to efficiently utilize massive data.
Since power system is a complex system, and the power market is indispensable for the power system, studying the microstructure and development of the market is conducive to the development of the power system, which has important practical significance. As information technology has advanced, the power grid is now able to access a vast amount of real-time electricity consumption data and analyze it, making it possible to overcome previous limitations.
The spot market plays a crucial role in the electricity market system, supporting the open, competitive, and orderly operation of the market and serving as a key factor in coordinating market transactions and ensuring system safety. It refers to a real-time market for immediate physical delivery of commodities (Morey, 2001) and typically includes three parts: the day-ahead market, intraday market, and real-time market. Each market has its own functional positioning and works together in an organized manner to form a complete spot market system.
The real-time electricity market offers several benefits, such as enabling power companies to compete more effectively, reducing consumers’ electricity costs, improving power system efficiency, and helping power systems to manage their energy supply and stability. By adjusting real-time market demand and supply, power companies can better handle unexpected events such as supply shortages or power failures to ensure the stability of the power system.
In this paper, by designing the price guidance mechanism of the real-time electricity market, the agent such as the source, load and storage are included in the power grid regulation system. In this regulation system, these agents can realize the power grid regulation demand through interaction. Similarly, this paper does not delve into the details of the power market, but rather focuses on exploring how the new interactions between various entities in the power system promoted by market mechanisms can provide stronger group effect capabilities, thereby achieving better results in scenarios such as peak shaving and valley filling.
3 The demand model for peak shaving and valley filling guided by market mechanism in new power system
3.1 Real-time electricity price guidance mechanism involving source, load and storage
With the development of technologies such as computing, control, and communication, the intelligence of power grid is experiencing rapid development as the power system and information technology converge. Traditional fixed pricing mechanisms are inadequate to match the rapid development of the power system. Demand response, with price response at its core, adjusts electricity prices in real time by collecting current electricity usage information, guiding users to conserve and use electricity efficiently. This has significant implications for the stable operation and low-carbon energy conservation of the power system (Campillo et al., 2016; Huang et al., 2019). Currently, the pricing mechanisms for demand response mainly include time-of-use pricing, adaptive pricing, peak pricing, and real-time price (RTP) (Yuanyuan et al., 2020; Dong et al., 2017). RTP is the most flexible item in price-based demand response. Based on the current pricing method of peak and valley periods in Guangdong Province, this paper divides a day into 96 periods, and combines time-of-use pricing and real-time electricity pricing methods to propose an improved real-time electricity price pricing method.
3.2 Agent types and their properties
In the new power system, due to the improvement of information technology means, more agents can participate in the regulation, so new mechanisms are needed to welcome these agents to play a new role. The agents participating in the price regulation of the electricity market can be divided into the following categories.
3.2.1 Virtual power plant (VPP)
VPP can be regarded as the integration of geographically dispersed distributed energy sources, energy storage systems, controllable loads, electric vehicles and other distributed energy resources through advanced communication and software architecture. It aggregates these resources into a single model through mathematical modeling, presenting itself as a unified agent, and uploads its own power usage information to the market platform for participation in regulation and control (Pudjianto et al., 2007). Due to the emergence of virtual power plants, the distributed energy, controllable load and other entities in the power system can interact with each other through advanced technical means. The virtual power plant discussed in this paper is mainly developed based on demand response, therefore controllable loads occupy the main component.
3.2.2 Large electricity customers (LEC)
Large electricity customers, including schools, factories, hospitals, and government agencies, etc., play an important role in the social, economic, and political life of countries and regions. They have a high demand for electricity and require a stable power supply.
3.2.3 Small electricity customers (SEC)
Small electricity customers include household users, electric vehicle users, and other users with a relatively small demand for electricity. They play a major role on the demand side of the power grid. By studying the electricity consumption habits of small users, the power grid control side can fully mobilize their enthusiasm to respond to the power grid control requirements.
3.2.4 Large-scale storage (LSS)
Large-scale storage can discharge during peak electricity demand and charge during low-demand periods. The existence of large-scale energy storage can assist in peak shaving and filling valleys in the power system, while also contributing to stable grid operation through profit from charging and discharging.
3.2.5 Wind power (WP)
Wind power, as a newly developed renewable energy source in the new power system, has significant scale and potential for further development.
3.2.6 Thermal power (TP)
At present, thermal power still occupies an important position as a traditional energy source.
3.2.7 Small hydro power (SHP)
Guangdong Province has abundant water resources that are widely distributed. Developing small hydropower in rural and remote mountainous areas can help address local electricity needs and promote economic development, making it a promising area for growth.
3.2.8 External power (EP)
The Guangdong province has a developed economy but lacks primary energy resources. Being close to the southwest region of China, which has abundant energy resources but slower economic development, Guangdong relies on external power as one of its important sources of electricity.
3.2.9 Small-scale power (SSP)
Small-scale power generation mainly consists of nuclear power and photovoltaic power, and the number of small power generation companies emerging in Guangdong Province is increasing, which has great development potential and will be an important source of power in Guangdong Province in the future.
From the above description, it can be seen that the main agents in the new electricity market can be divided into two categories. The first type of agents has large volume, but a small number, and its mechanism can still follow the traditional direct regulation method. The second type of agents are small, but its quantity is huge. The impact of a single source, load, and storage agent on the entire power grid regulation is relatively small, but when the number of agents develops to a larger scale, the interaction between a large number of source, load, and storage agents will have a significant impact on the power grid regulation, and this effect is mostly nonlinear, hence the complexity of research will also significantly increase. In the new power system, the number of agents participating in regulation has significantly increased compared to the past. It is of great significance to analyze the behavior of agents at the microscopic level and study the emerging phenomena of interactions between agents at the macroscopic level. At the microscopic level, each agent will make changes in their behavior based on current electricity price information in order to maximize their own interests. At the macroscopic level, changes in the electricity generation and consumption behavior of a large number of source, load, and storage agents will cause certain changes in the operation of the power grid. The power grid regulation side can further guide the electricity generation and consumption behavior of source, load, and storage agents to change in the desired direction by adjusting the electricity price.
In traditional power systems, due to the difficulty of grid scheduling caused by the randomness of users, the power market is mainly oriented towards large power sources and large users, mainly in the wholesale market, and the user side is relatively inactive. In the new power system, due to the improvement of information technology, the massive agents of source, load, and storage can widely participate in the regulation mechanism of the power market, which can lead to the emergence of new power consumption patterns and ecology, providing guarantee for the stable operation of the power system. Figures 1, 2 respectively show the operating mechanism of the power market in the traditional power system and the new power system. In Figures 1, 2, Large Electricity Customers and Large Electricity Producers are common regulatory agents in the power market under traditional and new power systems, and Large Electricity Producers include WP, TP, SHP, and EP power generation agents mentioned above.
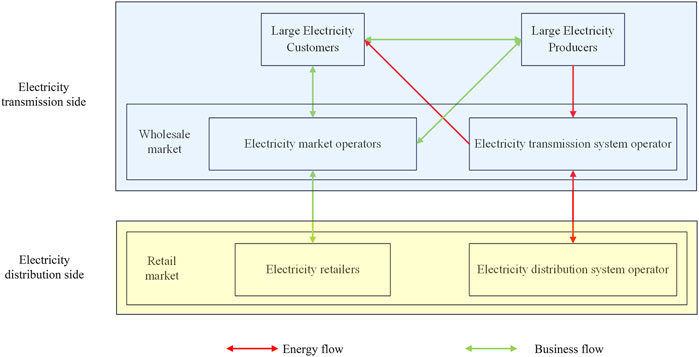
FIGURE 1. Electricity market in tradition power system.
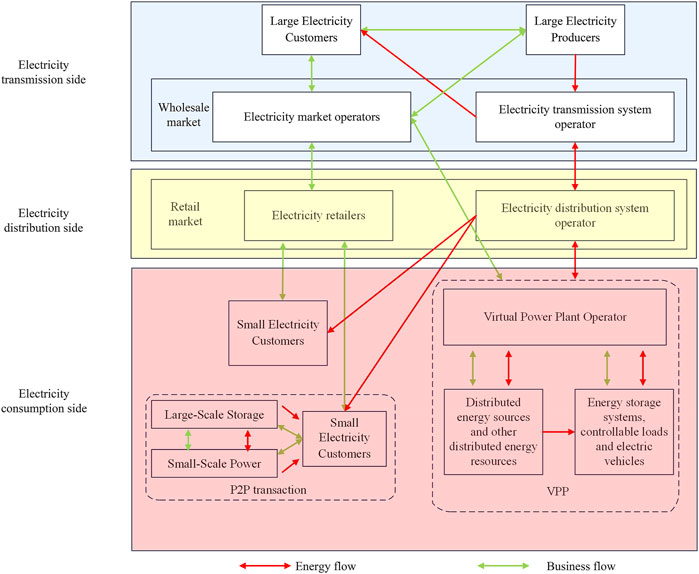
FIGURE 2. Electricity market in new power system.
3.3 Peak cutting and valley filling
Peak shaving and valley filling is a demand of power regulation aimed at avoiding overloading or under-supplying the power system during peak periods, in order to reach the balance of the electric power supply-demand. Specifically, this method involves storing electricity during off-peak periods or reducing electricity consumption, and then releasing the stored electricity or increasing electricity supply during peak periods, in order to ensure the stable operation of the power grid (Wang and Wang, 2013; Maly and Kwan, 1995). Due to the characteristics of electricity being unable to be stored in large quantities and production and consumption taking place almost simultaneously, the peak-to-valley difference in the load curve on the demand side is large. Therefore, it is necessary to use reasonable methods to shift some of the high load peaks to the low demand valleys in order to effectively reduce peak-to-valley differences, improve equipment utilization, and save energy. Peak shaving and valley filling, as a common method of power regulation, has practical significance to modeling the method.
3.4 Electricity market price guidance mechanism model
From the perspective of the overall welfare of the whole society, market is the most effective way of allocating resources. In China, the peak-valley electricity price division method is commonly implemented among electricity users. This method is based on a daily cycle and has three pricing prices: peak, flat, and valley, implemented during different time periods within 24 h. However, this time division strategy is difficult to adapt to the changes in load and cannot accurately reflect the actual demand of the current power system. Therefore, based on the current peak-valley pricing method of Guangdong Power Grid, this paper proposes a real-time electricity price guidance schedule. This schedule establishes a multi-agent electricity consumption characteristic model, adjusts the original electricity price based on the current real-time electricity consumption situation, and guides electricity consumers with different electricity consumption levels and price sensitivities to choose reasonable electricity consumption time periods and amounts. This approach aims to respond to the peak-load shifting demands of the power grid. The time scale of real-time electricity price changes is defined as 15 min. The following formula is used to adjust the electricity price.
The variables used in the formula are as follows:
In order to prevent collusion among power generation agent by controlling the amount of electricity generated and considering the generation cost and operating cost of power generation agent, this paper imposes the following constraints on the electricity price
Agents of different types have different upper and lower limits on their electricity generation or consumption, as well as different desires for price scheduling to respond to peak shaving and valley filling. As the electricity price changes, the response desires of various electricity generation and consumption agent will also change accordingly. This paper establishes a model for electricity generation and consumption agent based on their characteristics.
3.5 Solving algorithm
By inputting 96 time periods of electricity generation and consumption data, the grid control side can allocate the electricity generation and consumption of various agent during a day based on the input data. The allocated electricity generation and consumption in each time period of each agent is used as the initial data. The difference between the agent’s initial electricity generation or consumption in the current time period and the agent’s initial average electricity generation or consumption in each time period is used as a variable. The grid can adjust the electricity price according to the size of the difference to guide the agent’s electricity generation or consumption. Figure 3 shows the algorithm flowchart for adjusting electricity prices.
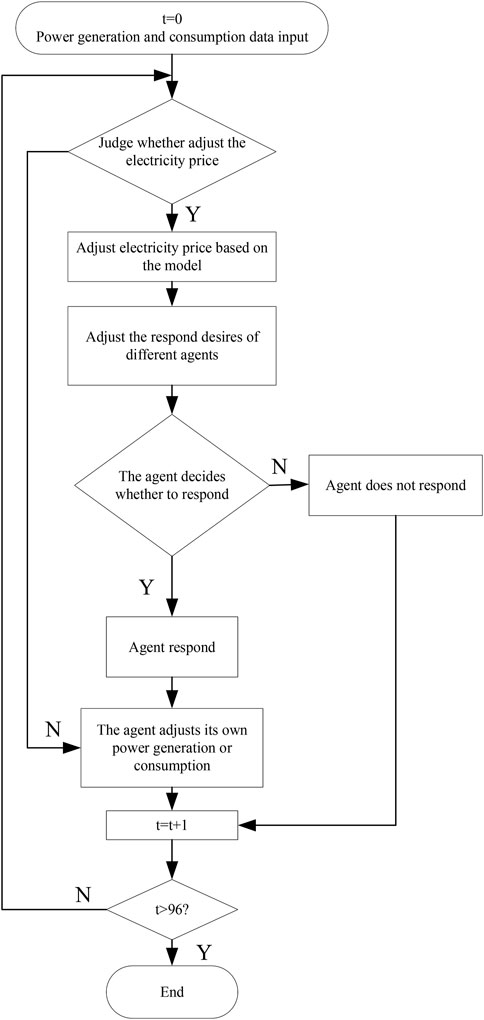
FIGURE 3. Price adjustment algorithm.
The peak shaving desire formula is,
The formula for power adjustment is,
To ensure the power balance of the entire power grid, this paper imposes constraints on the overall power generation, consumption, and energy storage, as shown in Formulas 8, 9, 10. The above formula mainly constrains the overall power of the agents and does not regulate a certain agent.
The electricity prices discussed in this paper are based on a bilateral mechanism, with a unified pricing system for both electricity generators and consumers. Each agent can adjust their electricity generation or consumption based on the price information they receive. Traditional power systems adopt unilateral pricing, and the bilateral pricing mechanism adopted in this paper can increase the overall benefits of the grid.
Benefits: The grid load curve is flatter, which can reduce the backup cost of the system for peak regulation.
The main purpose of the regulatory mechanism mentioned earlier is to achieve peak shaving and valley filling functions, which may lead to an increase in the final electricity price of users. To protect the interests of users, the electricity market settles electricity prices on a daily basis. Based on the effect of peak shaving and valley filling, and combined with changes in electricity prices, users are given certain subsidies. The specific subsidy method is shown in the following formula.
When the average electricity price after grid regulation is higher than the average electricity price before regulation, users will be given a certain degree of subsidy based on the effect of peak shaving and valley filling
The electricity fees subsidized by users are mainly reduced or exempted by the power grid after settling the electricity price. After the power grid calculates the compensation electricity fee, the final settlement of the electricity price is made to the user through the electricity market.
This paper compares the income situation of all parties before and after regulation by calculating the average expenditure or income price per kilowatt hour on the load side, energy storage side, and power generation side. The specific calculation method is shown in the following formula.
The above formulas are the average electricity cost calculation formulas, where
4 Simulation analysis
4.1 Case settings
Guangdong, the province with the largest provincial power grid and power trading market in China, has a unique advantage in building a power market that adapts to the new power system and putting it into operation. The power system reform pioneered in Guangdong Province has broken the traditional pattern of the power industry in China. Therefore, the case study analyzed in this paper uses a set of typical daily power generation and consumption data provided by the Guangdong Power Grid. The power generation and consumption agents studied are divided into nine types, as introduced in Section 3.2, and the initial power amounts for each individual agent of each type are supposed to follow a normal distribution. This paper analyzes the characteristics of these agents and considers practical factors to model the number, power range, and initial response desire of different types of agents. Tables 1, 2 display the model, where the response desire denotes the initial regulatory response desire of the power generation and consumption agent.
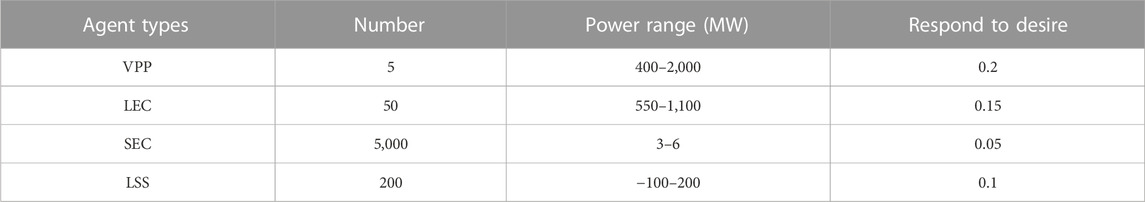
TABLE 1. Agent model of power consumption.
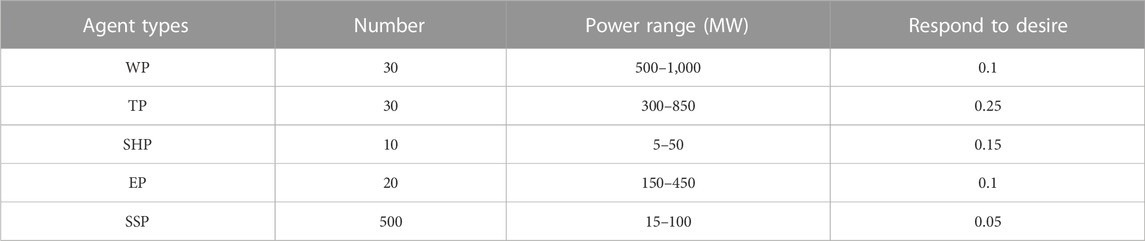
TABLE 2. Agent model of power generation.
In Table 1, a positive value for “power range” represents power consumption, while a negative value represents electricity generation. In Table 2, a positive value for “power range” represents power generation.
The given data is used as the initial value of the actual power generation and consumption curve for the day (divided into 96 time periods, with a 15-min interval between each time period). The data for the first time period is taken as the actual value for the first time period of the day, while the data for the other time periods is used as the initial value for the power generation and consumption curve for the day. At time
The data for basic power consumption scenarios is also used as a reference for price adjustment by the price-setting party in the peak-shaving scenario. Guangdong power grid sets prices according to peak, normal and valley power consumption periods, with a ratio of 1.7:1.0:0.38. Following this pricing model and time period division, this paper sets the actual basic electricity prices in the program for ease of analysis as follows:
In this paper, by analyzing the characteristics of different agents, the desire coefficients for them to participate in peak shaving and valley filling at different times of the day are set. The agent peak shaving desire coefficient are shown in Table 3.
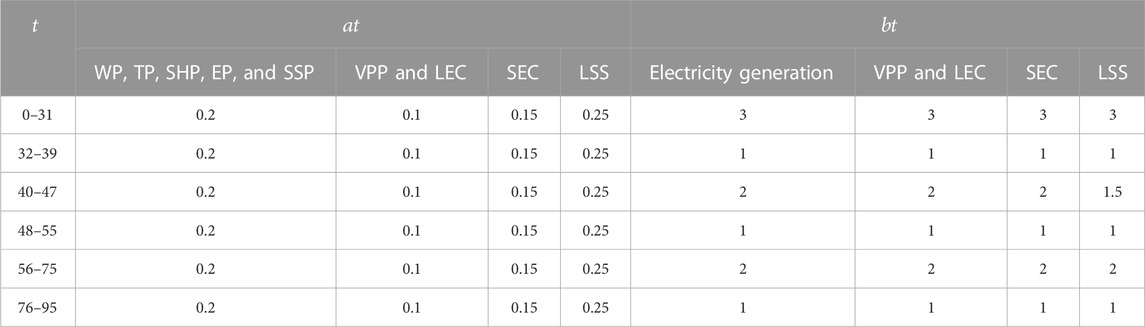
TABLE 3. The agent peak shaving desire coefficient.

TABLE 4. Basic electricity price value.
In this paper, the constraint on the actual electricity price is
4.2 Case data processing
This paper assigns numerical values to various agent such as power sources, loads, and energy storage based on the data in Tables 1, 2. It also constrains the amplitude range of power generation and consumption for each agent based on their characteristics.
Directly allocating data equally is not a realistic approach. Therefore, this paper proposes a method of decomposing the normal distribution of various agent’ values and allocating the decomposed values to each agent to better reflect the actual situation. At any given moment, the power generation and consumption agent have predicted power usage values. The power grid regulation side adjusts the electricity price based on these predicted values, thereby guiding the agents to change the actual power generation and consumption.
Considering the mechanical characteristics of power generation agent, actual power production characteristics, and the actual power consumption habits of power consumption agent, this paper places certain restrictions on the range of response changes of power generation and consumption agent to electricity prices at a specific moment.
The amount of power adjustment at time
4.3 Simulation tool
Because different agents have different power injection characteristics and different sensitivity to price, this paper adopts a multi-agent modeling method. The scenario studied in this paper is a complex system that changes with time. It is necessary to model the agent and link the behavior of the agent at the microscopic level to observe the phenomenon at the macroscopic level. The agent-based simulation can meet the research needs. NetLogo is a simulation platform launched by Uri Wilensky in the United States in 1999 and developed by the Connected Learning and Computer Modeling Center (CCL), which has continued to develop multiple versions in the future. It can provide a programmable modeling environment for modelers, model the agents to be studied and simulate the interaction between the agents.
4.4 Case analysis
During the simulation, the electricity elasticity coefficient
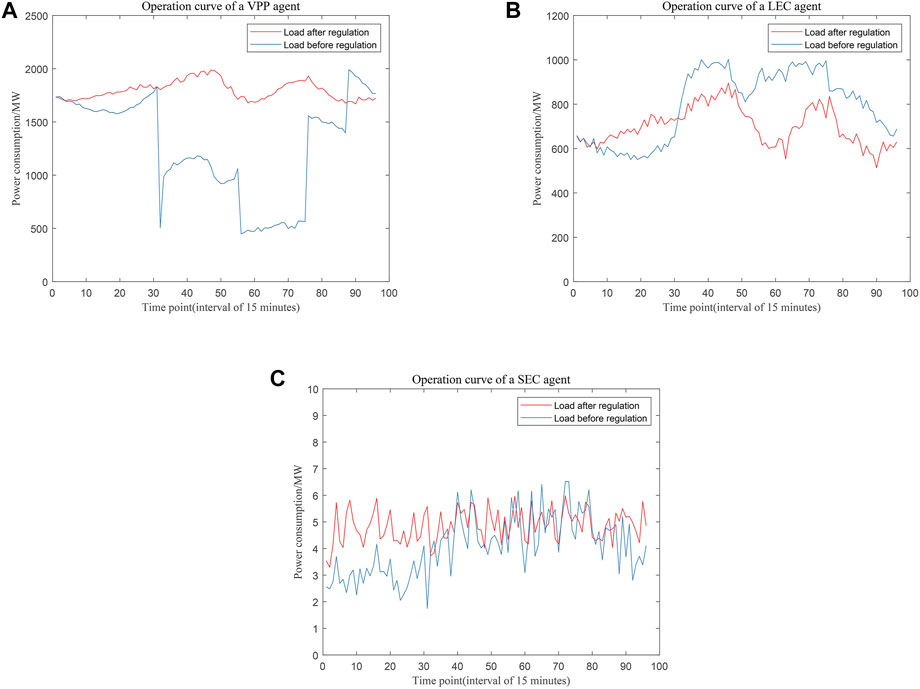
FIGURE 4. Individual operation curves of VPP, LEC, and SEC. (A) The operation curve of a randomly selected agent in VPP. (B) The operation curve of a randomly selected agent in LEC. (C) The operation curve of a randomly selected agent in SEC.
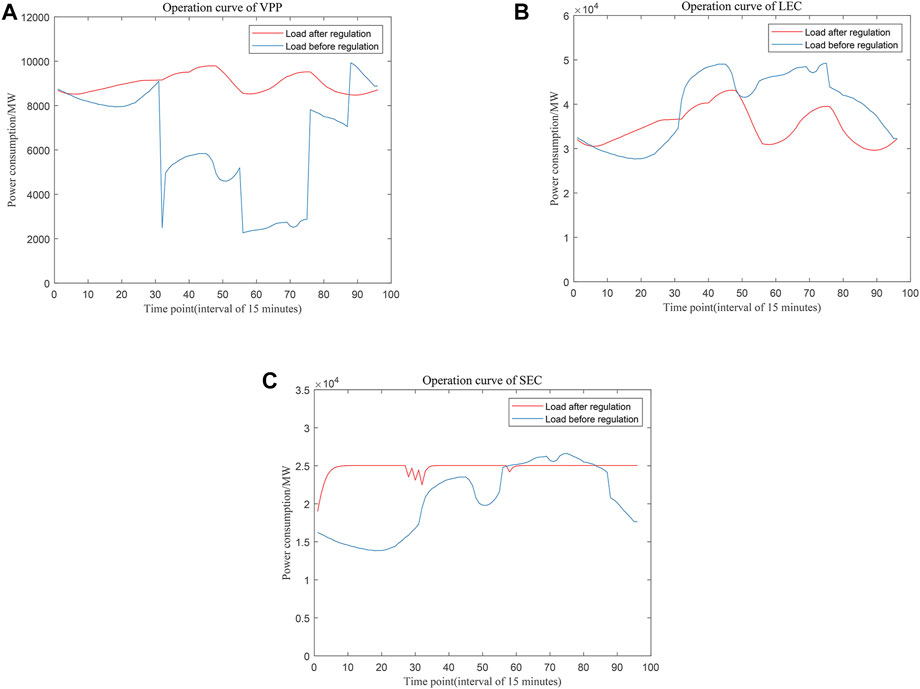
FIGURE 5. Overall operation curves of VPP, LEC, and SEC. (A) The overall operation curve of VPP. (B) The overall operation curve of LEC. (C) the overall operation curve of SEC.
Figure 4A shows the operation curve of a randomly selected agent in VPP, Figure 4B shows the operation curve of a randomly selected agent in LEC, and Figure 4C shows the operation curve of a randomly selected agent in LEC.
Figure 5A shows the overall operation curve of VPP, Figure 5B shows the overall operation curve of LEC, and Figure 5C shows the overall operation curve of SEC.
As shown in Figures 4, 5, although the operation of a single agent has a certain degree of randomness, under the interaction between multiple agents, the entire satisfactory regulatory results can still be achieved physically. This indicates that the agent has actively changed its behavior at the microscopic level due to the impact of market mechanisms, resulting in a global effect.
The simulation peak-shaving and valley-filling load curve is shown in Figure 6.
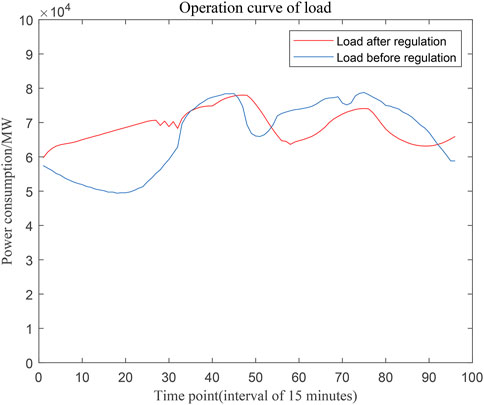
FIGURE 6. Load curves.
The load curve after electricity price regulation is smoother than the corresponding curve before regulation, as shown in the Figure 6. The mean square error
The simulated individual operating curves of WP, TP, SHP, EP, and SSP are shown in Figure 7 and the simulated overall operating curves of WP, TP, SHP, EP, and SSP are shown in Figure 8.
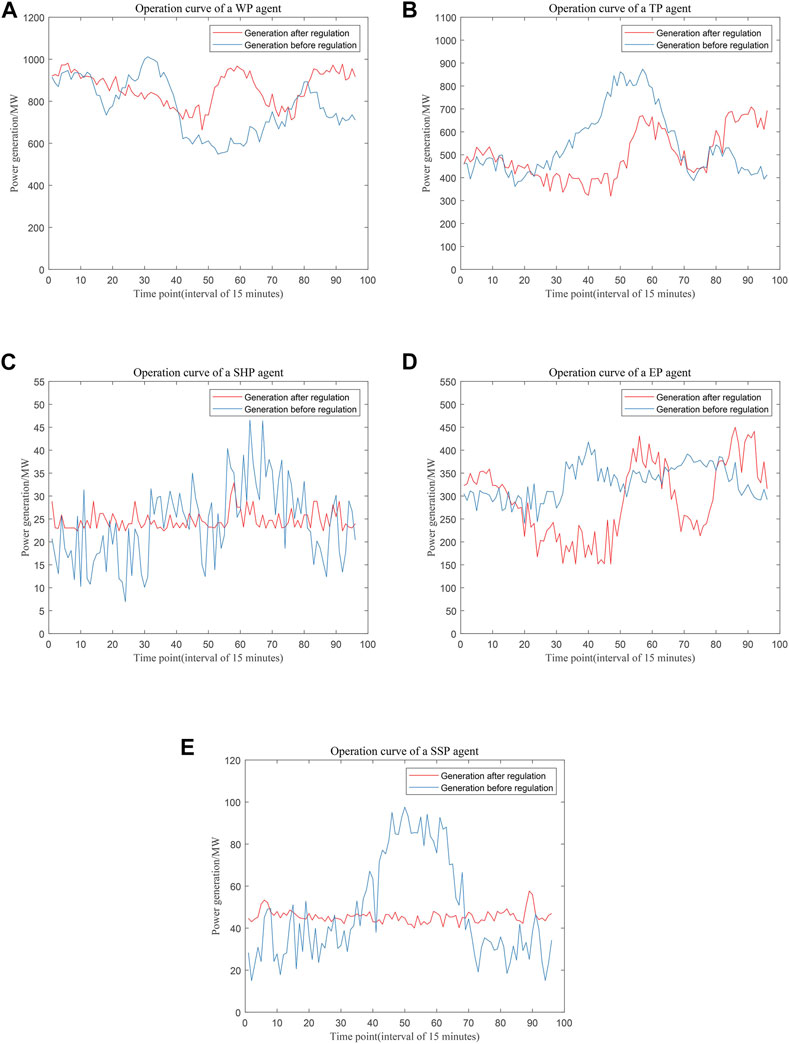
FIGURE 7. Individual operation curves of WP, TP, SHP, EP, and SSP. (A) The operation curve of a randomly selected agent in WP. (B) The operation curve of a randomly selected agent in TP. (C) The operation curve of a randomly selected agent in SHP. (D) The operation curve of a randomly selected agent in EP. (E) The operation curve of a randomly selected agent in SSP.
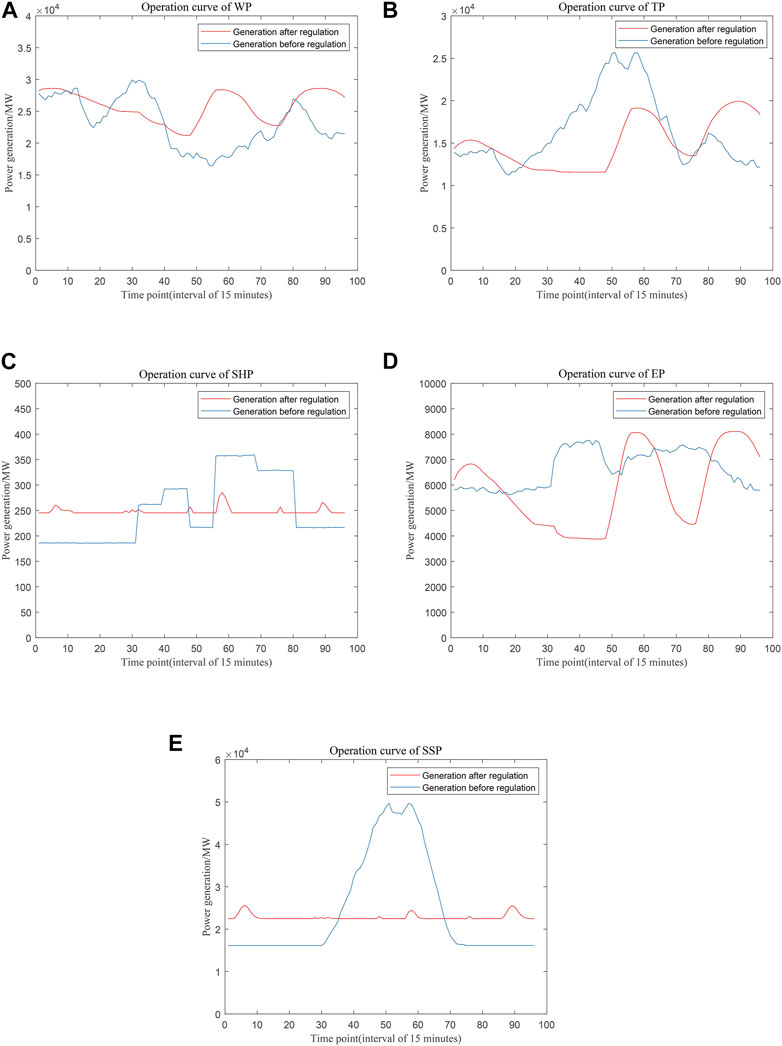
FIGURE 8. Overall operation curves of WP, TP, SHP, EP, and SSP. (A) The overall operation curve of WP. (B) The overall operation curve of TP. (C) The overall operation curve of SHP. (D) The overall operation curve of EP. (E) The overall operation curve of SSP.
Figure 7A shows the operation curve of a randomly selected agent in WP, Figure 7B shows the operation curve of a randomly selected agent in TP, Figure 7C shows the operation curve of a randomly selected agent in SHP, Figure 7D shows the operation curve of a randomly selected agent in EP, and Figure 7E shows the operation curve of a randomly selected agent in SSP.
Figure 8A shows the overall operation curve of WP, Figure 7B shows the overall operation curve of TP, Figure 7C shows the overall operation curve of SHP, Figure 7D shows the overall operation curve of EP, and Figure 7E shows the overall operation curve of SSP.
As shown in Figures 7, 8, although the operation of a single agent has a certain degree of randomness, under the interaction between multiple agents, the entire satisfactory regulatory results can still be achieved physically. This indicates that the agent has actively changed its behavior at the microscopic level due to the impact of market mechanisms, resulting in a global effect.
The simulated peak-shaving and valley-filling simulated power generation curve is shown in Figure 9.
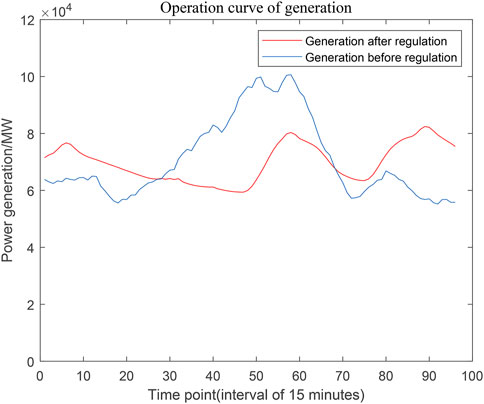
FIGURE 9. Power generation curves.
As shown in the Figure 9, the power generation curve after electricity price regulation is smoother than the curve before regulation. The mean square error
The simulated peak-shaving and valley-filling simulated storage curves are shown in Figure 10.
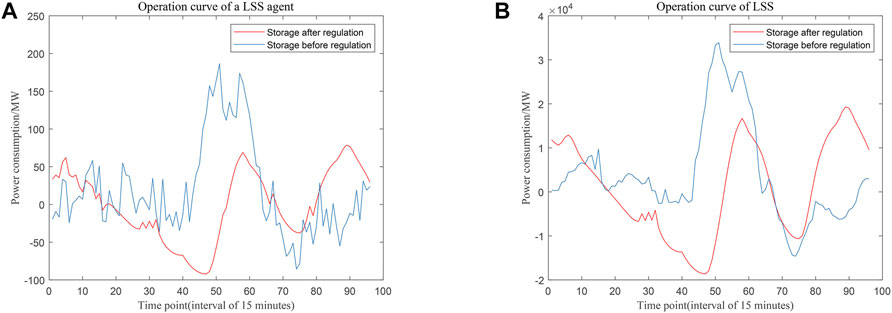
FIGURE 10. Individual and overall operation curves of LSS. (A) The operation curve of a randomly selected agent in LSS. (B) The overall operation curve of LSS.
Figure 10A shows the operation curve of a randomly selected agent in LSS, and Figure 10B shows the overall operation curve of LSS.
As shown in Figure 10, although the operation of a single agent has a certain degree of randomness, under the interaction between multiple agents, the entire satisfactory regulatory results can still be achieved physically. Storage also helps the power grid to achieve peak shaving and valley filling purposes, and due to market mechanism regulation, the peak value of energy storage power is also reduced, which can effectively reduce energy storage investment costs. This indicates that the agent has actively changed its behavior at the microscopic level due to the impact of market mechanisms, resulting in a global effect.
The operation curves of generation, load, and storage are shown in Figure 11, which shows that the power of the power grid is balanced.
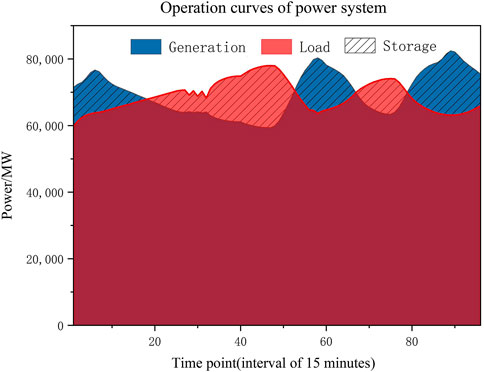
FIGURE 11. Operation curves of Power system.
The electricity price curve is shown in Figure 12.
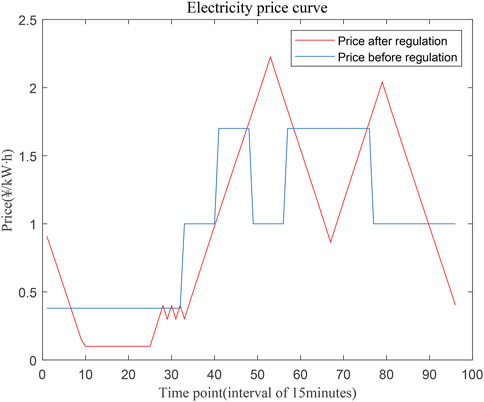
FIGURE 12. Electricity price curves.
The power grid guides the agents to respond by controlling changes in electricity prices to achieve regulatory purposes. Before the regulation, users had to pay an average electricity fee of 1.07¥
5 Conclusion
Based on the simulation results, it is evident that the peak-valley curve is notably smoother under the price regulation mechanism proposed in this paper. Under the effect of price regulation mechanism, the cost on the load side is reduced, the stability of electricity consumption is enhanced, and the cost on the energy storage side is also reduced. The narrowing of the gap between power generation and consumption effectively reduces system standby and improves economic efficiency.
In this paper, through the careful design of microscopic interaction mechanism between the agent, one can achieve satisfactory global control results, which shows that in the power grid, reasonable microscopic mechanism can effectively improve the system function. The integration of advanced information technology into the new power system has provided more agent for grid regulation. This allows the grid regulation side to obtain real-time information on current load and electricity consumption. By gathering extensive information on the electricity consumption habits of massive access agent, the grid regulation side can establish a model for the electricity consumption of these agent and study a price regulation mechanism that matches this model. This enables better alignment with the actual regulatory needs of the grid. Through IoT technology, regulatory agents in the power grid can obtain current electricity price information in a timelier manner and adjust their own power generation or consumption accordingly.
In future research, greater emphasis should be placed on exploring the potential of the new power system and devising more suitable regulation mechanisms to contribute to the safe and stable operation of the grid and reliable, convenient electricity consumption for users, thereby achieving a win-win situation for power generation and electricity consumption and promoting stable grid operation.
Data availability statement
The original contributions presented in the study are included in the article/supplementary material, further inquiries can be directed to the corresponding author.
Author contributions
CW: Conceptualization, methodology, software, writing-original draft; ZW: Methodology, writing-review and editing; ZL: Software; JL: Supervision, Project administration. All authors contributed to the article and approved the submitted version.
Funding
This work is supported by the Key-Area Research and Development Program of Guangdong Province under Grant 2019B111109002.
Acknowledgments
The authors thank the reviewers and editors for their valuable suggestions.
Conflict of interest
Author JL was employed by Power Dispatching Control Center of Guangdong Power Grid Co., LTD.
The remaining authors declare that the research was conducted in the absence of any commercial or financial relationships that could be construed as a potential conflict of interest.
Publisher’s note
All claims expressed in this article are solely those of the authors and do not necessarily represent those of their affiliated organizations, or those of the publisher, the editors and the reviewers. Any product that may be evaluated in this article, or claim that may be made by its manufacturer, is not guaranteed or endorsed by the publisher.
References
A Vouk, M. (2008). Cloud computing–issues, research and implementations. J. Comput. Inf. Technol. 16 (4), 235–246. doi:10.2498/cit.1001391
Aliabadi, D., Kaya, M., and Sahin, G. (2017). Competition, risk and learning in electricity markets: An agent-based simulation study. Appl. energy 195, 1000–1011. doi:10.1016/j.apenergy.2017.03.121
Bedi, G., Venayagamoorthy, G. K., Singh, R., Brooks, R. R., and Wang, K. C. (2018). Review of Internet of Things (IoT) in electric power and energy systems. IEEE Internet Things J. 5 (2), 847–870. doi:10.1109/jiot.2018.2802704
Campillo, J., Dahlquist, E., Wallin, F., and Vassileva, I. (2016). Is real-time electricity pricing suitable for residential users without demand-side management? Energy 109, 310–325. doi:10.1016/j.energy.2016.04.105
Chen, G., Dong, Y., and Liang, Z. (2020). Analysis and reflection on high-quality development of new energy with Chinese characteristics in energy transition. Proc. CSEE 40 (17), 5493–5506. doi:10.1109/ACPEE51499.2021.9436982
Chen, K., Zheng, N., Cai, Q., Li, Y., Lin, C., and Li, Y. (2021). Cyber-physical power system vulnerability analysis based on complex network theory. s.l., s.n., 482–486.
China Southern Power Grid Co., Ltd, (2021). Building a new power system action plan (2021-2030): White paper, Guangzhou, China China Southern Power Grid Corporation.
China Southern Power Grid Co., Ltd, (2021). Digital grid promotes the construction of a new power system with new energy as the main body: White paper. Guangzhou, China: China Southern Power Grid Corporation.
Dong, C., Ng, C., and Cheng, T. (2017). Electricity time-of-use tariff with stochastic demand. Prod. operations Manag. 26 (1), 64–79. doi:10.1111/poms.12610
Franco, P., Martinez, J., Kim, Y., and Ahmed, M. (2021). IoT based approach for load monitoring and activity recognition in smart homes. IEEE Access 9, 45325–45339. doi:10.1109/access.2021.3067029
Hao, H., Corbin, C., Kalsi, K., and Pratt, R. (2016). Transactive control of commercial buildings for demand response. IEEE Trans. Power Syst. 32 (1), 774–783. doi:10.1109/tpwrs.2016.2559485
Hobbs, B., Rouse, H., and Hoog, D. (1993). Measuring the economic value of demand-side and supply resources in integrated resource planning models. IEEE Trans. Power Syst. 8 (3), 979–987. doi:10.1109/59.260903
Huang, W., Zhang, N., Kang, C., Li, M., and Huo, M. (2019). From demand response to integrated demand response: Review and prospect of research and application. Prot. Control Mod. Power Syst. 4, 12–13. doi:10.1186/s41601-019-0126-4
Kirschen, D. (2003). Demand-side view of electricity markets. IEEE Trans. power Syst. 18 (2), 520–527. doi:10.1109/tpwrs.2003.810692
Langford, G., and Langford, T. (2017). The making of a system of systems: Ontology reveals the true nature of emergence. In 2017 12th System of Systems Engineering Conference (SoSE). IEEE, 1–5.
Maly, D., and Kwan, K. (1995). Optimal battery energy storage system (BESS) charge scheduling with dynamic programming. IEE Proceedings-Science, Meas. Technol. 142 (6), 453–458. doi:10.1049/ip-smt:19951929
Marzal, S., Gonzalez-Medina, R., Salas-Puente, R., Garcera, G., and Figueres, E. (2019). An embedded internet of energy communication platform for the future smart microgrids management. IEEE Internet Things J. 6 (4), 7241–7252. doi:10.1109/jiot.2019.2915389
McPherson, M., and Stoll, B. (2020). Demand response for variable renewable energy integration: A proposed approach and its impacts. Energy 197, 117205. doi:10.1016/j.energy.2020.117205
Morey, M. (2001). Power market auction design: Rules and lessons in market based control for the new electricity industry. Washington, DC, USA: Edison Electric Institute, 1–86.
Newell, R., Raimi, D., and Aldana, G. (2019). Global energy outlook 2019: The next generation of energy. Resour. Future, 1 8–19.
Parvania, M., Fotuhi-Firuzabad, M., and Shahidehpour, M. (2014). Comparative hourly scheduling of centralized and distributed storage in day-ahead markets. IEEE Trans. Sustain. Energy 5 (3), 729–737. doi:10.1109/tste.2014.2300864
Pinto, T., Praça, I., Vale, Z., Morais, H., and Sousa, T. M. (2013). Strategic bidding in electricity markets: An agent-based simulator with game theory for scenario analysis. Integr. Computer-Aided Eng. 20 (4), 335–346. doi:10.3233/ica-130438
Pudjianto, D., Ramsay, C., and Strbac, G. (2007). Virtual power plant and system integration of distributed energy resources. IET Renew. power Gener. 1 (1), 10–16. doi:10.1049/iet-rpg:20060023
Qdr, Q. (2006). Benefits of demand response in electricity markets and recommendations for achieving them, Tech. Rep. Washington, DC, USA: US Dept. Energy report.
Ruiz, C., and Conejo, A. (2009). Pool strategy of a producer with endogenous formation of locational marginal prices. IEEE Trans. Power Syst. 24 (4), 1855–1866. doi:10.1109/tpwrs.2009.2030378
Ruiz, C., Conejo, A., and Smeers, Y. (2011). Equilibria in an oligopolistic electricity pool with stepwise offer curves. IEEE Trans. Power Syst. 27 (2), 752–761. doi:10.1109/tpwrs.2011.2170439
Sæle, H., and Grande, O. (2011). Demand response from household customers: Experiences from a pilot study in Norway. IEEE Trans. Smart Grid 2 (1), 102–109. doi:10.1109/tsg.2010.2104165
Saleh, M., Esa, Y., Onuorah, N., and Mohamed, A. A. (2017). Optimal microgrids placement in electric distribution systems using complex network framework. In 2017 IEEE 6th International Conference on Renewable Energy Research and Applications (ICRERA). IEEE, 1036–1040.
Schick, C., Klempp, N., and Hufendiek, K. (2020). Role and impact of prosumers in a sector-integrated energy system with high renewable shares. IEEE Trans. Power Syst. 37 (4), 3286–3298. doi:10.1109/tpwrs.2020.3040654
Shi, W., Cao, J., Zhang, Q., Li, Y., and Xu, L. (2016). Edge computing: Vision and challenges. IEEE internet things J. 3 (5), 637–646. doi:10.1109/jiot.2016.2579198
Su, H., and El Gamal, A. (2013). Modeling and analysis of the role of energy storage for renewable integration: Power balancing. IEEE Trans. Power Syst. 28 (4), 4109–4117. doi:10.1109/tpwrs.2013.2266667
Thatte, A., and Xie, L. (2012). Towards a unified operational value index of energy storage in smart grid environment. IEEE Trans. Smart Grid 3 (3), 1418–1426. doi:10.1109/tsg.2012.2190114
Vespucci, M., Innorta, M., and Cervigni, G. (2013). A Mixed Integer Linear Programming model of a zonal electricity market with a dominant producer. Energy Econ. 35, 35–41. doi:10.1016/j.eneco.2011.11.021
Wang, L., Von Laszewski, G., Kunze, M., and Tao, J. (2008). Cloud computing: a perspective study. New generation computing. 128 137-146.doi:10.1007/s00354-008-0081-5
Wang, Z., and Wang, S. (2013). Grid power peak shaving and valley filling using vehicle-to-grid systems. IEEE Trans. power Deliv. 28 (3), 1822–1829. doi:10.1109/tpwrd.2013.2264497
You, Y. (2021). The studying of power grid planning based on complex adaptive system thoery. In 2021 6th International Conference for Convergence in Technology (I2CT). IEEE, 1–4.
Yuanyuan, L., Junxiang, L., Yazheng, D., and Yan, G. (2020). Smoothing Newton algorithm for real-time pricing of smart grid based on KKT conditions. J. Syst. Sci. Math. Sci. 40 (4), 646. doi:10.12341/jssms13843
Zhou, X., Chen, S., and Lu, Z. (2018). Technical characteristics of China's new generation power system in energy transition. Proc. CSEE 38 (7), 1893–1904.
Keywords: new power system, price regulation, demand response (DR), real-time price (RTP), virtual power plant (VPP), peak cutting and valley filling
Citation: Wang C, Wu Z, Lin Z and Liu J (2023) Multi-agent interaction of source, load and storage to realize peak shaving and valley filling under the guidance of the market mechanism. Front. Energy Res. 11:1192587. doi: 10.3389/fenrg.2023.1192587
Received: 23 March 2023; Accepted: 15 May 2023;
Published: 25 May 2023.
Edited by:
Hui Hwang Goh, Guangxi University, ChinaReviewed by:
Linfeng Yang, Guangxi University, ChinaWei Dai, Guangxi University, China
Dongdong Zhang, Guangxi University, China
Copyright © 2023 Wang, Wu, Lin and Liu. This is an open-access article distributed under the terms of the Creative Commons Attribution License (CC BY). The use, distribution or reproduction in other forums is permitted, provided the original author(s) and the copyright owner(s) are credited and that the original publication in this journal is cited, in accordance with accepted academic practice. No use, distribution or reproduction is permitted which does not comply with these terms.
*Correspondence: Zhigang Wu, ZXB6Z3d1QHNjdXQuZWR1LmNu