 Jianyou Zhao1
 Juanying Zhou
- 1School of Automobile, Chang’an University, Xi’an, China
- 2College of Automotive Engineering and General Aviation, Shaanxi Vocational and Technical College, Xi’an, China
- 3College of Automobile, Shaanxi College of Communication Technology, Xi’an, China
- 4College of Transportation Engineering, Chang’an University, Xi’an, China
A real-time adaptive energy management strategy (EMS) used a model-based predictive control algorithm that continuously adapted to the changing driving patterns and traffic conditions. With battery degradation in an operation being considered, the algorithm was designed to minimize the total cost of electricity consumed by vehicles with hybrid energy storage systems (HESSs) while ensuring that the battery and supercapacitor cell were not overcharged or overdischarged. First, the objective function was taken as the instantaneous minimization of the comprehensive cost. Second, a hierarchical instantaneous optimal control EMS (HIOC-EMS) was suggested to solve the optimal power coupling coefficient of the supercapacitor that satisfied the constraints at any moment. Third, the HIOC-EMS was proven to be an efficient and robust method for optimizing the energy management system of HESSs. The experimental results of three different driving cycles showed that the HIOC-EMS, when compared to the particle swarm-optimized fuzzy EMS (PFZY-EMS), achieved reductions in battery losses of 18.41%, 13.94%, and 20.37% and comprehensive cost reductions of 11.16%, 7.37%, and 9.61%, respectively, in the three cycles. Furthermore, compared to the dynamic programming EMS (DP-EMS), the HIOC-EMS resulted in increased battery losses of 14.87%, 10.77%, and 4.87% and increased comprehensive costs of 8.48%, 2.98%, and 1.55%, respectively. These results proved the effectiveness of the HIOC-EMS in reducing the usage cost of electric vehicles with HESSs.
1 Introduction
Electric vehicles (EVs) are the future of sustainable transportation. With their low energy consumption and simple power system structure, EVs offer a cost-effective and environmentally friendly alternative to traditional gasoline-powered vehicles. As the world shifts toward a more sustainable future, EVs have emerged as the inevitable choice for those seeking a cleaner and greener transportation option. The instantaneous high charge/discharge rate, battery temperature, and long-term high workload will lead to the degradation of power battery performance, shortened life cycles, and increased EV usage costs (Martel et al., 2016; Wu et al., 2017; Ji et al., 2020). Although supercapacitors offer benefits such as high power density and long service life, they have the drawback of having low specific energy. As a result, they are not suitable as the sole power source for EVs (Dubal et al., 2014). To address this limitation, hybrid energy storage systems (HESSs) for EVs have been developed, which integrate supercapacitors and power batteries (Zhao et al., 2012; Song et al., 2017a; Huan et al., 2019). HESSs leverage the strengths of both components, utilizing the high specific power of supercapacitors and the high specific energy of power batteries. Additionally, they efficiently capture the kinetic energy during braking. These advantages and capabilities are vital for safeguarding power batteries, enhancing a vehicle’s range (Dubal et al., 2014), and reducing the overall vehicle operating costs.
In order to enhance the overall efficiency and power of the vehicle, HESSs adopt an effective energy management strategy (EMS) that enables the optimal distribution of power between supercapacitors and batteries. This approach helps in increasing the cost efficiency and effectiveness of the system, ensuring that power is allocated in a manner that maximizes performance across the board (Yao et al., 2019). The aging of power batteries deepens along with the increase in operating time, and the power battery cost accounts for a large proportion of the overall vehicle cost. Currently, there are two commonly used types of EMSs: rule-based and optimization-based EMSs (Panday and Bansal, 2014). Rule-based EMSs include strategies based on logic thresholds and fuzzy control, while optimization-based EMSs utilize dynamic planning algorithms, genetic algorithms, and convex optimization techniques.
However, little research has considered the impact of the power battery aging degree on the power allocation in HESSs consisting of supercapacitors and power batteries. Wang (2018) studied EVs with HESSs and designed a logic threshold control strategy after considering the state of charge (SOC) of supercapacitors, power batteries, and the motor power of an EV. These findings indicate that the approach can enhance the performance of vehicles and mitigate the maximum power demand on the battery. To avoid high currents in the charging and discharging of power batteries during operation, Hu et al. proposed a composite fuzzy control strategy to obtain the optimal output power of power batteries (Hu et al., 2018). Sisakat et al. developed a fuzzy control EMS that incorporates the performance characteristics of HESSs. The fuzzy rules were used to determine the optimal discharge power of power batteries and supercapacitors, resulting in reduced current fluctuation in the batteries (Sisakat and Barakati, 2016). Santucci et al. introduced the battery capacity loss model and adopted dynamic programming to achieve the optimal energy distribution of HESSs, which can optimize the battery life and reduce the cost of HESSs (Santucci et al., 2014). Based on the battery life model, Xie et al. integrated energy consumption cost and the equivalent battery life loss cost in the design of the EMS and concluded that including the battery life into the strategy significantly increased the battery cycle life compared to the strategy that did not consider the battery life (Xie et al., 2019a). Zhou et al. used the genetic algorithm to optimize the fuzzy membership function and fuzzy control rules (Zhou et al., 2017). Furthermore, to avoid problems of the high computational burden of dynamic programming and suboptimal results from search algorithms, Song et al. proposed an EMS based on convex optimization, which found a globally optimal solution close to dynamic programming and significantly improved the computational efficiency (Song et al., 2017b).
To sum up, control rules of the fuzzy control strategy rely on expert experience and require only simple algorithms. However, a significant gap exists between the optimization effect of the strategy and the globally optimal result (Zhang et al., 2015; Xu et al., 2017), and the strategy is also subjective (Zhang et al., 2017). Dynamic programming can produce the optimal solution for a problem, but it is unsuitable for real-time applications as it requires a significant amount of computation time. Convex optimization needs prior convex processing before its application, which is difficult to implement. Instantaneous optimization control (IOC), as a typical algorithm of the instantaneous optimization algorithm, has real-time advantages and is highly practical in applications. Hence, the algorithm is gaining increasing attention in industrial control.
Given that the aforementioned EMSs do not consider the battery aging cost and exhibit problems such as poor optimization effects, long computation time, and difficulties in practical applications, this paper established a comprehensive cost function (including the cost of electricity consumption of HESSs and the aging cost of power batteries) for operating EVs with HESSs composed of supercapacitors and power batteries. In order to minimize the instantaneous comprehensive cost, the function took into account the battery aging cost, used the instantaneous supercapacitor and power battery SOC as the state variables, and the hierarchical instantaneous optimization control (HIOC) algorithm to solve the optimal power coupling coefficient of a supercapacitor that satisfied the constraints at any time. Based on the aforementioned method, a novel EMS was developed with good real-time optimization effects.
2 Overall vehicle model of pure EVs
2.1 Overall vehicle parameters and power train configuration
Table 1 lists the major overall parameters of EVs.
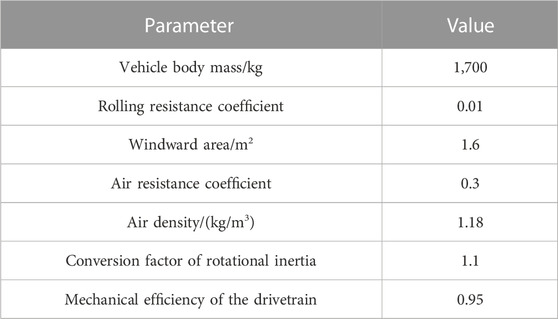
TABLE 1. Main parameters of the vehicle simulation model.
Figure 1 presents the schematic diagram of the EV power train structure. Its main components include a ternary lithium battery pack, a supercapacitor pack, and a drive motor. As shown in Figure 1, the motor, main gear reducer, and tires are mechanically connected; the vehicle controller, BMS, EMS, and DC–DC converter are connected by signals; the rest of the components are electrically connected. The HESS structure of the EV model is a semi-active structure with the power battery, BMS, EMS, and the motor controller connected in series to form a bus. The supercapacitor and DC–DC converter are connected first in series and then in parallel to the bus line. This HESS configuration allows the power battery to fulfill the vehicle range requirements and enables the supercapacitor to deliver a short-term high-power output to meet the power demands of the vehicle.
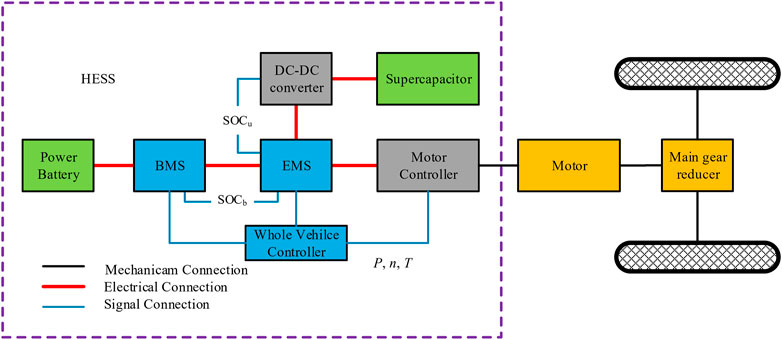
FIGURE 1. EV power system structure.
2.2 Longitudinal dynamics model of whole vehicles
The paper mainly studied the EMS of EVs with supercapacitors in their HESSs, so only the kinematic characteristics along the longitudinal driving direction were considered. For the whole vehicle required power model, the equation of the longitudinal force state during driving was adopted (Liu et al., 2019). This study utilized the method of backward simulation to estimate the energy needed for vehicular propulsion based on the velocity and acceleration patterns of driving cycles. The resulting equation is as follows:
where Preq denotes the required power (kW); m indicates the total vehicle mass (kg); g signifies the gravitational acceleration (m/s2); f represents the rolling resistance coefficient; θ stands for the road ramp angle (°); A signifies the windward area (m2); Cd denotes the wind resistance coefficient; ρ indicates the air density (kg/m3); v stands for the vehicle driving speed (m/s); δ represents the rotational inertia conversion factor; and q denotes the exponential coefficient.
3 HESS structure and power component model
3.1 HESS structure
HESSs have various types of structures. Figure 1 shows the structure in which a supercapacitor is in parallel with a battery pack. This design features a bi-directional DC–DC converter in a series connection, which offers advantages such as affordability, simplified construction, and straightforward management. A system is implemented to manage the energy flow of the structure by monitoring the parameters, such as the SOC of the battery (SOCb), the SOC of the supercapacitor (SOCu), and electricity consumption. This allows for the computation of the power generated by the supercapacitor and power battery (Zhou et al., 2019).
3.2 Motor model
The permanent magnet synchronous motor is widely recognized as the most suitable motor for EVs due to its exceptional attributes, such as precise control, consistent torque output, high torque density, and minimal noise (Chen et al., 2021). This article chose a motor with up to 8,000 rotations per minute, a maximum power of 105 kilowatts, and a maximum torque of 1800 Nm. The electric power of the drive motor can be expressed in an expression related to the motor output power and efficiency, i.e.,
where Pem denotes the electric motor power (kW); Tm indicates the torque (N·m); ωm signifies the rotational speed (r/min); ηm represents the efficiency of the motor; and sign stands for the sign function.
Figure 2 shows the functional relationship between the torque and rotational speed. The motor efficiency was calculated based on the current motor torque and speed obtained using the look-up table approach.
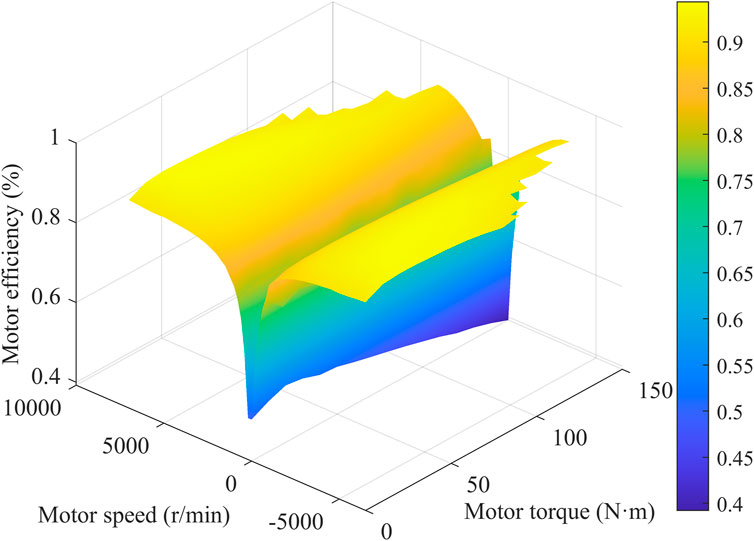
FIGURE 2. Motor efficiency model.
3.3 Bus power balance model
The bus power expression is given by the following:
where Pdri denotes the drive power (kW); Pbat signifies the power received and delivered by the battery pack (kW); Pu indicates the supercapacitor power (kW); Pre stands for the bus power during energy recovery (kW); and ηDC–DC represents the DC–DC conversion efficiency, which is obtained by polynomial fitting based on the actual collected data (Xie et al., 2019b), as shown in Figure 3.
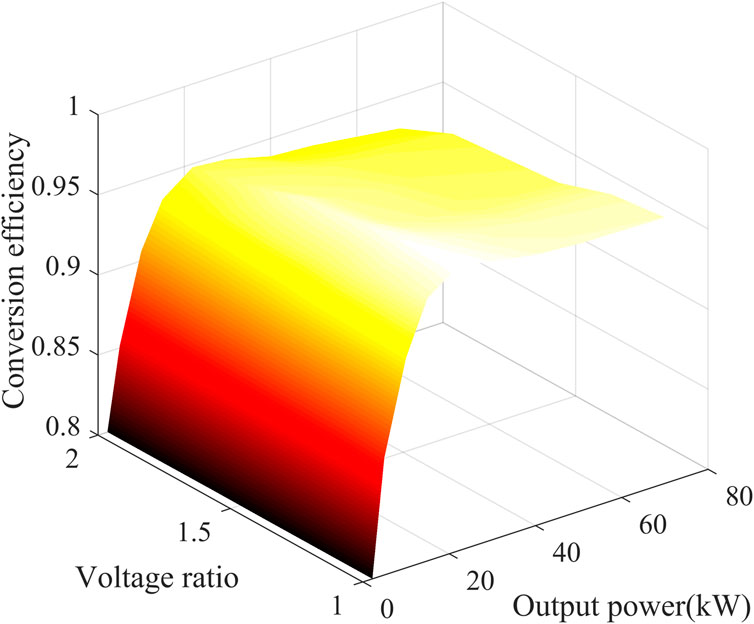
FIGURE 3. DC–DC efficiency.
3.4 HESS model
3.4.1 Supercapacitor model
Figure 4 shows the supercapacitor model and the relationship between the open-circuit voltage and the SOC variation of the supercapacitor.
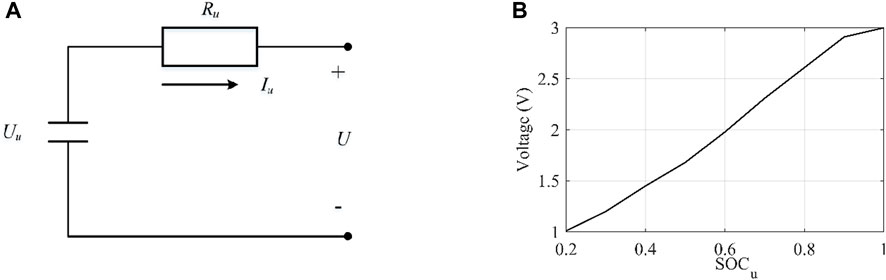
FIGURE 4. Diagram of a supercapacitor model and the relationship between SOC changes and the open-circuit voltage; (A) supercapacitor model; (B) relationship between the open-circuit voltage and SOC variations of a supercapacitor.
The supercapacitor consists of 133 monoliths connected in a series to form a group and a rated voltage of 399 V. The monolith model in supercapacitors is based on the open-circuit voltage-internal resistance state variation model, which can be expressed as follows:
Furthermore, the supercapacitor output power is as follows:
where Uu is the supercapacitor output voltage (V); U denotes the supercapacitor open-circuit voltage (V); Iu is the supercapacitor current (A), which is positive for discharging and negative for charging; and Ru is the equivalent internal resistance of the capacitor (Ω).
3.4.2 Battery model
(1) Battery circuit model
Figure 5 shows the battery model and the battery internal resistance model. The Rint model of the internal resistance voltage was adopted for the battery cell model (He et al., 2015).
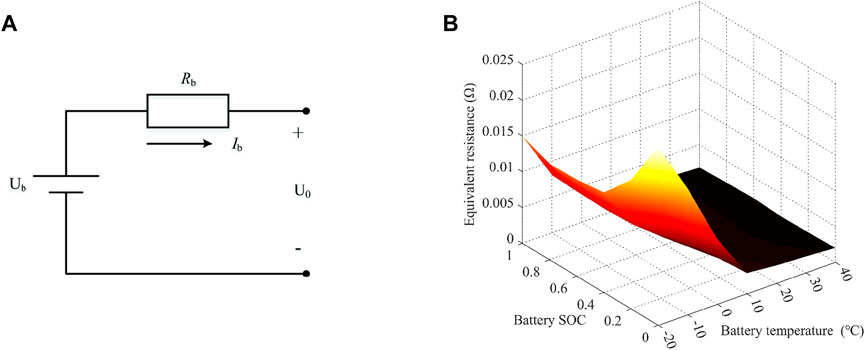
FIGURE 5. Battery model and battery internal resistance model: (A) battery model; (B) battery SOCs versus the battery internal resistance and temperature.
The expressions for the open-circuit voltage and equivalent internal resistance of the battery pack are as follows:
where Vb stands for the total rated voltage of the battery pack (V); nbs is the number of series connections in the battery pack; Ub denotes the battery output voltage (V); U0 is the open-circuit voltage of the battery (V); and Rb signifies the equivalent internal resistance of the battery (Ω), including the internal ohmic resistance, concentration polarization resistance, and charge transfer resistance; as shown in Figure 5B, Rb is determined by both the battery SOC and the temperature of the battery’s surrounding environment (Du et al., 2020), and Ib denotes the battery current (A), which is expressed as follows:
where Pb denotes the input–output power of the battery pack (kW).
The current SOC value of the power battery was calculated by the integration method with the following expression:
where SOC0 is the initial value of the SOC.
(2) Battery thermal model
The power battery temperature-rise model adopted Bernardi’s heat production model (MASOUD and TARE YELMEK, 2014), with the following expression:
where dTem/dt is the Kelvin temperature increment of the battery; mb_s denotes the mass of a single-cell battery (kg); Cp denotes the equivalent specific heat capacity of the battery (J/(kg·K)); dE0/dTem denotes the temperature-rise coefficient; and Tem denotes the actual operating temperature of the power battery (K).
The vehicle’s thermal management system regulated the battery temperature to ensure it operated within a safe range. Specifically, the power battery’s upper temperature limit was established at 35°C (i.e., 308.15 K) in this study, with reference to an EV model.
The electricity flowing through the battery’s internal resistance created heat, which was then dissipated and lost as heat energy. So the total electricity consumption of the battery pack is as follows:
where Pbat represents the battery pack’s total power (kW), including the vehicle’s energy loss.
(3) Battery aging model
The semi-empirical battery aging model was used to represent the percentage of capacity loss of the power battery (Li et al., 2015) with the following expression:
where Qloss denotes the percentage of the battery capacity loss (%); B is the pre-exponential coefficient related to the battery SOC and has the value of 31,630; Ea is the activation energy, which is linearly related to the battery charge/discharge multiplier cb; Rq denotes the gas molar constant and has the value of 8.314 J/(mol·K); AHthrough denotes the total ampere-hour throughput (A·h); z is the power coefficient; and γ1 and γ2 are the linear calibration coefficients for the activation energy.
When the battery capacity loss reaches 20% of the standard capacity, it is deemed to have reached its end of life (EOL) in terms of battery life. When the battery is at an ambient temperature of 25°C (298.15 K) and the charge/discharge multiplier is 0.3 C in standard driving cycles (Chen et al., 2015), then the total ampere-hour throughput of the power battery when it reaches its EOL is as follows:
where Γnom is the power battery termination throughput (A·h); Inom is the battery current in standard driving cycles, which has the value of 2.5 A; and Tem_nom denotes the temperature of the power battery as the standard temperature.
The actual total operating ampere-hour throughput of the power battery Γreal is expressed as follows:
The aging factor σ was introduced to analyze the impact of ambient temperature and a charge/discharge multiplier on the decay rate of the battery life, which was the decay speed of the battery life in actual driving cycles compared to that in standard driving cycles (Chen et al., 2015). Eq. 14 shows the following expression:
where Inom is the standard number of battery charging and has the value of 0.35 and Γnom is the open temperature in the standard driving cycle and has the value of 298.15 K.
3.4.3 HESS parameter matching
The HESS consists of lithium batteries and supercapacitors, each having different energy densities, and they can be combined in various configurations to meet the range requirements. The objective of composite power supply parameter matching is to minimize the total cycle energy consumption while maximizing the battery life, which represents a multi-objective optimization problem. To solve this problem, an improved non-dominated sorting genetic algorithm II (NSGA-II) based on the elite control strategy was adopted. The objective expression of the HESS parameter matching optimization is as follows:
where Esystem is the energy consumption of the HESS; Eb is the energy consumption of the battery pack; and Eu is the energy consumption of supercapacitors.
The constraints are expressed as follows:
where nbp_min denotes the minimum number of battery packs in parallel; Pdri_max indicates the maximum drive power; Ib_max signifies the maximum discharge current of a single battery, which for a 18,650 ternary lithium battery is 10 A; Pre_max represents the maximum braking energy feedback power; mbody indicates the body mass (excluding HESS mass); nup denotes the number of supercapacitors in parallel; nus signifies the number of supercapacitors in a series; mu_s represents the mass of single-cell supercapacitors; nbp denotes the number of battery packs in parallel; Mmax indicates the maximum design weight of the whole vehicle; Eu_s stands for the energy of single-cell supercapacitors; Eb_s denotes the energy of the single-cell battery; EMmax signifies the energy consumption for the maximum design weight; SOCu_min stands for the minimum SOC of supercapacitors; SOCu_max denotes the maximum SOC of supercapacitors; SOCb_min indicates the minimum SOC of a battery; SOCb_max signifies the maximum SOC of a battery; and Ib_min represents the minimum discharge current of a single battery.
The improved NSGA-II based on the elite control strategy overcomes the disadvantages of the genetic algorithm, such as local prematurity, weak local convergence, and time-consuming iterative operations. Hence, it is very suitable for solving non-linearly related, multi-objective, and multi-parameter optimization problems (MASOUD and TARE YELMEK, 2014) (Chen et al., 2015).
Figure 6 shows the range of a solution set under constraints. When the HESS supply satisfies the constraint, the shaded parts of nbp and nup take the value of the number of power battery cells in parallel and the number of supercapacitors in parallel, respectively.

FIGURE 6. Range of the solution set under constraints.
Figure 7 shows the HESS parameter matching the optimal frontier and the feasible solution set. Figure 7A shows the improved NSGA-II solution set. The solution set of NSGA-II is represented by the Pareto solution set, and each point in the figure represents an optimal solution. Figure 7B displays the feasible solution set under different configuration parameters (objective function solution set).
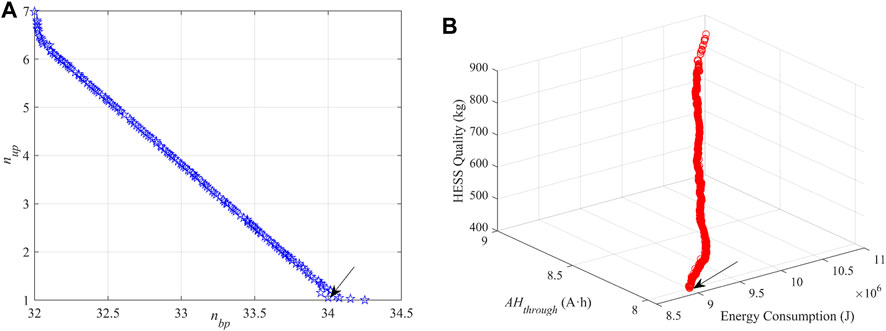
FIGURE 7. HESS parameter matching solution set. (A) Optimal Pareto front of parameter matching; (B) feasible solution set of different parameter matching.
The optimal matching scheme for each parameter in the Pareto solution set cannot be determined without setting the weights, and the “optimal” solution can only be determined by the designer from an empirical point of view. If the optimization direction is a smaller AHthrough value, then nup takes a larger value; if the optimization direction is a smaller Esystem value, then nbp takes a larger value. By choosing the optimal solution, the values of nup = 1 and nbp = 34 were chosen from the position marked by the arrow in Figure 7. The nominal capacity of the supercapacitor was 28 F, and the nominal capacity of the power battery was 102 A·h.
4 Energy management strategy for EVs with hybrid energy supply systems
The core of energy management for operating EVs with long driving ranges within their service lives is to reasonably allocate the output power of supercapacitors and power batteries to improve the battery life, reduce the frequency of battery replacement, and ensure cost efficiency of the vehicle.
4.1 Objective function formulation
The comprehensive cost of the HESS is defined as the sum of its electricity consumption cost and aging cost. The electricity consumption cost is the cost of the output electricity consumption by the supercapacitor and battery. Furthermore, the battery aging cost is the purchasing cost of the battery pack apportioned by the battery capacity loss in the current trip. Their expression is as follows:
where u*(t) is the optimal coupling coefficient at moment t; Cs(u(t),t), Ce(u(t),t), and Cbr(u(t),t) are the comprehensive cost (CNY), the electricity consumption cost (CNY), and the battery aging cost (CNY) at moment t, respectively; and u(t) is the power coupling coefficient at moment t, u(t)∈[0,1].
Each optimization target in Eq. 17 is shown in Eq. 18:
where Ce denotes the electricity consumption cost (CNY); Cbr is the battery aging cost (CNY); Pe is the unit price of electricity, which has the value of 0.51 CNY/(kW·h); Pbr is the purchasing cost of the battery pack, which has the value of 1,000 CNY/(kW·h); Ncell is the number of single cells connected in parallel to the battery pack; and T stands for the total duration of one trip by the vehicle.
4.2 Hierarchical instantaneous optimal energy management strategy
The adopted transient optimal EMS was a two-layer structure, of which the top layer (logical layer) was in the hard-threshold operation mode with the power coupling coefficient u = 0 and the lower layer (optimization-seeking layer) was in the soft-threshold operation mode, calculating the optimal integrated cost and power allocation for the HESS based on the current required power. Based on the HIOC algorithm, the solution was combined with equidistant discrete optimization and the dichotomy optimization level-2 algorithm, which overcomes the difficulty in the HIOC algorithm to determine the optimal coupling coefficient.
The state variables of the algorithm are incremental SOCs of the supercapacitor and power battery, and therefore, the state equation at moment t will be as follows:
The constraint conditions are as follows:
where Pu_min denotes the minimum power of supercapacitors; Pu_max signifies the maximum power of supercapacitors; Pb_min indicates the minimum power of the battery; and Pb_max stands for the maximum power of the battery.
The expressions for Pu(t) and Pbat(t) are as follows:
where the subscript _min denotes the minimum value of the variable and the subscript _max denotes the maximum value of the variable.
Figure 8 shows the flow of the HIOC-EMS. The specific optimization calculation process is as follows:
(1) Obtain the discrete demand power.

FIGURE 8. Energy management strategy based on hierarchical instantaneous optimization.
The whole vehicle demand power Pdri(tj) for each moment tj is determined according to the driving conditions, namely, tj∈[0, T], Δtj = 1s, and j = 0, 1, 2, M, where M denotes the operating time of a driving cycle.
(2) Judge the working mode of the supercapacitor.
If the supercapacitor SOC exceeds its upper and lower boundaries, the logic layer is entered and u(tj) = 0 is outputted. If the supercapacitor SOC is within its upper and lower boundaries, then the optimum searching layer is entered.
(3) Calculate the optimal coupling coefficient u*(tj).
After entering the optimum searching layer, the instantaneous optimal algorithm is used to calculate the integrated cost Cs(ui(tj),tj) (ui(tj) = i/N, i = 0, 1, 2, N) with the traversal coupling coefficient ui at moment tj (ui(tj) = i/N, i = 0, 1, 2, N). The minimum integrated cost is written as Cs(uk(tj),tj). Then, the dichotomous method is used to calculate u*(tj). The parameters a, b, and d are initialized. a and b are assigned to the two coupling coefficients with smaller function values in Cs(uk-1(tj),tj), Cs(uk(tj),tj), and Cs(uk+1(tj),tj), respectively. a and b should satisfy the conditions of b>a, d=(a+b)/2. Then, Cs(d(tj),tj) is calculated and ΔCs(d(tj),tj) = Cs(uk(tj),tj)-Cs(d(tj),tj) is recorded. If |ΔCs(d(tj),tj)|≤10-3, then the convergence condition is met and u*(tj) = d/N is outputted. Otherwise, the value of Cs(d(tj),t) is stored.
5 Performance validation of the HIOC-based energy management strategy
The study utilized the hierarchical transient optimal energy management technique to simulate the model in the Worldwide Harmonized Light Vehicles Test Procedure (WLTP) driving cycle (Chen et al., 2021).
Figure 9 illustrates the simulation results. Figure 9A shows the power allocation relationship between the supercapacitor and power battery of the HIOC algorithm. Under the drive mode, the algorithm reasonably allocates the output power of both; under the feedback mode, increasing the power allocated to the power battery will increase the battery aging cost Cbr. Figure 9B shows that the increase of Cbr is greater than the decrease of Ce. At the marked points 1 and 2 in Figure 9A, the supercapacitor absorbs all the feedback energy, which reduces the electricity consumption cost and does not influence the battery aging cost.
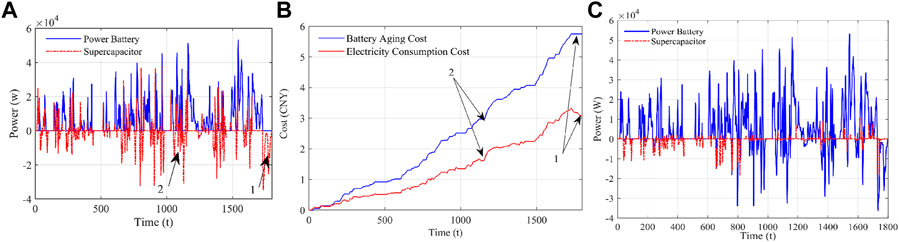
FIGURE 9. Results of the HIOC-EMS in the WLTC driving cycle: (A) power allocation between the supercapacitor and power battery (established conditions); (B) trends in the electricity consumption cost and the battery aging cost; (C) power allocation between the supercapacitor and power battery (lower power battery prices and higher charging costs).
As shown in Eq. 18, the power coupling relationship between the supercapacitor and power battery at any moment is related to the price of electricity and purchasing cost of the battery pack at the current moment, as shown in Figure 9A. In the established conditions in this article, the supercapacitor completely absorbs the feedback power. As shown in Figure 9C, the receding new energy policy dividend lowers the price of electricity and purchasing cost of battery packs, the feedback is mainly absorbed by supercapacitors in the low-power state, and the battery pack and supercapacitors adaptively distribute the feedback power in the high-power state.
To further evaluate the performance of the HIOC-EMS, a comparative analysis of its optimum-searching ability and adaptability is required.
5.1 Comparison algorithms
5.1.1 Particle swarm optimized fuzzy energy management strategy
(1) Fuzzy control strategy
Fuzzy control is applicable in multi-objective, non-linear, and time-varying systems with a high applicability. In this paper, a Mamdani-type fuzzy controller was used, and fuzzy rules were established with if-then statements.
Large logical differences exist between the drive state and the feedback state, and separate strategies need to be established. The input variables of the fuzzy strategy are SOCb, SOCu, and Pdri for the drive state and SOCb, SOCu, and Pre for the feedback state. The theoretical domain of SOCb is [0.2,1] and that of SOCu is [0.4,1], whose fuzzy subsets are {L, M, H}, indicating low, medium, and high, respectively. The theoretical domain of power demand Pdri or feedback power Pre is [0,1], and their fuzzy subsets are {SL, L, M, H, SH}, denoting super low, low, medium, high, and super high, respectively.
The gain coefficient of the output is the percentage coefficient of the supercapacitor in the required power, with a thesis domain of [0,1], and the fuzzy subsets of {SL, L, M, H, SH} denote super low, low, medium, high, and super high, respectively. The primary guideline for creating a basic membership function is to consider the SOC levels of both the supercapacitor and battery, along with the power demand. When the battery has an ample amount of power, the supercapacitor collaborates with the battery to limit the charging and discharging current of the battery. This approach is particularly helpful when there is a high power demand. In contrast, when the power demand is low, the use of DC–DC and supercapacitor charging and discharging is avoided. When the battery SOC is low, to ensure the battery energy feedback, the system prioritizes energy feedback for the battery, as shown in Tables 2, 3. The FZY-EMS denotes the fuzzy control-based energy management strategy.
(2) PSO algorithm-optimized fuzzy strategy
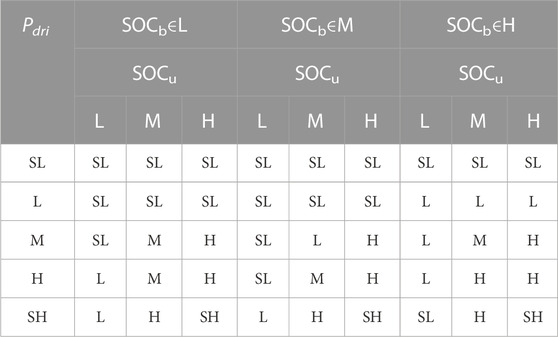
TABLE 2. Deduction rules for the drive state.
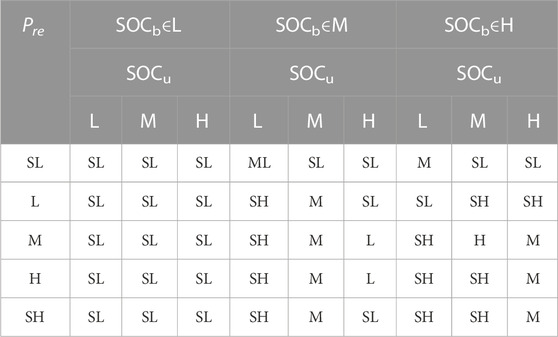
TABLE 3. Deduction rules for the energy feedback state.
The formulation of the membership function in the aforementioned fuzzy control strategy relies on expert experience, which is more subjective, and the rules may not be optimal. Using the particle swarm optimization (PSO) algorithm, the fuzzy control strategy can be optimized to obtain the minimum objective function, and the optimized membership function can be applied to the energy distribution within the HESS. The fuzzy strategy optimized by the PSO is noted as PFZY-EMS.
To obtain the optimal fuzzy control parameters by PSO, all parameters of the membership function and fuzzy rules should be selected optimally as particle dimension numbers. In this study, the fuzzy rules designed based on expert knowledge remained the same, and PSO was used to adjust the fuzzy rules to remove the rule boundary parameters for optimization.
The optimization process is as follows:
1) The variables of the fuzzy control rule, except the boundary function, were used as particles, which were encoded and then initialized with a position and a velocity for each particle.
2) Each particle was decoded and outputted for the corresponding fuzzy control rule. Then, the EV was simulated.
3) The position and velocity of particles were updated using the PSO algorithm.
4) Step (3) was repeated for iteration until the termination condition was fulfilled, and the optimal parameters of fuzzy control rules were outputted.
Section 4.2 describes the simulation results.
5.1.2 Dynamic programming algorithm
Dynamic programming (DP) is a problem-solving approach that simplifies a complex global decision problem into simpler local decision problems. This approach allows us to solve each stage separately and find the best solution for each stage, ultimately leading to the optimal solution for the entire problem.
According to the optimal control theory of DP (Mansour and Clodic, 2012; Xie et al., 2018), for DP with a discrete form and optimization objective function J as the performance index, its iteration format is as follows:
When k = kend,
When k = kend—1, kend—2, kend—3, …, 1
where Jk is the (hth) objective function value at the kth stage.
The global optimal solution was obtained by inverse iterations.
5.2 Analysis of the simulation results
In order to compare the effects of different energy management strategies, four items, namely, the supercapacitor SOC, energy consumption, battery loss, and comprehensive cost, were selected as evaluation indexes. Moreover, three typical driving cycles, i.e., the New European Driving Cycle (NEDC), Urban Dynamometer Driving Schedule (UDDS), and WLTC, were selected, given that the roads operating EV travel include urban roads, fast arterial roads, and city ring expressways. Figures 10–13 show the simulation results.
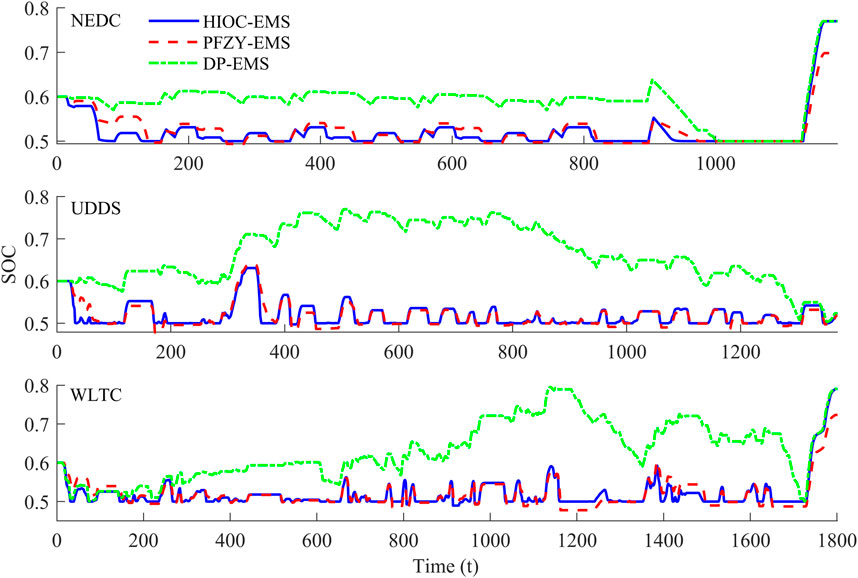
FIGURE 10. SOC variation of supercapacitors in three driving cycles.
From Figure 10, it can be seen that for the supercapacitor SOC, the HIOC-EMS and the PFZY-EMS have close change trends in the three driving cycles, and the HIOC-EMS bears the maximum power output of the HESS, which means the hard-threshold output on the logical layer imposes a stronger constraint on the supercapacitor SOC than the PFZY-EMS and, hence, a stronger self-adaptability. The DP-EMS is the global optimal algorithm, and its supercapacitor output power trend differs from the other two strategies. For the HIOC-EMS, its supercapacitor SOC is higher than the initial SOC at the end of NEDC and WLTC cycles. Hence, it is fully capable of a rotation cycle.
As shown in Figure 11, the HIOC strategy has a slightly higher cycle energy consumption than the other two at the ends of the three driving cycles. This is because in the corresponding operating environment, the reduction in power battery aging cost Cbr brought by the lowered power battery output is greater than the increase in electricity consumption cost Ce, so the algorithm prioritizes using the supercapacitor in operation. Furthermore, affected by the voltage rise efficiency of DC–DC, the supercapacitor increases the cycle energy consumption.
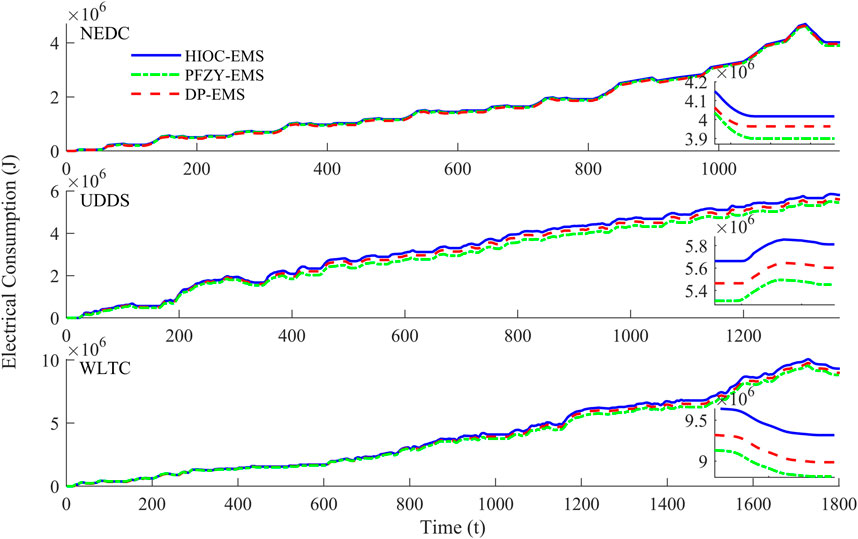
FIGURE 11. Energy consumption in three driving cycles.
In the HIOC-EMS, the supercapacitor shares the power battery output, so the battery loss is reduced. As shown in Figure 12, the percentage of the power battery loss decreases significantly, especially in the first half of the driving cycle. When the supercapacitor power is sufficient, the battery loss of the HIOC-EMS is lower than those of the other two strategies. Furthermore, at the end of the cycles, the power battery loss of the HIOC-EMS is between those of the other two EMSs.
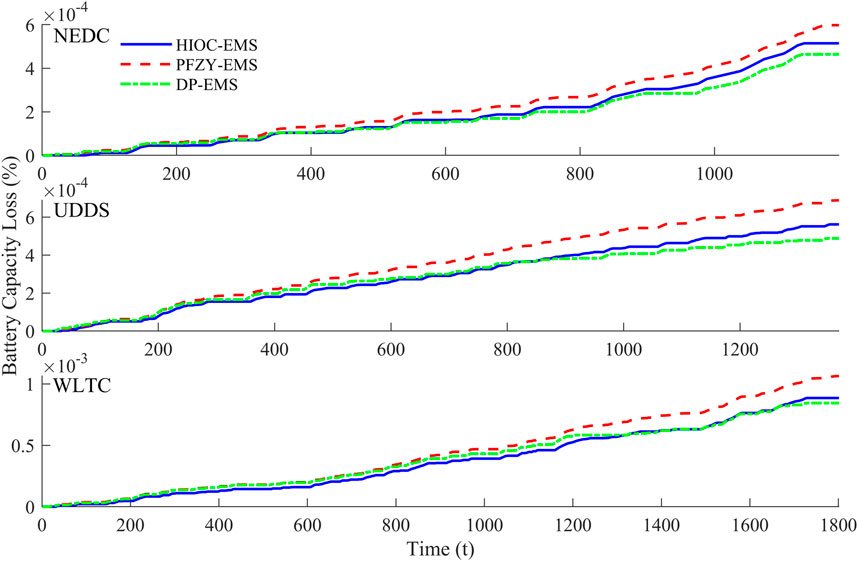
FIGURE 12. Curves of the battery loss percentage in three driving cycles.
Figure 13 compares the comprehensive costs of the three strategies in the three driving cycles. As shown, the comprehensive cost of the HIOC-EMS is in between and significantly better than the PFZY-EMS.
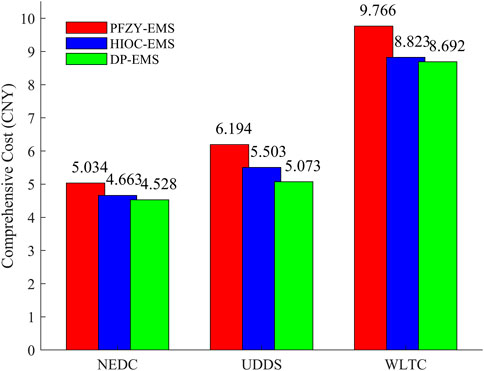
FIGURE 13. Comprehensive cost in three driving cycles.
In summary, the HIOC-EMS significantly cut the comprehensive cost of HESSs and power battery losses at a small cost of energy and lowered the battery life loss, which made it a much better strategy than the PFZY-EMS, although slightly inferior to the DP-EMS.
The performances of three EMSs were quantitatively analyzed, with the cycle energy consumption, battery loss, and comprehensive cost in a complete driving cycle being used as evaluation indicators. Table 4 lists the results. In the three driving cycles of UDDS, NEDC, and WLTC, when compared with the PFZY-EMS, the HIOC-EMS proposed in this paper increased the cycle energy consumption by 3.72%, 3.01%, and 3.70%; reduced the battery loss by 18.41%, 13.94%, and 20.37%; and lowered the comprehensive cost by 11.16%, 7.37%, and 9.61%, respectively. Compared with the DP-EMS, the HIOC-EMS increased the energy consumption by 6.57%, 1.34%, and 5.74%; battery losses by 14.87%, 10.77%, and 4.87%; and comprehensive cost by 8.48%, 2.98%, and 1.55%, respectively. The aforementioned results indicated that the performance of the HIOC-EMS surpassed that of the PFZY-EMS by a significant margin and was slightly less effective than the DP-EMS. The remarkable improvements achieved by the HIOC-EMS validate its efficacy as a highly impactful EMS.

TABLE 4. Comparison of evaluation indicators.
6 Conclusion
This paper studied adaptive energy management for operating EVs with HESSs composed of supercapacitors and batteries. A hierarchical optimum searching EMS was proposed to reduce the comprehensive cost, which accounted for both the electricity consumption cost and the power battery aging cost. The proposed HIOC-EMS was compared with the PFZY-EMS and the DP-EMS. The major conclusions reached are as follows:
1) A comprehensive cost function consisting of the electricity consumption cost of HESSs and the power battery aging cost was formulated, with minimizing the instantaneous comprehensive cost as the optimization objective and the supercapacitor SOC and battery SOC as state variables. The optimal coupling coefficient of the supercapacitor was solved via a HIOC algorithm, which contained a logic layer and an optimization layer. The HIOC was then adopted as a real-time energy management solution for EVs with HESSs.
2) Simulation and verification were performed by adopting MATLAB and Simulink software. The results showed that in the three driving cycles of UDDS, NEDC, and WLTC, the HIOC-EMS significantly reduced the power battery loss and the comprehensive cost of HESSs at the expense of little energy costs, showing remarkable optimization effects.
3) The EMS developed in this paper has not been verified in actual vehicles. The subsequent work will build a testing system to conduct performance tests and to continuously optimize the strategy based on test results.
Data availability statement
The original contributions presented in the study are included in the article/Supplementary Material; further inquiries can be directed to the corresponding author.
Author contributions
Conceptualization, JiZ and JuZ; methodology, JiZ; software, LW; validation, JiZ, JuZ, LW, and YZ; formal analysis, JuZ; investigation, YZ; resources, JiZ; data curation, LW; writing—original draft preparation, JiZ; writing—review and editing, JuZ; visualization, YZ; supervision, YZ; project administration, JiZ; funding acquisition, JuZ. All authors contributed to the article and approved the submitted version.
Funding
This research was funded by the National Key Research and Development Program of China (grant no. 2020YFB1600400) and the Scientific Research Project of the Department of Transport of Shaanxi Province (grant no. 18-27R).
Conflict of interest
The authors declare that the research was conducted in the absence of any commercial or financial relationships that could be construed as a potential conflict of interest.
Publisher’s note
All claims expressed in this article are solely those of the authors and do not necessarily represent those of their affiliated organizations, or those of the publisher, the editors, and the reviewers. Any product that may be evaluated in this article, or claim that may be made by its manufacturer, is not guaranteed or endorsed by the publisher.
References
Chen, L. M., Liao, Z. L., Ma, X. J., et al. (2021). Hierarchical control-based real-time energy management strategy for hybrid electric vehicles. Acta Armamentar Ⅱ (8), 1580–1591. doi:10.3969/j.issn.1000-1093.2021.08.002
Chen, Z. Y., Xiong, R., Wang, K. Y., and Jiao, B. (2015). Optimal energy management strategy of a plug-in hybrid electric vehicle based on a particle swarm optimization algorithm. Energies 8 (08), 3661–3678. doi:10.3390/en8053661
Du, R., Hu, X., Xie, S., Hu, L., Zhang, Z., and Lin, X. (2020). Battery aging and temperature-aware predictive energy management for hybrid electric vehicles. J. Power Source 473, 228568. doi:10.1016/j.jpowsour.2020.228568
Dubal, D. P., Ayyad, O., Ruiz, V., and Gómez-Romero, P. (2014). Hybrid energy storage: The merging of battery and supercapacitor chemistries. Chem. Soc. Rev. 44 (7), 1777–1790. doi:10.1039/c4cs00266k
He, Z. C., Yang, G., and Lu, L. G. (2015). Battery DC internal resistance test method based on the constant current external characteristic and SOC. J Tsinghua Univ(Sci Technol) (5), 9–18.
Hu, J. J., Zheng, Y., Hu, Z. H., et al. (2018). Parameter matching and control strategies of hybrid energy storage system for pure electric vehicle. China J. Highw. Transp. (3), 142–150. (in Chinese). doi:10.19721/j.cnki.1001-7372.2018.03.016
Huan, N., Yao, E. J., Yang, Y., et al. (2019). Stochastic dynamic user equilibrium assignment model considering penetration of electric vehicle. J. Traffic Transp. Eng. (10), 150–160. doi:10.19818/j.cnki.1671-1637.2019.05.015
Ji, C. W., Pan, S., Wang, S., et al. (2020). Experimental study on effect factors of aging rate for power lithium-ion batteries. J. Beijing Univ. Technol. (10), 1272–1282. doi:10.11936/bjutxb2019040020
Li, T., Zou, Y., and Liu, D. (2015). Energy management strategy for HEVs including battery life optimization. Int. J. Veh. Des. 70 (1), 98–112.
Liu, X. D., Ma, J., Zhao, X., Zhang, Y., Zhang, K., and He, Y. (2019). Integrated component optimization and energy management for plug-in hybrid electric buses. Process 7 (8), 477. doi:10.3390/pr7080477
Mansour, C., and Clodic, D. (2012). Optimized energy management control for the Toyota Hybrid System using dynamic programming on a predicted route with short computation time. Int. J. Automot. Technol. 13 (2), 309–324. doi:10.1007/s12239-012-0029-0
Martel, F., Dube, Y., Kelouwani, S., Jaguemont, J., and Agbossou, K. (2016). Long-term assessment of economic plug-in hybrid electric vehicle battery lifetime degradation management through near optimal fuel cell load sharing. J. Power Sources 318 (30), 270–282. doi:10.1016/j.jpowsour.2016.04.029
Masoud, S., and Tare Yelmek, K. (2014). Multi-objective optimal design of hybrid renewable energy systems using PSO-simulation based approach. Renew. Energy 68, 67–79. doi:10.1016/j.renene.2014.01.011
Panday, A., and Bansal, H. O. (2014). A review of optimal energy management strategies for hybrid electric vehicle. Int. J. Veh. Technol. 2014 (2), 1–19. doi:10.1155/2014/160510
Santucci, A., Sorniotti, A., and Lekakou, C. (2014). Power split strategies for hybrid energy storage systems for vehicular applications. J. Power Sources 258, 395–407. doi:10.1016/j.jpowsour.2014.01.118
Sisakat, S. T., and Barakati, S. M. (2016). Energy management using fuzzy controller for hybrid electrical vehicles. J. Intelligent Fuzzy Syst. 30, 1411–1420. doi:10.3233/IFS-152054
Song, C. X., Zhou, F., and Xiao, F. (2017a). Energy management optimization of hybrid energy storage system based on dynamic programming. J. Jilin Univ. Eng. Technol. Ed. (1), 8–14. doi:10.13229/j.cnki.jdxbgxb201701002
Song, C. X., Zhou, F., Xiao, F., et al. (2017b). Parameter matching of on-board hybrid energy storage system based on convex optimization method. J. Mech. Eng. 53 (08), 44–51. doi:10.3901/jme.2017.16.044
Wang, B. W. (2018). Study on parameter matching and control strategy of the power system of new energy vehicle. Hunan Univ.
Wu, C., Zhu, C., Sun, J., and Ge, Y. (2017). A synthesized diagnosis approach for lithium-ion battery in hybrid electric vehicle. IEEE Trans. Veh. Technol. 66 (7), 5595–5603. doi:10.1109/tvt.2016.2634125
Xie, S. B., Liu, T., Li, H. L., et al. (2018). A study on predictive energy management strategy for a plug-in hybrid electric bus based on Markov chain. Automot. Eng. (8), 871–877. doi:10.19562/j.chinasae.qcgc.2018.08.001
Xie, S., Hu, X., Qi, S., Kun, L., Zongke, X., James, B., et al. (2019a). Model predictive energy management for plug-in hybrid electric vehicles considering optimal battery depth of discharge. Energy 173, 667–678. doi:10.1016/j.energy.2019.02.074
Xie, S., Hu, X., Xin, Z., and Brighton, J. (2019b). Pontryagin’s minimum principle based model predictive control of energy management for a plug-in hybrid electric bus. Appl. Energy 236, 893–905. doi:10.1016/j.apenergy.2018.12.032
Xu, D., Zhou, H., Wang, B., et al. (2017). A simplified cascading hybrid power and its control scheme for electric vehicles. Automot. Eng. (12), 1368–1374. doi:10.13229/j.cnki.jdxbgxb201705002
Yao, T. Z., Xie, C. J., Zeng, T., et al. (2019). Multi-Fuzzy control based energy management strategy of battery/supercapacitor hybrid energy system of electric vehicles. Automot. Eng. (6), 615–640. doi:10.19562/j.chinasae.qcgc.2019.06.002
Zhang, L., Hu, X. S., Wang, Z. B., et al. (2017). Multi-objective optimal sizing of hybrid energy storage system for electric vehicles. IEEE Trans. Veh. Technol., 1. doi:10.19562/j.chinasae.qcgc.2017.12.003
Zhang, P., Yan, F. W., and Du, C. Q. (2015). A comprehensive analysis of energy management strategies for hybrid electric vehicles based on bibliometrics. Renew. Sustain. energy Rev. 48 (48), 88–104. doi:10.1016/j.rser.2015.03.093
Zhao, B., Song, Q., and Liu, W. (2012). Power characterization of isolated bidirectional dual-active-bridge DC–DC converter with dual-phase-shift control. Power Electron. IEEE Transaction27 (9), 4172–4176. doi:10.1109/tpel.2012.2189586
Zhou, F., Song, C. X., Liang, T. W., et al. (2017). Parameter matching of on-board hybrid energy storage system using NSGA-Ⅱ algorithm. J. Jilin Univ. Eng. Technol. Ed. (9), 1336–1343. doi:10.1109/TVT.2017.2762368
Keywords: automotive engineering, electric vehicles with the hybrid energy storage system, energy management strategy, hierarchical instantaneous optimal algorithm, comprehensive cost
Citation: Zhao J, Zhou J, Wang L and Zhao Y (2023) An energy management strategy to reduce the comprehensive cost of hybrid energy storage systems in electric vehicles. Front. Energy Res. 11:1191565. doi: 10.3389/fenrg.2023.1191565
Received: 22 March 2023; Accepted: 16 June 2023;
Published: 04 July 2023.
Edited by:
Lorenzo Ferrari, University of Pisa, ItalyReviewed by:
Gianluca Pasini, University of Pisa, ItalyHangxin Li, Hong Kong Polytechnic University, Hong Kong SAR, China
Copyright © 2023 Zhao, Zhou, Wang and Zhao. This is an open-access article distributed under the terms of the Creative Commons Attribution License (CC BY). The use, distribution or reproduction in other forums is permitted, provided the original author(s) and the copyright owner(s) are credited and that the original publication in this journal is cited, in accordance with accepted academic practice. No use, distribution or reproduction is permitted which does not comply with these terms.
*Correspondence: Juanying Zhou, MjAxNzAyMjAxNkBjaGQuZXVkLmNu