 Xinyi Tian
 Li Cheng
 Weixuan Jiao
 Can Luo
94% of researchers rate our articles as excellent or good
Learn more about the work of our research integrity team to safeguard the quality of each article we publish.
Find out more
ORIGINAL RESEARCH article
Front. Energy Res., 13 April 2023
Sec. Process and Energy Systems Engineering
Volume 11 - 2023 | https://doi.org/10.3389/fenrg.2023.1183086
This article is part of the Research TopicOptimal Design and Efficiency Improvement of Fluid Machinery and SystemsView all 18 articles
To study the internal flow characteristics and energy characteristics of a large bulb perfusion pump. Based on the CFX software of the ANSYS platform, the steady calculation of the three-dimensional model of the pump device is carried out. The numerical simulation results obtained by SST k-ω and RNG k-ε turbulence models are compared with the experimental results. Finally, SST k-ω is selected for subsequent calculation. With the help of the flow line diagram and turbulent kinetic energy table of the whole flow channel of the pump device, the flow components of the pump device under different working conditions are analyzed, and the pressure and velocity distribution at the impeller and guide vane are analyzed by pressure cloud diagram and velocity cloud diagram. It is found that there are three high-pressure areas in the impeller and guide vane section, and the high-pressure regions are mainly distributed in the middle of the impeller channel. As the head decreases, the pressure at the impeller and guide vane positions decreases gradually, and the flow rate increases. Based on the entropy production principle, the wall entropy production and the distribution of mainstream entropy production at the impeller and guide vane parts are analyzed.
In the middle and lower reaches of the Yangtze River along the Yangtze River in China, due to the low-lying and flat terrain, there are many low-head axial flow pumping stations in these places. These pumping stations have the characteristics of large flow, low head, and a high degree of automation. The common types of low-head axial flow pumping stations along the Yangtze River are vertical, oblique, tubular, and bidirectional (channel). The bulb tubular pumping station has been widely used in the Yangtze River Delta (Liu, 2009) and the Pearl River Delta due to its simple structure, shallow excavation depth, slight hydraulic loss, and excellent performance. Therefore, the study of internal flow characteristics and entropy generation analysis of low-head bulb tubular pumps play an essential role in the practical design of the flow components in the bulb tubular pump, the economy, and the safety of the pumping station operation.
At present, most of the domestic and foreign scholars’ research on tubular pump station focuses on the analysis of pump station’s internal and external characteristics and model optimization. Yang et al. (Yang et al., 2020) studied the effect of adjustable inlet guide vane Angle on hydraulic performance of axial-flow pump and impeller by numerical simulation technique, and concluded that the pump efficiency first increased and then decreased with decreasing installation Angle. Zhang et al. (Zhang et al., 2017) artificially analyzed the wear characteristics of the axial-flow pump with sewage as the medium, and the research results showed the relationship between the solid volume fraction and the sweep Angle of the pressure/suction surface and the particle diameter. In order to reveal the influence of tip clearance on the flow characteristics and pressurization performance of spiral axial flow pump, Kan et al. (Kan et al., 2021) analyzed the flow characteristics and energy characteristics of spiral axial flow pump and found that tip clearance increased the possibility of cavitation and had a great influence on the pressurization performance of spiral axial flow pump. The damage of axial flow pump impeller in sandy water was predicted and analyzed by Hua (Hua et al., 2018). Guo et al. (Guo et al., 2022) conducted a quantitative study on the flow field structure at the inlet of axial flow pump and found that there are obvious impeller rotation effect and end wall effect in the inlet flow field of axial flow pump. Zhang et al. (Zhang et al., 2022) tested the hydrodynamic characteristics of the bidirectional axial flow pump on the high-precision hydraulic mechanical test bench, and revealed the energy characteristics and pressure pulsation propagation law of the bidirectional axial flow pump during positive and negative operation. Ji et al. (Ji et al., 2021) studied the difference between the lowest saddle head of the axial flow pump and the axial flow pump device and applied it correctly. They conducted energy performance tests on the hydraulic model TJ04-ZL-06 and the corresponding pump device, and obtained that the first saddle head of the axial flow pump or the saddle head of the corresponding pump device can be used as the control value of the highest lift of the pump station. Wei et al. (Shi et al., 2020b) studied the pressure pulsation law of impeller guide vane under different working conditions of a rear bulb tubular pump calculated and analyzed the pressure pulsation in impeller guide vane area under partial working conditions, and believed that the number of impeller blades had a certain influence on the primary and secondary frequency of pressure pulsation. Wang et al. (Wang and Dai, 2010) used RNG k-ε turbulence model and slip grid technology to study the unsteady flow inside the transect pump and analyzed it in the frequency domain. The results show that the disturbance between impeller and tongue is the main source of pressure pulsation. Wang et al. (Wang et al., 2008) artificially accurately captured the unsteady flow field characteristics of axial flow pump, and used Reynolds time-mean method and large eddy simulation method to numerically simulate the unsteady turbulence of axial flow pump. Zheng et al. (Zheng et al., 2017) and Ran et al. (Ran et al., 2012) respectively studied the pressure pulsation characteristics of axial flow pump and turbine under different working conditions. Ma (Ma, 2021) carried out acceptance tests on the model device of bulb flow pump in Sihong Station, trial operation of real machine and other tests at different stages. Qin et al. (Qin et al., 2009) introduced the structural characteristics and hydraulic characteristics of bulb flow pump units with different structure types.
Mu et al. (Mu et al., 2020) proposed a new groove flow control technique for axial-flow pumps, which can be used to improve the rotating stall problem that is prone to occur when the tubular pump has a small flow rate. Shi et al. (Shi et al., 2020a) designed an axial-flow pump impeller based on the surface element method, and studied the influence of the impeller rotor on the hydraulic performance of the all-tube pump, and found that the reduction of the maximum running head of the all-tube pump was greater than that of the axial flow pump. Pan et al. (Pan et al., 2021) proposed a method to optimize the hydrodynamic characteristics of axial piston pumps and the structural parameters of the distribution zone considering the evolution of cavitation bubbles. Liang et al. (Liang et al., 2018) used CFD numerical simulation technology to optimize the design of the impeller and guide vane body of the tubular pump in order to deeply study the performance of the tubular pump device with rear bulb. In the process of analysis, the operation range of the traditional tubular pump was broken through, and the hydraulic model of the tubular pump with low specific speed and high efficiency was obtained.
At present, entropy generation theory is also the focus of domestic and foreign scholars. Zhang et al. (Zhang et al., 2008) in order to study shaft tubular pump flow dynamic damage characteristics of the shaft tubular pump internal flow field in the unsteady calculation, and using the theory of entropy production of shaft tubular pump under different traffic conditions flow loss characteristics of components, the results show that the impeller is the main source of energy loss turbulent dissipation, the entropy production rate of up to 92%. Song et al. (Wu et al., 2011) analyzed the flow loss characteristics of the duct propeller from the perspective of energy and revealed the characteristics of the flow loss during the operation of the duct propeller. Yang et al. (Yang et al., 2018a) entropy Generation Rates in two-dimensional Rayleigh-Taylor (RT) mixing are investigated by Numerical Calculation. Hddad et al. (Haddad et al., 2004) focused on the generation of forced convective entropy of laminar flow in the entryway of concentric rings. Finally, it is found that thermal entropy generation is relatively dominant over viscous entropy generation. Osman et al. (Koranteng Osman et al., 2019) investigated the energy losses of LNG two-stage cryogenic submersible pumps and two-stage axially split centrifugal pumps based on entropy production theory, respectively, and showed that turbulent dissipation and wall friction were the primary sources for generating hydraulic losses. David et al. (David et al., 2012) evaluated the feasibility of optimization methods for electric heat pumps with the help of entropy production dissipation theory. An et al. (Yu et al., 2022) conducted a numerical study of the energy characteristics of pumped storage pumping stations based on entropy production dissipation theory.
In summary, there are relatively affluent domestic and foreign studies on the internal and external characteristics and model optimization of the bulb perforation pump device, but few studies on the entropy generation analysis of the bulb perforation pump device. This paper uses a large low-head bulb perforation pump device as the research object based on computational fluid dynamics methods and model tests. The internal flow characteristic curve and the entropy generation characteristic of the main parts of the bulb penetration pump without a distinct head are analyzed to help study the fluid characteristics of the bulb irrigation pump.
The calculation model is a low-head bulb tubular pumping station. The designed flow rate of a single pump station is 37.5 m3/s, the diameter of the pump impeller is 3,350 mm, and the rotational speed is n = 115.4 r/min. There are three impeller blades and five guide blades. The designed head of the low-head bulb perfusion pump is 2.45 m, the highest head is 2.75 m, the average head is 2.10 m, and the lowest head is 1.25 m. Taking a single unit of a pumping station as the calculation model for numerical simulation to better simulate the inflow and outflow forms of inlet and outlet channels, according to the design water level, the inlet extension section and the outlet extension section are set before and after the inlet channel. In order to ensure that the size and shape of the calculation channel model are completely geometrically similar to those of the prototype pump station channel model, the overall calculation domain includes the inlet extension section, inlet conduit and diversion pier, impeller, guide vane, bulb body, outlet conduit, and outlet extension section. Figure 1 is the flow channel structure diagram of the bulb tubular pump.
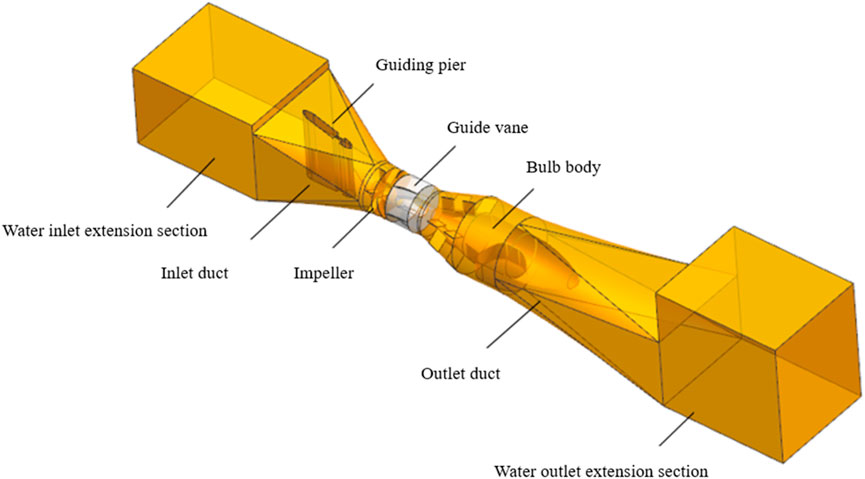
FIGURE 1. Flow channel structure of bulb tubular pump device.
In this paper, based on the continuity equation of three-dimensional incompressible turbulence and the Reynolds time-averaged N-S equation, the internal flow characteristics and hydraulic performance of the bulb tubular pump device are numerically calculated, ignoring the heat exchange effect and ignoring the energy conservation equation. For the selection of turbulence model, SST k-ω and RNG k-ε turbulence models are usually used to simulate the water flow inside the low-lift bulb tubular pump in the present study (Zhang et al., 2012; Ahn et al., 2018; Yang et al., 2018b; Xie et al., 2018; Ma et al., 2019). In order to compare the simulation authenticity of turbulence model, this paper selects these two turbulence models based on CFX platform, carries out numerical calculation respectively, and compares the calculation results with the model test values (Figure 2). The model test is carried out on the experimental equipment of Hitachi Industrial Equipment Technology Tupu Research Institute. The impeller diameter used in the model test is 315 mm, the rotational speed is 1223 r/min, the number of impeller blades is 3, the number of guide vane blades is 5, and the blade placement angle is 0°.
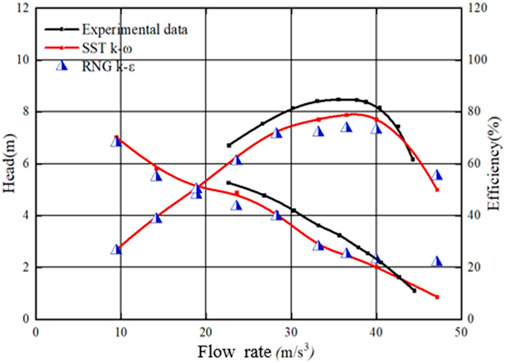
FIGURE 2. Comparison of numerical and experimental results from different turbulence models.
The pump performance data measured by the test bench are converted according to “SL140-2006”pump model and device model acceptance test procedure prototype pump performance conversion method. Numerical simulation results of prototype pump the conversion formula of model pump characteristics:
In the above calculations:
Qp、Qm—Flow rate of original and model pumps.
Hp、Hm—Original and model pump head.
Np、nm—Rotational speed of original and model pumps.
Dp、Dm—Impeller diameter of original and model pumps.
It can be seen from the curves that the numerical simulation results obtained by the two turbulence models are similar to the overall trend of the experimental data, but there is a deviation between some data points near the design condition and the experimental data points using the RNG k-ε model data. Relatively speaking, the consistency between the results obtained by SST k-ω model and the data is better than that of the RNG k-ε model. Therefore, the SST k-ω turbulence model is comprehensively considered for subsequent steady calculation.
In order to consider the later calculation efficiency and accuracy, the ICEM CFD software under the ANSYS platform is used to generate a hexahedral mesh for the impeller part of the calculation model. By controlling the nodes on each topological line, the degree of mesh refinement of the impeller part is ensured. The other parts use the Mesh software of ANSYS platform to generate tetrahedral mesh. For meshing, the smaller the grid size and the higher the number of grids, the higher the computational accuracy. The number of grids will also directly affect the computational time. It is necessary to analyze the irrelevance of the computational grid to save computational resources as much as possible to satisfy sure computational accuracy. In this paper, the grid independence test of the impeller part of the large bulb tubular pump is carried out under the design condition of stable operation (Figure 3A). On the premise of not reducing the quality, the number of grids is changed, and the number of grids at the impeller is gradually increased to verify the rationality of grid subdivision. After analysis, it is found that when the number of grids in the computational domain reaches about 2 million, the control range of hydraulic loss change is within ±5%, which meets the requirements of grid independence test. Therefore, the total number of grid cells in the fluid region is set to 4.5 million. In order to verify the quality of the grid, the y + analysis of the grid of the impeller blade position is carried out in this paper. Because the turbulence model SST k-ω selected in this paper is a high Reynolds number model, it is considered that the y + value is between 30 and 300 in the case of this model. The grid quality is better. It can be seen from Figure 3B that the y + value of the blade does not exceed 100, so the grid quality is considered to be better.
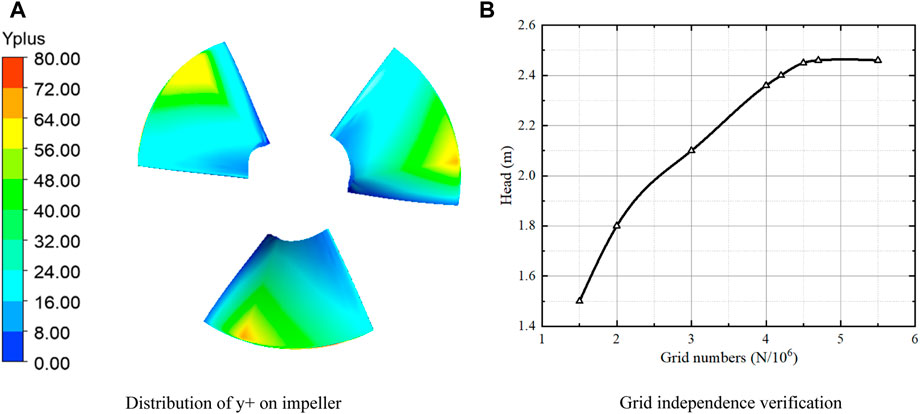
FIGURE 3. Model grid analysis. (A) Distribution of y + on impeller. (B) Grid independence verification.
The inlet boundary adopts the quality inlet condition, which is set as 37,500 kg/s, and is imported on the section of the extended section at a certain distance from the inlet port. The outlet boundary adopts the pressure outlet condition, taking 1 atm, set in the distance of the outlet channel. There is no slip condition and no heat transfer at the solid side wall, and the wall function is used in the near wall region. The blade surface is set as a moving wall. For the pump station, it includes rotating impeller, stationary guide vane and inlet and outlet channels, wherein the inlet channel and impeller, impeller and guide vane have mutual flow coupling effect, and the dynamic and static interface treatment is set as frozen rotor other interfaces are static interfaces, which are set as general interfaces. The calculation scheme is set as first-order upwind, and the convergence accuracy is 10–4.
In order to comprehensively study the flow pattern of the whole flow channel of the pump device, four schemes are selected according to the characteristic head. The characteristic head is 2.45 m in design, 2.75 m in maximum, 2.10 m in average, and 1.25 m in minimum. The corresponding flow rates are 37.5 m3/s, 36.2 m3/s, 40.0 m3/s, and 47.13 m3/s, respectively.
The flow line diagram of the entire flow path of the pump device axis surface is shown in Figure 4. It can be seen that the flow line of the inlet channel position is smooth in the impeller position due to the rotation of the blade to produce ring volume, so the flow speed in this position is accelerated, after the guide vane rectification flow line to restore smooth, but due to the bulb body tail end of the over-flow cross-section changes dramatically in making the region appeared obvious destructive flow pattern. By comparing different working conditions, we can see that the flow line diagram at the end of the bulb body can be seen, the maximum head, design head, and average head working conditions all appear to have evident vortex distribution in this location, the minimum head working conditions in this area of the vortex distribution is less, but in the bulb body at the end of the apparent off-flow phenomenon.

FIGURE 4. Full flow channel flow chart and velocity distribution contour chart. (A) Maximum head. (B) Design head. (C) Average head. (D) Minimum head.
Water disturbance will cause flow disorder and increase the turbulent kinetic energy. Turbulent kinetic energy is the kinetic energy of unit mass fluid due to turbulent fluctuation. The greater the turbulent kinetic energy is, the higher the turbulent degree of the flow field is, and the instability of the flow increases. As shown in Table 1, the turbulent kinetic energy of each characteristic head is compared. It can be seen that with the rise of the head, the flow rate decreases, resulting in the decrease of the turbulent kinetic energy. However, the change of the turbulent kinetic energy is small in the range from the average head to the design head. At this time, the flow state of the whole pump device is relatively stable in the high-efficiency area. When the head increases to the maximum head, the turbulent kinetic energy decreases rapidly, and the decline rate in this section reaches 45% of the total decline. This is because, with the increase of the head, the flow rate decreases correspondingly, the disturbance between the water particles falls, and the guide vane has a better rectification effect for the water body under the condition of a small flow rate under the condition of constant rotational speed.
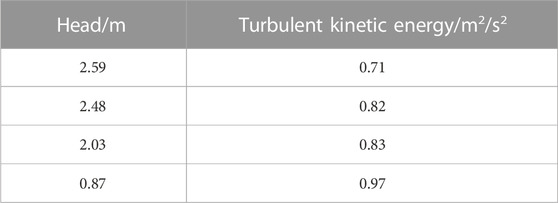
TABLE 1. The change of turbulent kinetic energy under different characteristic head conditions.
The impeller rotation work provides energy for water flow, and its structural parameters and motion state play a decisive role in the overall pump device. In order to further analyze the flow pattern in the impeller area, the impeller inlet section 1–1 and the impeller pressure surface are analyzed. The impeller inlet section 1-1 is 0.284D away from the impeller center line. The section diagram is shown in Figure 5.
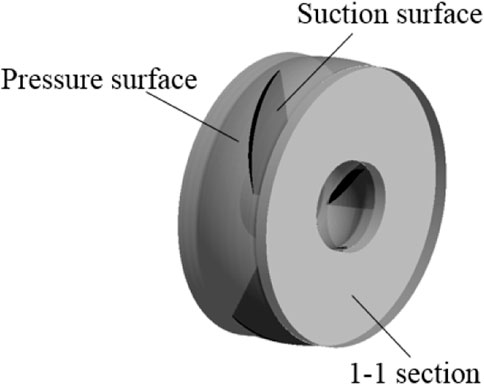
FIGURE 5. Characteristic section diagram of impeller.
The pressure contours of impeller cross-sections 1–1 are shown in Figure 6A. The distribution of cross-section pressure under different head conditions is the same. There are three high-pressure zones and three low-pressure zones, the high-pressure zone and the low-pressure zone interval distribution, and the number of blades is consistent. The high-pressure area is mainly concentrated in the impeller head, and the low-pressure zone is focused primarily in the impeller tail. The center of the high-pressure site is close to the rim, and the pressure decreases from the periphery to the hub. The center of the low-pressure zone is also located at the boundary, gradually increasing to the hub. It can be seen that with the decrease of the head, the pressure gradient at the cross section gradually decreases, and the range of the high-pressure area expands. At the minimum head, the high-pressure area is close to the hub part.
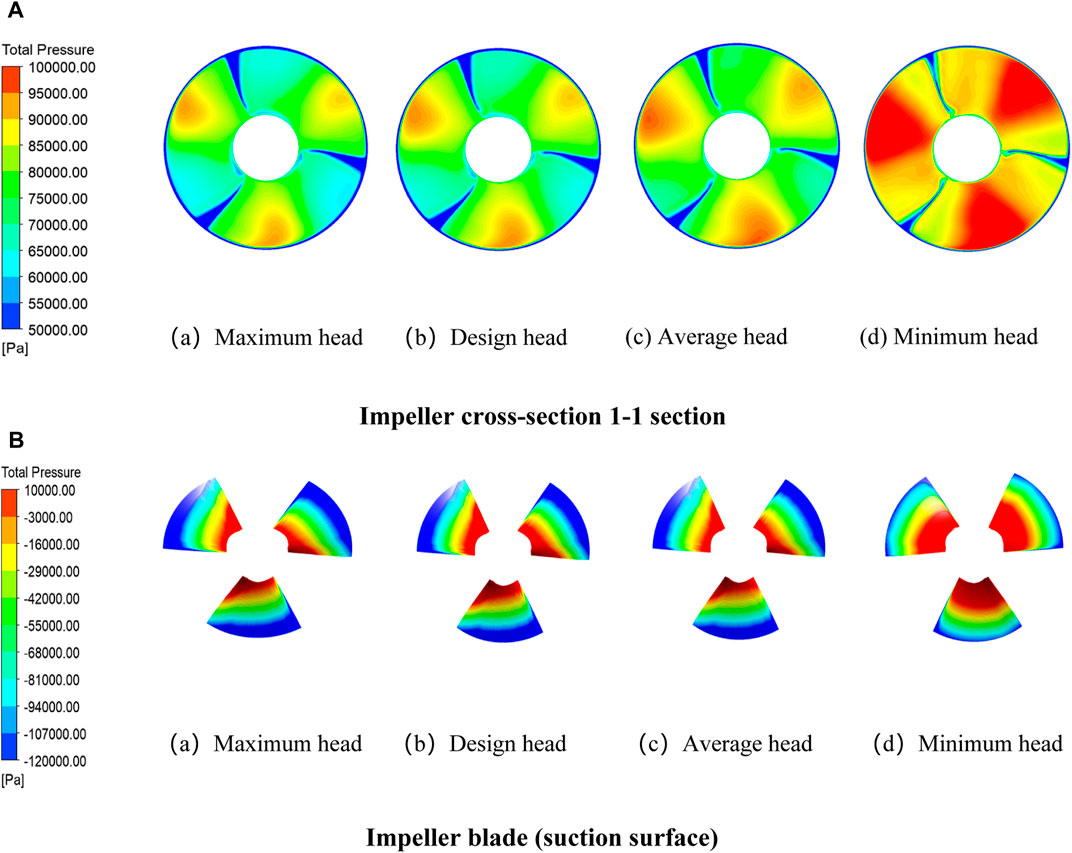
FIGURE 6. Impeller domain pressure contour. (A) Impeller cross-section 1-1 section (a) Maximum head. (b) Design head. (c) Average head. (d) Minimum head. (B) Impeller blade (suction surface). (a) Maximum head. (b) Design head. (c) Average head. (d) Minimum head.
The pressure contours of the impeller pressure surface are shown in Figure 6B. When the impeller runs in a rotating state, the flow pattern at the impeller is complex, so the pressure on the blade surface is also problematic. The high-pressure zone of the blade is mainly distributed in the root of the blade, which is due to the existence of lousy flow patterns such as off-flow and secondary reflux at the basis of the blade. The high-pressure zone gradually decreases to the outer edge of the impeller, and the low-pressure area is located at the outer edge of the blade, and the range is enormous. When the head decreases from the average head to the design head, the area of the high-pressure zone of the blade increases significantly, which is because the increase of the water flow velocity at the impeller will increase the impact pressure on the blade, increasing the area of the high-pressure zone.
The guide vane is located at the outlet of the impeller domain, which mainly acts as a rectifier. Through the guide vane, the flow direction is changed, and the energy loss caused by the circumferential flow of water is reduced, so that it flows into and out of the water pipeline in a relatively stable flow state. In order to further understand the influence of guide vane on water flow, the characteristic section is taken for analysis. The characteristic section 1–1 is the interface between the inlet of the guide vane and the outlet of the impeller, 0.322D away from the center line of the impeller. In order to find out the law of internal pressure and flow velocity in the guide vane domain, a 2-2 section is set inside the guide vane domain. Section 2–2 is located in the middle of the guide vane, 0.597D away from the center line of the impeller. Section 3–3 is located at the outlet of the guide vane. The schematic diagram of section 1.018D away from the center of the impeller is shown in Figure 7.
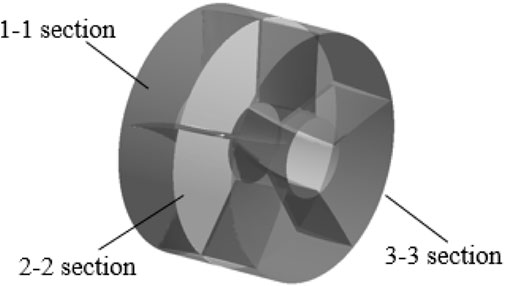
FIGURE 7. Characteristic section diagram of guide vane.
The pressure contours of the 1–1 section of the guide vane body is shown in Figure 8A The 1–1 section is located at the junction of the guide vane and the impeller domain. The pressure contour of this section mainly shows the distribution of large water pressure before entering the guide vane body. Due to the rotation of the impeller in the front of the section, there are three main high-pressure areas in the 1–1 section. However, due to the rectification effect of the guide vane body on the water body, there are also small-scale high-pressure areas in the position of the guide vane of the section. The high-pressure area is mainly distributed in the edge of the wheel to gradually reduce the pressure in the direction of the hub, and the low-pressure area is mainly concentrated in the hub. With the decrease of head, the flow rate increases gradually, the range of high-pressure area in the section cloud image decreases, the pressure gradient increases, and the section pressure is gradually uniform.
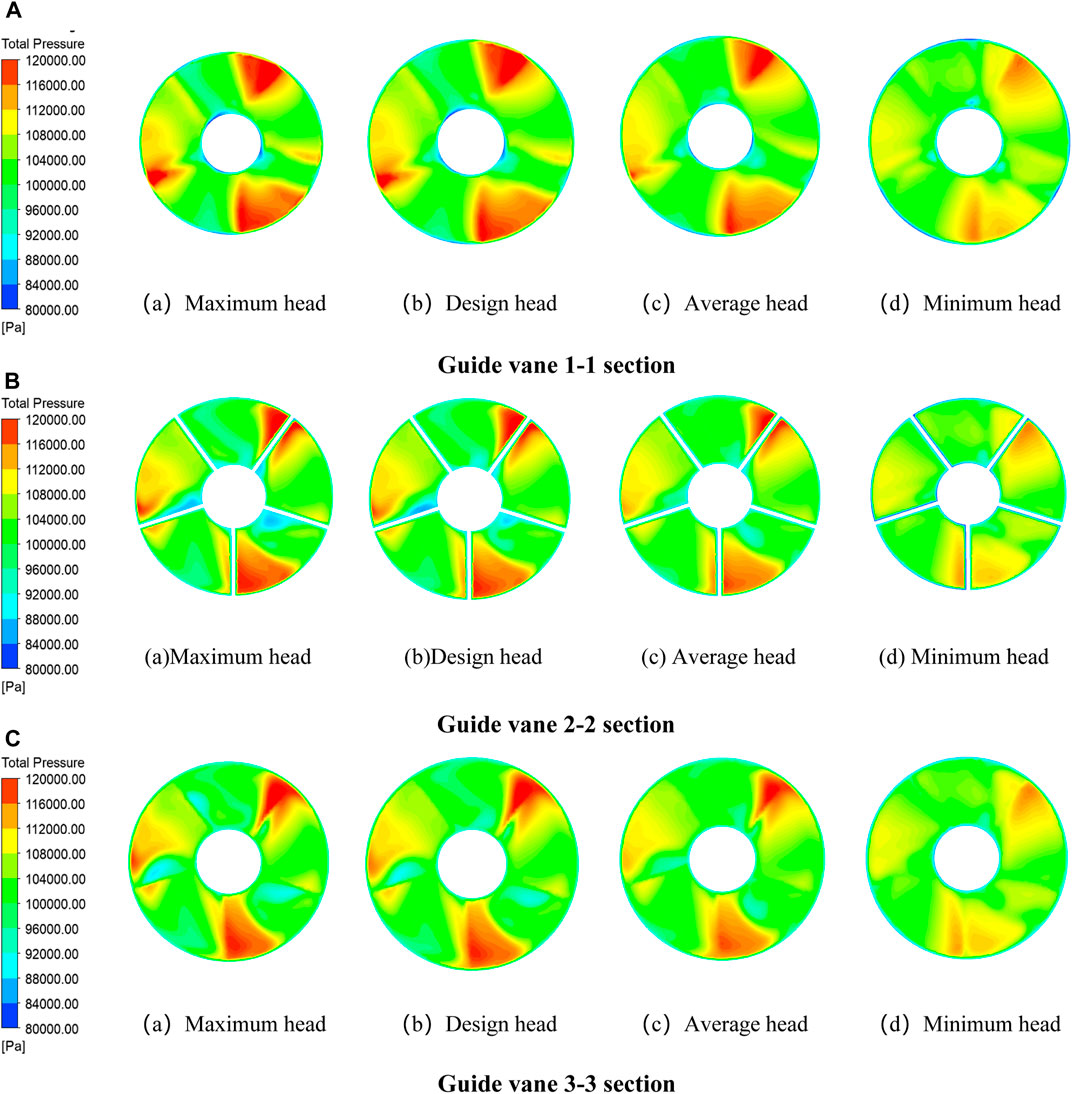
FIGURE 8. Guide vane domain pressure contour. (A) Guide vane 1-1 section. (a) Maximum head. (b) Design head. (c) Average head. (d) Minimum head. (B) Guide vane 2-2 section. (a) Maximum head. (b) Design head. (c) Average head. (d) Minimum head. (C) Guide vane 3-3 section. (a) Maximum head. (b) Design head. (c) Average head. (d) Minimum head.
The pressure contours of the 2–2 section of the guide vane body is shown in Figure 8B. Section 2–2 is located in the middle of the guide vane body, which mainly shows the internal pressure change of the guide vane body. The guide vane body of the section is divided into five parts, but the high-pressure area is still concentrated in the projection position of the impeller blade, but it is smaller than the range of section 1–1. There is a low-pressure zone under each head condition, and the low-pressure zone is mainly distributed in the pressure surface of the guide vane. With the decrease of the head, the range of the high-pressure zone and the low-pressure zone of the section decreases, and the pressure change trend is consistent with that of section 1–1, and gradually tends to be uniform.
The pressure contours of the 3–3 section of the guide vane is shown in Figure 8C After the rectification of the guide vane, the water flow ahead of the spiral is blocked by the guide vane blade, and the direction of movement is changed, so that the flow pattern of the guide vane outlet is more stable, and the range of the high-pressure area and the low-pressure area of the section are reduced compared with those of the 1–1. The pressure variation trend of each head working condition is basically consistent with that of 1–1 section and 2–2.
The velocity contours of the 1–1 section of the guide vane is shown in Figure 9A. When the maximum head reaches the average head, there are three high velocity regions in the section and the position corresponds to the position of the blade. This is because the rotation of the blade makes the flow have a large velocity at this position. However, at the minimum flow rate, due to the mismatch between the blade speed and the flow rate, the flow is limited affected by the rotation of the blade. Therefore, the flow velocity at the cross section is relatively chaotic and there is no obvious division of high flow velocity area, and the overall flow velocity at the cross section is large.

FIGURE 9. Guide vane domain velocity contour. (A) Guide vane 1-1 section. (a) Maximum head. (b) Design head. (c) Average head. (d) Minimum head. (B) Guide vane 2-2 section. (a) Maximum head. (b) Design head. (c) Average head. (d) Minimum head. (C) Guide vane 3-3 section. (a) Maximum head. (b) Design head. (c) Average head. (d) Minimum head.
The velocity contours of the 2-2 section of the guide vane are shown in Figure 9B. Due to the speed loop generated by the impeller rotation, three high velocity zones are generated at the corresponding position of the guide vane, and they are mainly distributed at the rim position and decrease to the hub. However, the range of high flow velocity area is large and the distribution is still relatively chaotic under the minimum head condition due to the mismatch between blade speed and flow. The velocity contour of the 3-3 section of the guide vane body is shown in Figure 9C. By comparing with the velocity contour of the 2-2 section, it can be seen that after the rectification of the guide vane body, the area of the high velocity area and the low velocity area of each working condition section is reduced, and the velocity of the section water body is more uniform after the rectification of the guide vane body.
Due to the simple model experiment is difficult to measure the energy loss in the pump device, so calculating the pressure difference between the inlet and outlet of the flow components is often used to analyze the energy loss of the pump device. However, this method can only calculate the energy loss of the whole flow channel of the pump device, and it is difficult to analyze the energy change of each component and even each characteristic section in detail. Therefore, the entropy production theory is introduced in the hydraulic analysis. Entropy production is due to the dissipation effect caused by irreversible factors in the process so that the mechanical energy lost by the system is converted into internal energy. In the pump system, since the flow we studied is constant temperature and there is no form of heat transfer in the process of movement, the increase of water entropy is mainly caused by the negative flow patterns such as flow separation and vortex, and the influence of solid wall viscous force on the pump device during operation. In turbulent flow, the fluid velocity includes two parts: average velocity and fluctuating velocity, and the corresponding entropy production rate also consists of two parts: one is the entropy production rate produced by the average flow movement. Second, the entropy production rate caused by turbulent kinetic energy dissipation caused by turbulent fluctuating velocity. The analysis of energy loss in the flow channel of the pump device utilizing entropy generation theory can intuitively show the size and distribution of energy dissipation in the pump device. Therefore, when optimizing the structure of the pump device, we can focus on the intensive area of entropy generation and excess in the pump.
For turbulent flow, the entropy production dissipation based on the Reynolds time average can be divided into two parts: the viscous entropy production dissipation caused by fluid viscosity
The total entropy production dissipation of the whole device can be obtained from Equation 6
The entropy production dissipation due to the time-averaged velocity can be calculated as follows.
Where
The entropy production dissipation of turbulent dissipation due to velocity fluctuations can be calculated by the following Equation 8.
Where β = 0.09. Ω is the turbulent eddy frequency (s−1) and k is the turbulence energy (m2/s2).
The local entropy production dissipation integral of the computational domain is shown in Equations 9, 10.
The wall entropy production dissipation can be calculated using the equation.
Where,
The entropy production of low head bulb perfusion pump under different characteristic head conditions is analyzed. Figure 10 is the total entropy production under other working conditions, and Figure 11 is the percentage of entropy production per flow component. The total entropy production of the impeller is the highest in the flow components, reaching more than 100,000 W/K, and has an increasing trend with the decrease of the head. The ratio of the entropy production of the impeller to the total entropy production increases significantly under the condition of a small head. The entropy production generated by the outflow channel ranked second and gradually decreased with the decrease of the head. Under the condition of a large head, the flow was small, and the flow was greatly affected by the velocity circulation, which was spiral forward. The flow pattern was disordered at the guide vane outlet, resulting in the entropy production reaching more than 40,000 W/K. When the head comes to the minimum head, the flow pattern in the outlet channel is improved, and the entropy production decreases sharply or even falls below the entropy output value of the inlet. When the head increases to the average head, the entropy production changes little. The entropy production at the guide vane decreases with the increase of the head, indicating that the recovery effect of kinetic energy increases with the addition of the flow rate. The total entropy production of the inlet decreases with the increase of the head but only accounts for 1% of the total entropy production. The channel has little effect on the entropy production loss of the pump device. The entropy production ratio at the impeller position increases gradually as the head decreases. When the head reduces from the complete head to the minimum head condition, the entropy production ratio at the impeller rises by 10%, the most apparent change among all overflow components.
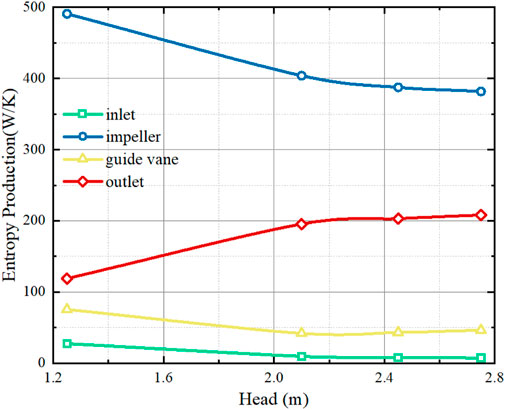
FIGURE 10. Total entropy production under different working conditions.
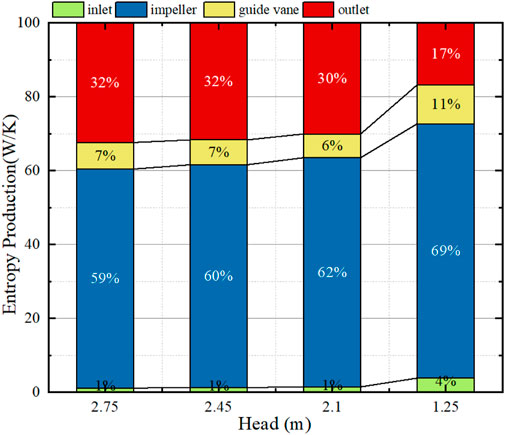
FIGURE 11. Percentage of entropy production per flow component.
The distribution of mainstream entropy production of impeller inlet 1–1 section is shown in Figure 12A. The mainstream entropy production around the flange and hub of impeller 1–1 section and near the blade is relatively high. From the flange and hub, the entropy production gradually decreases to the center of the flow channel, and there is a very obvious change gradient at the edge wall of the section. The high value range of mainstream entropy production increases with the decrease of head. When head decreases, the flow rate increases with the increase of flow velocity, which increases the collision between water flow and wall and causes the increase of entropy production loss. In the mainstream region, the flow pattern is good, and there is no obvious energy conversion, so the entropy production loss is small.
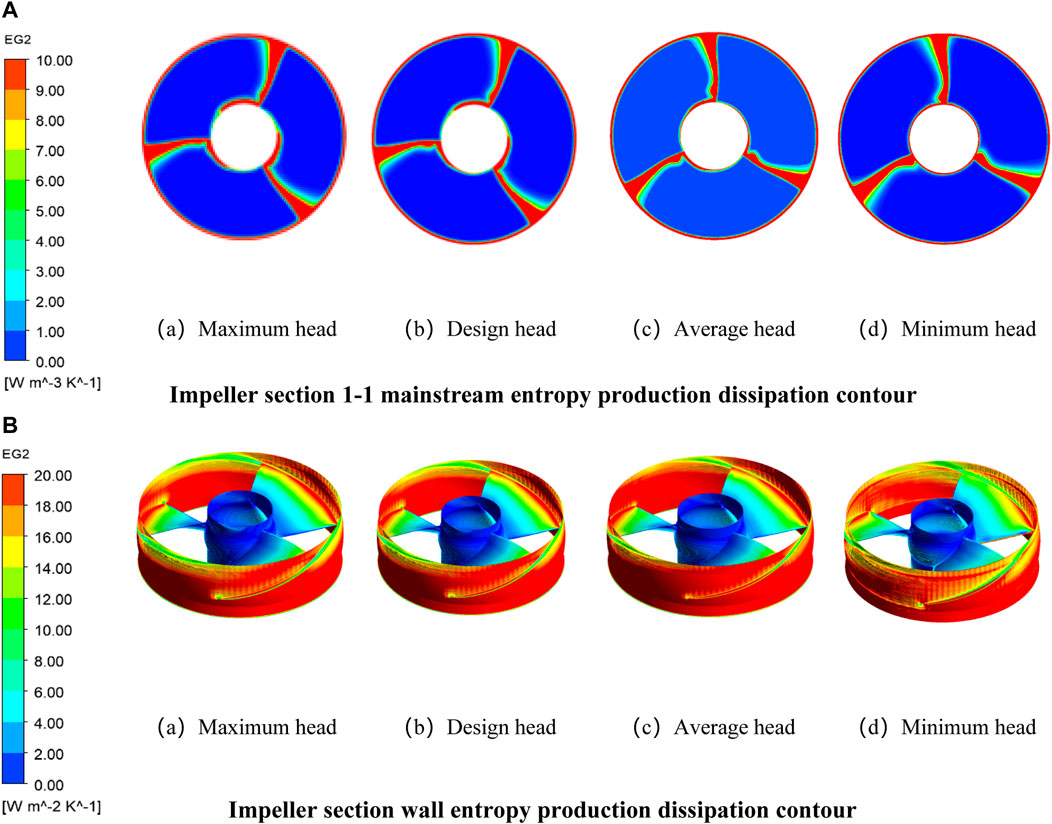
FIGURE 12. Entropy production dissipation contour in impeller domain. (A) Impeller section 1-1 mainstream entropy production dissipation contour. (a) Maximum head. (b) Design head. (c)Average head. (d) Minimum head. (B) Impeller section wall entropy production dissipation contour. (a) Maximum head. (b) Design head. (c) Average head. (d) Minimum head.
The entropy production distribution at the impeller’s overall wall is shown in Figure 12B. The entropy production of the impeller hub is significantly lower than that of the blade surface and the rim. The hub is selected for local amplification to analyze the distribution of entropy production. The rotation of the blade drives the flow to produce centrifugal force, which makes the flow and the pump shell have considerable friction. Therefore, the entropy production of the impeller rim and the wall of the blade domain is higher than that of the hub. The maximum entropy production rate on the blade is also at the rim. The entropy production rate decreases from the impeller rim to the hub, showing a gradient distribution.
The distribution of the main entropy production of the 1-1 section of the guide vane is shown in Figure 13A. Under different head conditions, the main entropy production has a high value area at the rim and hub. There are three high value areas of equal spacing around the hub, mainly due to the rotation of the blade at the impeller outlet section, which makes the water have a certain amount of circulation, resulting in the loss of entropy production caused by intense friction between the water and the wall. When the head is reduced, the high value distribution range of entropy production around the hub is further reduced, indicating that the entropy production distribution at the inlet of the guide vane is obviously affected by the impeller rotation under small flow conditions.
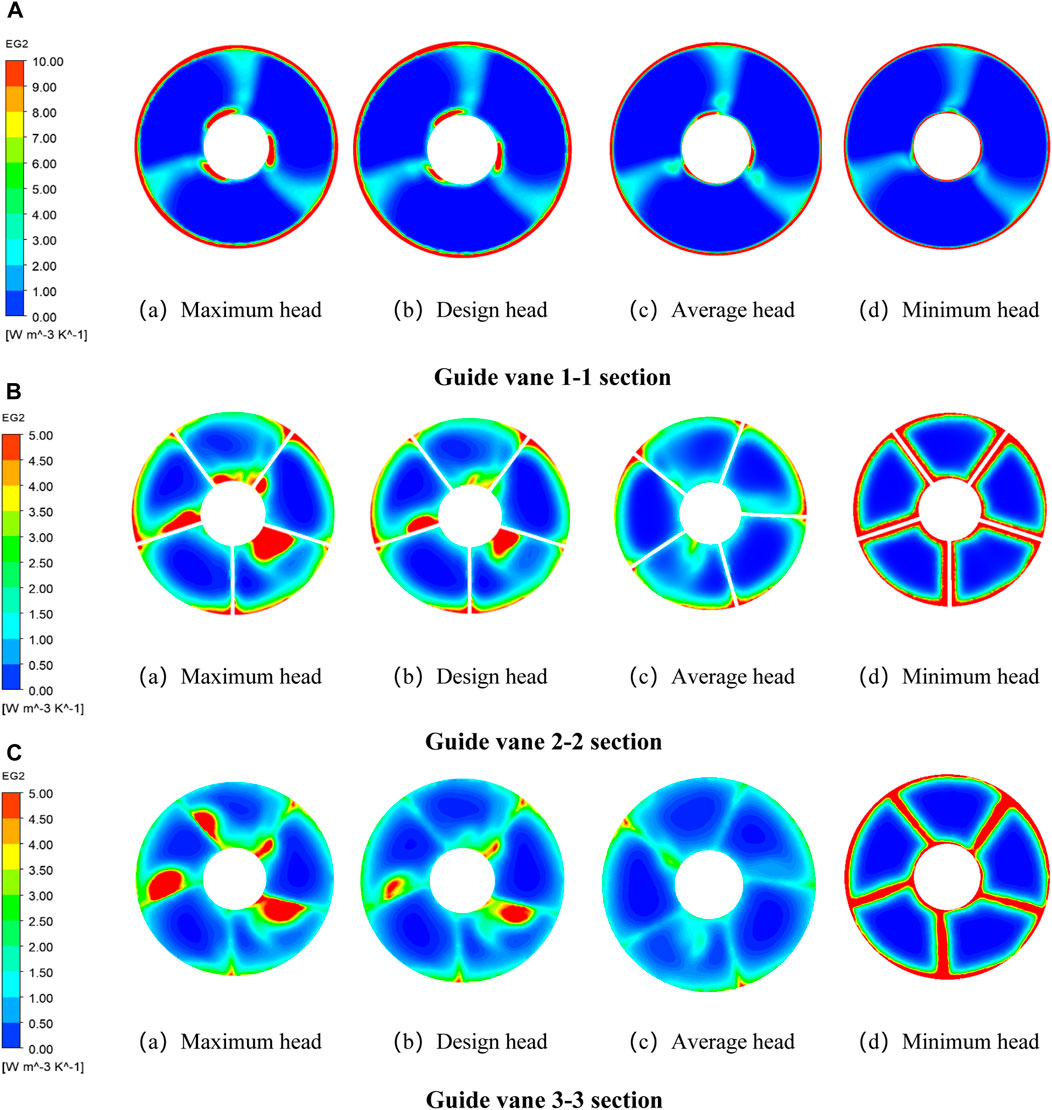
FIGURE 13. Mainstream entropy production dissipation in guide vane domain. (A) Guide vane 1-1 section. (a) Maximum head. (b) Design head. (c) Average head. (d)Minimum head. (B) Guide vane 2-2 section. (a) Maximum head. (b) Design head. (c) Average head. (d) Minimum head. (C) Guide vane 3-3 section. (a) Maximum head. (b) Design head. (c) Average head. (d) Minimum head.
The main entropy production distribution of guide vane 2-2 section is shown in Figure 13B. Due to the influence of guide vane, the section is divided into five channels, and the high value area of entropy production is still mainly distributed at the outer rim. However, at high lift, due to the small flow rate and low flow velocity, adverse flow patterns such as vortex or backflow are generated in the guide vane, which increases the entropy production loss. However, in the case of small head, the flow pattern of the water body is improved due to the increase of the flow velocity, but the friction between the water body and the wall increases, resulting in the increase of the high value area around the rim, hub and guide vane.
The mainstream entropy production distribution of the 3–3 section of the guide vane is shown in Figure 13C. The entropy production distribution of this section is still roughly divided into five parts with the same law. Under the high head condition, the bad flow pattern is improved after the guide vane rectifying the water body, and the range of high value area in the section is reduced. The high entropy production area under low head condition is still mainly located near the rim, hub and guide vane.
The wall entropy production contour of the guide vane computational domain is shown in Figure 14. The entropy production of the wall is lower than that of the mainstream entropy production, indicating that the mainstream entropy production is dominant at the guide vane. At the inlet of the guide vane body, the water has a certain amount of circulation due to the rotation of the impeller, and there is a strong impact and friction on the pump shell and the guide vane blade at the guide vane domain, resulting in a large loss of wall entropy production at this position. However, after the recovery of the water circulation by the guide vane, the wall entropy production of the water flow pattern gradually stabilized at the outlet of the guide vane decreases significantly, and there is a significant change gradient from the inlet to the outlet.
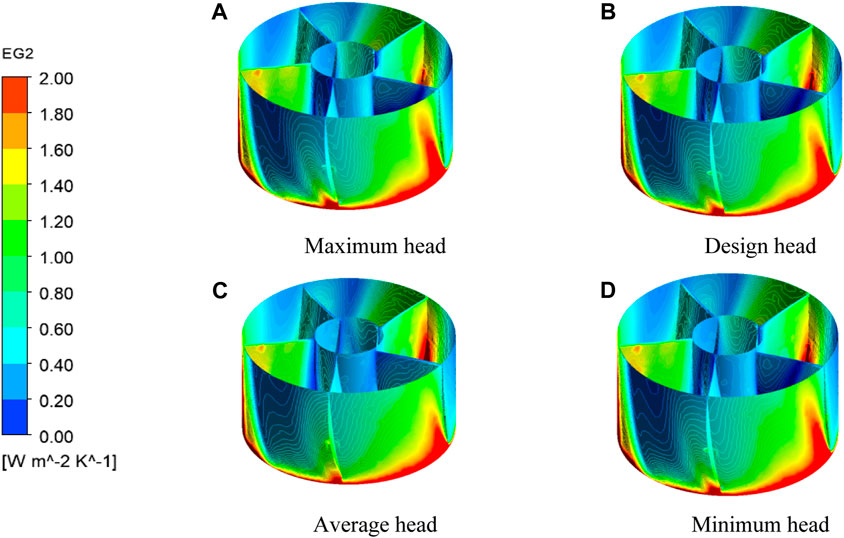
FIGURE 14. Guide vane section wall entropy production dissipation contour. (A) Maximum head. (B) Design head. (C) Average head. (D) Minimum head.
This paper mainly studies low-head bulb perfusion pumps’ internal flow characteristics and analyzes essential components’ entropy production.
(1) Firstly, through the comparative analysis of the numerical simulation experiment and the experimental data of the model machine, it is considered that the SST k-ω turbulence model can better match the experimental data in this paper.
(2) The streamline analysis of the pump device’s whole flow channel shows that the inlet channel’s streamline is usually good. After the impeller is rotated, the water body will have a certain amount of circulation. After the guide vane is recovered, the flow pattern is improved. The flow pattern is chaotic after the water flows through the bulb. The turbulent kinetic energy of water increases gradually with the decrease of the head.
(3) The high-pressure zone at the impeller is mainly located at the wheel rim, decreasing towards the hub, with a transparent gradient of variation, and the extent of the high-pressure zone gradually increases as the head decreases. The pressure variation in the impeller section also results in the water flow velocity at the impeller position being most excellent at the rim and reducing towards the hub. The guide vanes have a particular rectification effect on the water body. The cross-sectional analysis shows that the flow pattern of the water body through the guide vanes is improved to a certain extent and that the flow velocity of the water body at the guide vanes position gradually increases with decreasing head.
(4) The water entropy production head decreases and increases gradually, and the ratio of entropy production at the impeller to total entropy production is the largest. The mainstream entropy production at the impeller is mainly distributed around the blade because the impeller rotation reduces the water body. The entropy production of the wall is primarily located at the pump shell. The primary stream entropy production of the guide vane is under the non-design condition. Due to the instability of the water flow pattern, there is a lousy flow pattern inside the guide vane, which leads to a decrease in the turbulent entropy production. The wall entropy production at the inlet of the guide vane is more extensive, and there is a significant gradient change at the outlet.
The raw data supporting the conclusion of this article will be made available by the authors, without undue reservation.
Software, WJ and YW Validation, LC and CL Writing-original draft preparation XT and YW Writing-review and editing, XT and LC Supervision, WJ, LC, and CL All authors have read and agreed to the published version of the manuscript.
This research was funded by the National Natural Science Foundation of China (grant no. 52279091), A Project Funded by the Priority Academic Program Development of Jiangsu Higher Education Institutions (PAPD). Water Conservancy Science and Technology Project of Jiangsu Province.
The authors declare that the research was conducted in the absence of any commercial or financial relationships that could be construed as a potential conflict of interest.
All claims expressed in this article are solely those of the authors and do not necessarily represent those of their affiliated organizations, or those of the publisher, the editors and the reviewers. Any product that may be evaluated in this article, or claim that may be made by its manufacturer, is not guaranteed or endorsed by the publisher.
Ahn, S. H., Xiao, Y., Wang, Z., Luo, Y., and Fan, H. (2018). Unsteady prediction of cavitating flow around a three dimensional hydrofoil by using a modified RNG k-ε model. Ocean. Eng. 158, 275–285. doi:10.1016/j.oceaneng.2018.04.005
David, B., Ramousse, J., and Luo, L. (2012). Optimization of thermoelectric heat pumps by operating condition management and heat exchanger design. Energy Convers. Manag. 60, 125–133. doi:10.1016/j.enconman.2012.02.007
Guo, Y., Yang, C., Wang, Y., Lv, T., and Zhao, S. (2022). Study on inlet flow field structure and end-wall effect of axial flow pump impeller under design condition. Energies 15 (14), 4969. doi:10.3390/en15144969
Haddad, O. M., Alkam, M. K., and Khasawneh, M. T. (2004). Entropy generation due to laminar forced convection in the entrance region of a concentric annulus. Energy 29 (1), 35–55. doi:10.1016/s0360-5442(03)00156-7
Hua, H., Zhang, Z., Liu, X., et al. (2018). Predictive analysis of the damage to axial-flow pump's impeller in sandy water. Mechanics 24 (3), 323–328. doi:10.5755/j01.mech.24.3.13854
Ji, D., Lu, W., Lu, L., Xu, L., Liu, J., Shi, W., et al. (2021). Comparison of saddle-shaped region of head-flow curve between axial-flow pump and its corresponding axial-flow pump device. Shock. Vib. 2021, 1–17. doi:10.1155/2021/9481822
Kan, N., Liu, Z., Shi, G., and Liu, X. (2021). Effect of tip clearance on helico-axial flow pump performance at off-design case. Processes 9 (9), 1653. doi:10.3390/pr9091653
Koranteng Osman, M., Wang, W., Yuan, J., Zhao, J., Wang, Y., and Liu, J. (2019). Flow loss analysis of a two-stage axially split centrifugal pump with double inlet under different channel designs. Proc. Institution Mech. Eng. Part C J. Mech. Eng. Sci. 233 (15), 5316–5328. doi:10.1177/0954406219843573
Liang, H., Dai, Q., Hua, X., and Wang, H. (2018). Optimization design and experimental research on low specific speed high efficiency cross-flow pump model. People's Chang. 49 (21), 84–89. doi:10.16232/j.cnki.1001-4179.2018.21.016
Liu, C. (2009). Water pumps and pumping stations. Beijing: China Water Conservancy and Hydropower Publishing House.
Ma, X., Liu, X., and Zhang, C. (2019). Analysis of internal flow field and optimal design of static vane of oil and gas mixing pump. Fluid Mach. 47 (7), 21–26. doi:10.16617/j.cnki.11-5543/TK.2021.06.11
Ma, Y. (2021). Analysis of operational performance of inverter-regulated bulb cross-flow pump at Sihong Station of South-North Water Transfer. China Water Energy Electrification 2021 (06), 47–51. doi:10.16617/j.cnki.11-5543/TK.2021.06.11
Mu, T., Zhang, R., Xu, H., Zheng, Y., Fei, Z., and Li, J. (2020). Study on improvement of hydraulic performance and internal flow pattern of the axial flow pump by groove flow control technology. Renew. Energy 160, 756–769. doi:10.1016/j.renene.2020.06.145
Pan, Y., Chen, A., and Wang, Z. (2021). Fluid dynamic characteristics and flow Distribution structure optimization of axial piston pump Considering cavitation bubble evolution. J. Appl. Fluid Mech. 14 (6), 1603–1616. doi:10.47176/jafm.14.06.32437
Qin, Z., Wu, J., and Zhang, R. (2009). Analysis of hydraulic performance and structure for linjiaba bulb tubular pump set. J. Drainage Irrigation Mach. Engin 27 (3), 177–180. doi:10.3969/j.issn.1674—8530.2009.03.010
Ran, H., Luo, X., Zhu, L., Zhang, Y., Wang, X., and Xu, H. (2012). Experimental study of the pressure fluctuations in a pump turbine at large partial flow conditions. Chin. J. Mech. Eng. 25 (6), 1205–1209. doi:10.3901/cjme.2012.06.1205
Shi, L., Zhang, W., Jiao, H., Tang, F., Wang, L., Sun, D., et al. (2020a). Numerical simulation and experimental study on the comparison of the hydraulic characteristics of an axial-flow pump and a full tubular pump. Renew. Energy 153, 1455–1464. doi:10.1016/j.renene.2020.02.082
Shi, W., Cai, R., Li, S., et al. (2020b). Numerical simulation of pressure fluctuation characteristics of rear bulb tubular pump. South-to-North water transfer and water conservancy technology, 1–11.
Wang, F., Zhang, L., Li, Y., and Zhang, Z. (2008). Some key issues in numerical simulation of non-constant turbulent flow in axial flow pumps. J. Mech. Eng. 2008 (08), 73–77. doi:10.3901/JME.2008.073
Wang, Y., and Dai, C. (2010). Analysis of pressure pulsation characteristics of unsteady flow field inside centrifugal pump. J. Agric. Mach. 41 (03), 91–95. doi:10.3969/j.issn.1000-1298.2010.03.019
Wu, Y., Liu, S., Yuan, H., and Shao, J. (2011). PIV measurement on internal instantaneous flows of a centrifugal pump. Sci. China Technol. Sci. 54, 270–276. doi:10.1007/s11431-010-4262-3
Xie, C., Wang, D., and Deng, X. (2018). “Application of SST turbulence model in high precision algorithms,” in Proceedings of the 10th National Conference on Fluid Mechanics Abstracts, 52. [publisher unknown].
Yang, F., Hu, W., Li, C., Liu, C., and Jin, Y. (2020). Computational study on the performance improvement of axial-flow pump by inlet guide vanes at part loads. J. Mech. Sci. Technol. 34 (12), 4905–4915. doi:10.1007/s12206-020-2103-2
Yang, X., He, H., Xu, J., Wei, Y., and Zhang, H. (2018a). Entropy generation rates in two-dimensional Rayleigh–taylor turbulence mixing. Entropy 20 (10), 738. doi:10.3390/e20100738
Yang, X., Yu, Y., Liu, H., et al. (2018b). Research on the improvement of lateral inlet water flow pattern of pumping station based on SST k-ω turbulence model. J. Three Gorges Univ. Nat. Sci. Ed. 40 (03), 1–4.
Yu, A., Li, L., Ji, J., and Tang, Q. (2022). Numerical study on the energy evaluation characteristics in a pump turbine based on the thermodynamic entropy theory. Renew. Energy 195, 766–779. doi:10.1016/j.renene.2022.06.077
Zhang, D., Zhang, G., Shi, W., and Li, T. (2012). Performance prediction and experimental verification of axial flow pump based on CFD. Appl. Mech. Mater. 152, 1566–1571. doi:10.4028/www.scientific.net/AMM.152-154.1566
Zhang, R., Deng, D., Zhu, H., and Yao, L. (2008). Technical characteristics of different types of bulb cross-flow pumps. South-North Water Divers. Water Conservancy Sci. Technol. 6 (06), 6–9+15. doi:10.13476/j.cnki.nsbdqk.2008.06.030
Zhang, X., Tang, F., Chen, Y., Huang, C., Chen, Y., Wang, L., et al. (2022). Experimental study on the internal pressure pulsation characteristics of a bidirectional axial flow pump operating in forward and reverse directions. Machines 10 (3), 167. doi:10.3390/machines10030167
Zhang, D., Pan, Q., Hu, Z., Shi, W. D., Zhang, R. J., and Xing, J. (2017). Numerical simulation and optimization of solid-liquid two-phase flow in a back-swept axial-flow pump. Therm. Sci. 21 (4), 1751–1757. doi:10.2298/tsci160310064z
Keywords: bulb tubular pump, numerical simulation, turbulence model, internal flow characteristics, entropy production
Citation: Tian X, Cheng L, Jiao W, Wang Y and Luo C (2023) Analysis of internal flow characteristics and entropy generation of low head bulb tubular pump. Front. Energy Res. 11:1183086. doi: 10.3389/fenrg.2023.1183086
Received: 09 March 2023; Accepted: 17 March 2023;
Published: 13 April 2023.
Edited by:
Yongfei Yang, Nantong University, ChinaReviewed by:
Xinyang Liu, North China University of Water Resources and Electric Power, ChinaCopyright © 2023 Tian, Cheng, Jiao, Wang and Luo. This is an open-access article distributed under the terms of the Creative Commons Attribution License (CC BY). The use, distribution or reproduction in other forums is permitted, provided the original author(s) and the copyright owner(s) are credited and that the original publication in this journal is cited, in accordance with accepted academic practice. No use, distribution or reproduction is permitted which does not comply with these terms.
*Correspondence: Li Cheng, Y2hlbmdsaUB5enUuZWR1LmNu; Yuqi Wang, d3lxMjAwMDA1MjRAMTYzLmNvbQ==
Disclaimer: All claims expressed in this article are solely those of the authors and do not necessarily represent those of their affiliated organizations, or those of the publisher, the editors and the reviewers. Any product that may be evaluated in this article or claim that may be made by its manufacturer is not guaranteed or endorsed by the publisher.
Research integrity at Frontiers
Learn more about the work of our research integrity team to safeguard the quality of each article we publish.