 Zhao Yang
 Wang Yibo
 Liu Chuang
 Cai Guowei
- Key Laboratory of Modern Power System Simulation and Control and Renewable Energy Technology, Northeast Electric Power University, Jilin, China
With the goal of carbon reduction, China has carried out a series of institutional reforms and innovations in renewable energy consumption. However, the existing allocation rules for peak-shaving costs concentrate on the power side only. In the context of high energy penetration rates, peak-shaving cost significantly increases, and the economic pressure on the power side sharply increases. As the beneficiaries of peak shaving, the load side, while enjoying clean energy, also needs to bear the responsibility of peak shaving and share part of the peak-shaving cost. In this regard, this paper proposes a peak-shaving cost allocation mechanism considering load-side participation. First, it uses the marginal contribution theory to establish the peak-shaving value evaluation model of the power and load. Then, based on the waveform similarity theory, it sets two indicators “Fluctuation Trend Similarity” and “Waveform Amplitude Difference” to evaluate each load’s renewable energy consumption responsibility. Finally, the peak-shaving cost allocation rules on the power source side and the load side are obtained. An example shows that the proposed allocation mechanism can initially realize the uniform distribution of power and load in peak-shaving cost. Furthermore, the method can promote the fairness of the peak-shaving market and guide users to reasonably participate in the peak-shaving market.
1 Introduction
Under the high proportion of new energy access, thermal power units in the power system are often in a deep peak-shaving state, which generates a large amount of peak-shaving cost. Thermal power units that are in the deep peak-shaving state do not need to bear the peak-shaving cost, so the new energy units bear the cost mostly. The cost of peak shaving has caused the new energy units to operate under heavy pressure, and there is a risk of discarding new energy. As a public product, peak-shaving contribution benefits all members in the power system, so the cost caused by it needs to be shared by all members of the power system. In some European countries such as Germany, peak-shaving service cost is included in the user’s electricity bill in the form of incremental electricity prices (Jiamei Li and Xian, 2022), which alleviates the economic pressure of the power generation side. In China, there have been many studies on the allocation mechanismof peak-shaving costs in recent years. He et al. (2021) proposed a cost allocation method that considered the peak-shaving influence coefficient, by synthesizing the peak-shaving cost of each thermal power unit. In solving the problem of peak-shaving cost compensation for pumped storage power plants, Zhang et al. (2022) proposed the concept of quantifying the peak-shaving value of participating units. Jian et al. (2018) proposed a new mechanism based on Kaldor’s improvement theory for the distribution of deep peak-shaving benefits and established a compensation fee rule that was convenient for engineering realization. Xie et al. (2012), Zhao et al. (2013), and Dong et al. (2016) studied the problem of peak-shaving cost allocation when wind power is connected to the grid and established a model division based on game theory. Shao et al. (2018) established a peak-shaving scheduling model based on the direct demand factors and indirect factors of peak shaving. It used the cooperative game method to apportion the peak-shaving cost, effectively measuring the differences in the demand for peak-shaving auxiliary services by different subjects. Aiming at the problem of unfair peak-shaving cost allocation caused by renewable energy grid-connected, Hu et al. (2019) introduced the concept of active peak-shaving capability and proposed a new peak-shaving cost allocation method combined with peak-shaving characteristics of fluctuating power and conventional power. Chen et al. (2021) analyzed peak-shaving cost from the perspective of thermal power flexibility transformation and provided a theory for thermal power to participate in peak-shaving auxiliary services. Ye et al. (2022) used the theory of power generation rights to formulate cross-provincial wind power trading strategies and proposed a market mechanism conducive to cost compensation for peak-shaving units (units providing peak-shaving service). Jing et al. (2022) proposed a method for estimating system peak-shaving costs under high wind power penetration while considering flexible resource investment and peak-shaving markets. However, it is still limited to research on the peak regulation mechanism of the power side. Dong et al. (2017) studied storage sizing with a peak-shaving policy for wind farms based on the cyclic Markov chain model and indirectly analyzed the cost of energy storage caused by wind power. Li et al. (2022) considered the problem of the design of the peak-shaving market mechanism when the virtual power plant is connected to the grid. Xie et al. (2013) proposed a peak-shaving cost compensation method based on the combination of Shapley value and peak-shaving mileage, but the peak-shaving value cannot be assessed on the load side. Liu et al. (2017)proposed a peak-shaving cost allocation mechanism based on the proportion of generator power generation. Luo et al. (2021) proposed a compensation mechanism for peak-shaving fees based on dynamic peak-shaving benchmarks but did not find a corresponding solution to the overflow peak-shaving fee. Yang et al. (2022) analyzed the profit model of electric vehicle-type loads participating in the peak-shaving market, but there is little research on its peak-shaving responsibility. Li et al. (2020) proposed a peak-shaving model of fire-storage combination, without considering the load’s responsibility for renewable energy consumption.
The perfect market rules should include all members in the power system. However, the aforementioned studies have very little research on load-side peak-shaving cost and lack the method of peak-shaving value evaluation of various market members. Based on these, this article considers a user-side new energy source. Based on this, this article attempts to propose a peak-shaving mechanism that considers the responsibility for the consumption of new energy on the side. The innovation points of this mechanism are to evaluate the peak-shaving value of each member in the power system through the principle of marginal contribution value in Shapley and determine the peak-shaving costs of each user based on the degree of the user’s consumption of new energy. The main contributions are summarized as follows:
1. This paper establishes a fast calculation model of the peak-shaving cost based on existing research.
2. This paper uses the contribution margin theory in Shapley’s method to define the responsibilities of power and load and realizes the allocation of peak-shaving costs on both sides according to the responsibility.
3. For the problem of internal peak-shaving cost allocation on the load side, this paper uses the waveform similarity theory to analyze the impact of the load electricity consumption behavior on the consumption of renewable energy, so as to determine the new energy consumption responsibility of each load through the two indexes: fluctuation trend similarity and waveform amplitude difference. The results of the share of peak-shaving cost on the load side are determined by the two indexes.
This paper validates the effectiveness of the proposed method through a system example analysis of nine market members. The results will help market-oriented reforms under the background of renewable energy power system construction (Figure 1).
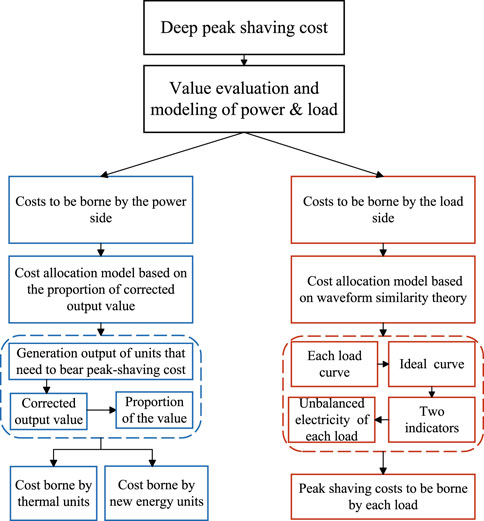
FIGURE 1. Logical structure.
2 Value evaluation and modeling of power and load
2.1 Value analysis of the peak-shaving service of power and load
The existing mechanism stipulates that the fee for paid peak-shaving auxiliary services shall be borne by renewable energy plants and other types of power plants that do not meet the peak-shaving requirements. It is not easy to effectively define and calculate the cost sharing when loads participate in peak-shaving auxiliary services. From a market perspective, each participant should bear the peak-shaving cost according to its impact on peak shaving. The peak-shaving value analysis is the quantification process of this impact. In the problem of benefit distribution or cost sharing, according to the cooperative game theory, for an alliance S, the value of any member to the alliance is the marginal contribution of the member, that is, the increase or decrease of the alliance value after the alliance loses the member. Therefore, in the peak-shaving auxiliary service market, the responsibility of each participant in the market should be expressed by its marginal contribution to peak shaving; that is, the peak-shaving value of any participant is the added value of its peak ancillary service fee. After calculating the added value of all participants, the user and the power generation side are classified into two categories. The ratio of the two categories is the weight ratio of the peak-shaving service fee on the power generation side and the load side. For the actual peak-shaving market, all market members form an indissoluble alliance S, the overall peak-shaving value of the alliance is v(S), and its peak-shaving fee is F{S}. After losing alliance S, the peak-shaving fee does not exist, so the overall peak-shaving value of the alliance is considered to be equal to its overall peak-shaving fee
When the alliance is stable, for a certain peak-shaving market member i, its peak-shaving value is
where F{S/i} represents the peak-shaving fee of alliance S after excluding member i.
For the power side, after a certain generating unit is excluded, the power generation it undertakes should be supplemented by an additional generation of other peak-shaving units. At this time, the load factor of the peak-shaving unit increases, and the peak-shaving cost is negatively correlated with the load factor of the peak-shaving unit. The peak-shaving cost is reduced. On the premise that all market members are rational, the additional electricity generated by each peak-shaving unit should be optimized according to the principle of maximizing the peak-shaving cost reduction. On the load side, assuming that the system loses a certain load i, the reduced power consumption corresponds to the reduction of all peak-shaving units’ output to make up for it. At this time, the load factor of the peak-shaving unit decreases. The peak-shaving cost is negatively related to the load factor of the peak-shaving unit, so the peak-shaving cost increases. The load factor drop value of each peak-shaving unit needs to be optimized to minimize the increase in the peak-shaving amount. The specific process is shown in Figure 2.
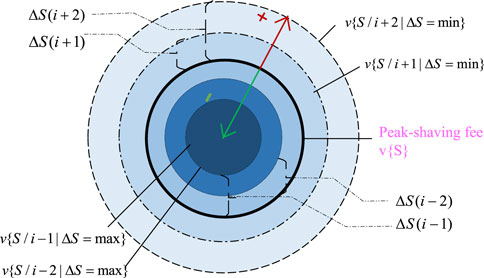
FIGURE 2. Change of peak-shaving fee and marginal contribution of participants.
In Figure 2, F{S/i−1} or F{S/i−2} represents the overall peak-shaving fee of the alliance after losing a member on the power generation side, and F{S/i+1} or F{S/i+2} indicates the overall peak-shaving fee of the alliance after losing a member on the load side.
2.2 Peak-shaving value evaluation model
Based on the value analysis of power and load, the peak-shaving value evaluation model is constructed as follows:
where PT,i is the power generation sequence of a generating unit.
where PT,n is the power generation sequence of the remaining units.
At the same time, the total amount ΔPT,n is set as the decision variable. ΔPT,n can be calculated by the following formula:
After removing the set PT,i, the power generation sequence of the remaining units
At the same time, the objective function is
Constraints are as follows:
where Ng is the number of the power plant.
Suppose the load sequence PL,i of a specific load is
After removing load i, the reduction output of the remaining generating units △PT,n is the decision variable, and △PT,n can be calculated by the following formula:
After removing the set PL,i, the power generation sequence of the remaining units
At the same time, the objective function is
Constraints are as follows:
Let α: β be the weight ratio of the peak-shaving cost that should be borne by the power generation side and the load side.
According to formulas 3–8, 14, the cost to be borne by the power generation side is as follows:
From formulas Eqs 9–13 and Eq. 14, the cost to be borne by the load side is as follows:
where F is the total peak-shaving fee, FGen is the cost of the power generation side, and FCus is the cost of the load side.
3 Apportionment method of peak-shaving cost considering the responsibility of the load side
3.1 Calculation of peak-shaving fee
The thermal power unit running at a low-load factor generates the deep peak-shaving fee F. When the output of thermal power unit is lower than the paid peak-shaving benchmark, the difference between the paid peak-shaving benchmark and the actual thermal power unit output is called the paid peak-shaving electricity. The peak-shaving fee is the sum of the products of the paid peak-shaving electricity of each gear and the peak-shaving marginal electricity price of each gear. The calculation model is as follows:
where ΔT is the sampling period, Pi,t is the output sequence of peak-shaving unit i, Pi, max is the upper limits of output of peak-shaving unit i, Pi, min is the lower limits of output of peak-shaving unit i, β1% is the first-grade paid peak-shaving load factor of unit i, β2% is the second-grade paid peak-shaving load factor of unit i, SN,i is the rated capacity of unit i,
When
When
When
3.2 Allocation method of peak-shaving cost on the power side
For the internal allocation of peak-shaving cost on the power side, each generating unit is calculated according to the proportion of the correction value of the on-grid electricity in each generator’s peak-shaving billing cycle to the total. Among them, for thermal power units, if the load factor is higher than the minimum peak load factor requirement, the correction method is
where
where
and the cost all wind power units should bear is as follows:
where FGen,T,j is the cost that the non-renewable energy unit should bear and FGen,W,k is the cost that the renewable energy unit should bear.
3.3 Allocation method of peak-shaving cost on the load side
Based on the theoretical analysis of the waveform similarity, this paper sets up two indicators. One is the similarity of the fluctuation trend, and the other is the difference of the waveform amplitude. The difference between the original load curve and the ideal curve is analyzed through these two indicators. Then, these two indicators are combined to determine the impact of each load’s power consumption behavior on peak regulation. Finally, the user side cost is determined.
3.3.1 Idealized load power consumption curve
When the electric curve of the load is entirely consistent with the waveform of the renewable energy power generation curve, the fluctuations of the two uncertain factors of the power system at this time calm each other, which means that the load’s power consumption behavior is ideal. The transformation method of the load-idealized curve is as follows:
where PL,i,t is the original power consumption sequence of load i,
3.3.2 Fluctuation trend similarity coefficient
The fluctuation trend similarity coefficient θ represents the similarity of the change of the load curve and the ideal curve waveform. The larger the indicator, the more similar. The calculation formula is as follows:
Among them,
ΔPL,i,t should be calculated from the original power consumption sequence of load PL,i,t using the following formula:
3.3.3 Waveform amplitude difference coefficient
The coefficient θ based on the similarity algorithm of the string is sensitive to the fluctuation trend and not sensitive to the amplitude of the fluctuation. Therefore, setting Jensen–Shannon distance τ measures the difference in the amplitude difference between the two distributions. The larger the indicator, the more different.
where τL,i is the amplitude difference between load i and its own ideal power curve waveform and PL,All,i is the total power generation of load i.
According to formulas 27–30, the similarity between each load and the renewable energy generation curve is expressed as a two-dimensional vector (θ, τ). θ represents the gap between the trends of the two curves, and τ represents the difference between the amplitude distributions of the two curves. The formula for calculating the unbalanced electricity in the θ direction is
The formula for calculating the unbalanced electricity in the τ direction is
Comprehensive unbalanced electricity ΔSi is calculated by the following formula
where ΔSi,θ is the unbalanced power consumption of load i in the direction of θ, ΔSi,τ is the unbalanced power consumption of load i in the direction of τ, fL,i(t) is the function of the power consumption curve of load i after interpolation,
where FCus,i is the peak-shaving cost that load i should bear and FCus is the total peak-shaving cost on the load side.
4 Case analysis
4.1 Calculation overview
This paper uses a regional system including six power producers and three typical power users for verification and analysis. The parameter power units are shown in Table 1. The outputs of non-renewable energy plants are shown in Figure 3. The outputs of renewable energy plants are shown in Figure 4. The typical load curves are shown in Figure 5.
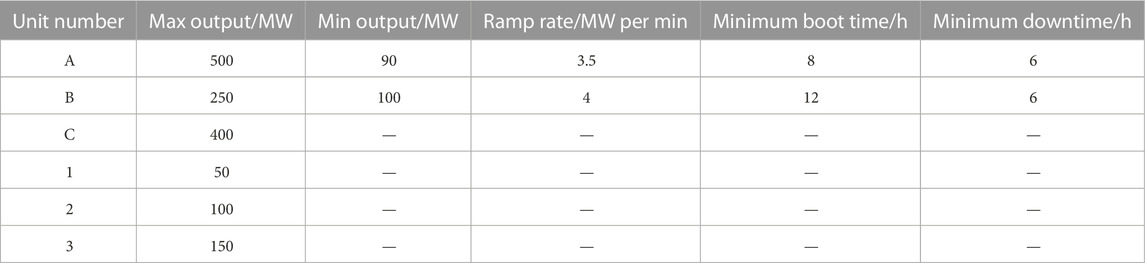
TABLE 1. Unit parameters.
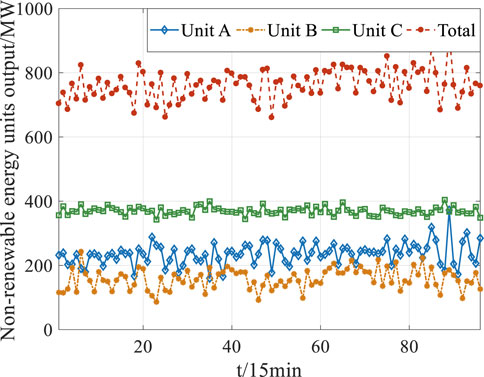
FIGURE 3. Output curve of non-renewable energy plants.
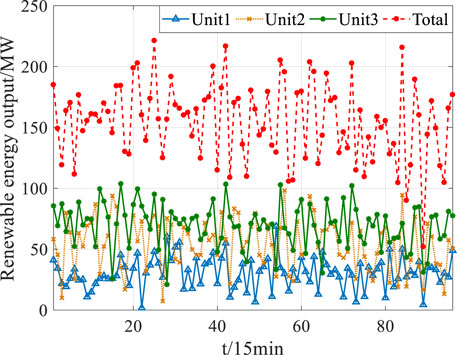
FIGURE 4. Output curve of renewable energy plants.
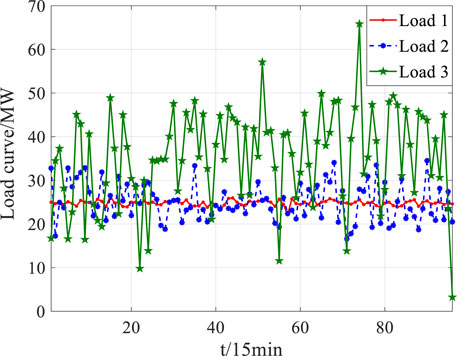
FIGURE 5. Typical load fluctuation curve.
In Table 1, numbers A–B are peak-shaving thermal power plants, C is hydropower plants, and 1–3 are renewable energy plants. The peak-shaving benchmark of thermal power units for peak regulation is set as follows: 50% of the load factor is the first-grade paid peak-shaving service boundary, and 40% is the second-grade paid peak-shaving service boundary. The highest price for each level of peak regulation is 0.4 RMB/kWh and 1 RMB/kWh, respectively. The on-grid electricity price of renewable energy is 0.3749 RMB/kWh, and the power correction coefficients of each renewable energy are d = 2, p = 1, and z = 0.5.
4.2 Analysis of peak-shaving cost apportionment results
The calculation examples show the division of peak-shaving responsibilities for power and load. The specific calculation results are as follows.
4.2.1 Responsibility division and apportionment results for power and load peak regulation
The calculated peak-shaving cost is shown in Figure 6 according to Table 1, Figure 4, and Eqs 17–20.
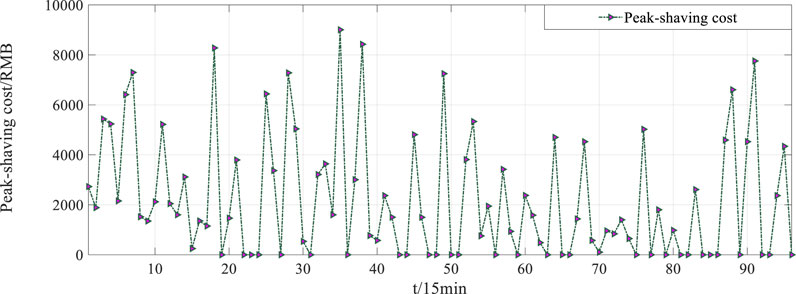
FIGURE 6. Calculation result of peak-shaving cost.
In Figure 6, the peak-shaving depth of the thermal power unit mainly determines the peak-shaving fee. When the first-tier paid peak-shaving capacity of the system is insufficient, it will enter the second-tier peak-shaving interval. At this time, the peak-shaving cost curve has a peak moment. Before allocating the peak-shaving cost of the load side, the respective peak-shaving responsibilities of the power and load sides should be divided. The peak-shaving value expresses the peak-shaving responsibility of a certain market participant. The ratio of the total peak-shaving value on the power side to the total peak-shaving value on the power side is the basis for dividing peak-shaving costs. As the operating conditions of the system change from time to time, the peak-shaving value of market participants also changes dynamically. Figure 7 shows the results of the calculated peak-shaving responsibilities of power and load.
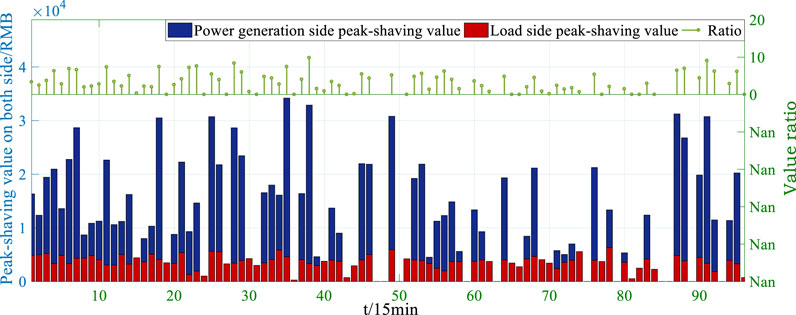
FIGURE 7. Calculation result of peak-shaving cost.
In Figure 7, the blue and red histograms are the power and load peak-shaving values, respectively; the green needle graphs are the weight ratios of power and load peak-shaving responsibilities by time. The example uses the intraday weight ratio average (2.44:1) for calculation. Under this weight ratio, the cost comparison of different allocation methods is shown in Table 2.
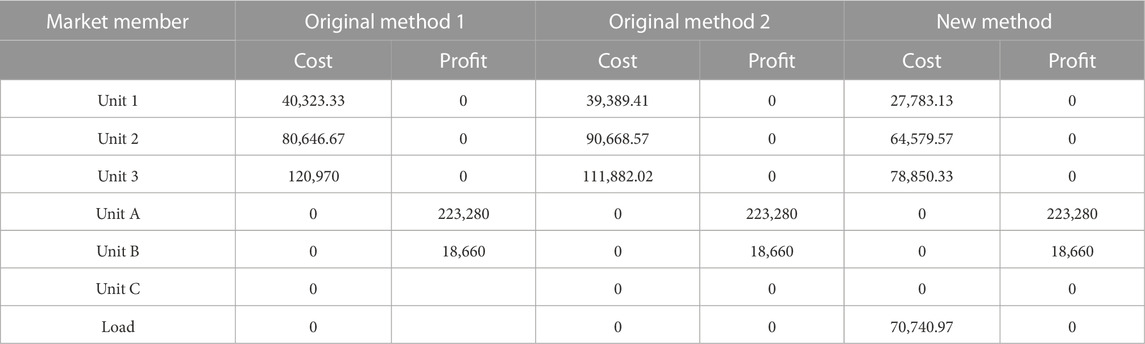
TABLE 2. Cost comparison of different allocation methods.
In Table 2, original method 1 is based entirely on the allocation of electricity division. This allocation method is the most basic and original allocation method, which to some extent reflects the responsibility of peak shaving. However, there is no more detailed evaluation of peak-shaving responsibility. Original method 2 only allocates peak-shaving costs on the power source side based on the correction electricity value, which is currently implemented in most regions of China. It corrects and compensates for units with poor efficiency. There is still no detailed evaluation of peak-shaving responsibilities. The new method considers the peak-shaving responsibilities on both sides of the power and load and establishes a detailed peak-shaving responsibility evaluation model.
In the scenario, the weight ratio of power and load peak-shaving responsibilities is 2.44:1. Considering the output of peak-shaving thermal power units, thermal power units A and B both meet the peak-shaving requirements and do not need to bear peak-shaving costs; hydropower unit C is not involved in the apportionment mechanism, so the peak-shaving cost is 0. Based on the renewable energy output, the renewable energy on-grid electricity from large to small is Unit 3
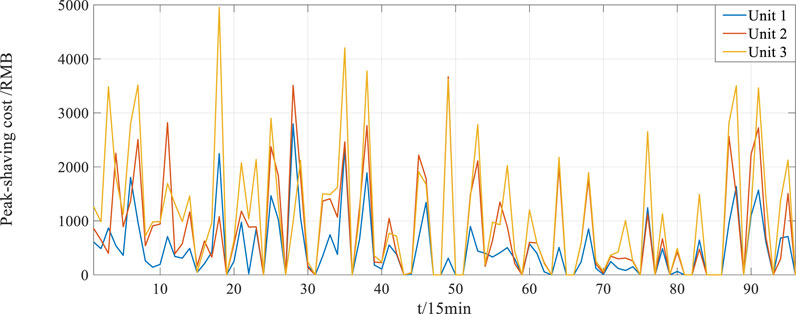
FIGURE 8. Peak-shaving cost of renewable energy units without the load side.
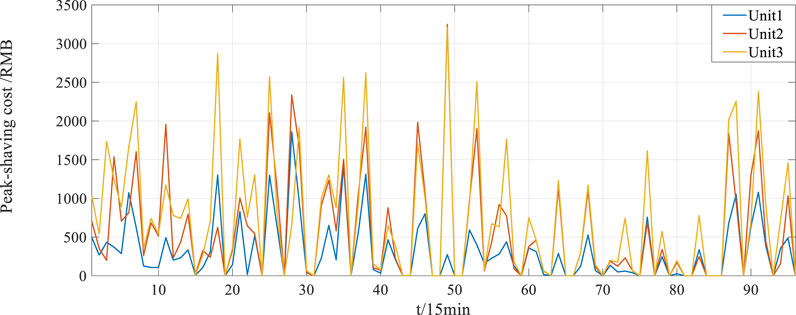
FIGURE 9. Peak-shaving cost of renewable energy units considering load-side participation.
Considering the apportionment mode of user-side participation, the total apportioned cost of the power side is reduced from 241,940 yuan to 171,213.03 yuan. Unit 1 reduces the cost by 11,606.28 yuan; Unit 2 reduces the cost by 26,089 yuan; and Unit 3 reduces the cost by 33,031.69 Yuan. The results show that the new method diminishes the peak-shaving cost of the renewable energy power generation side by 18.52% on average. Compared with Figures 8, 9, the sort of peak adjustment costs of each renewable energy unit before and after load participation remains unchanged. However, for large-capacity renewable units, the reduced cost is more than other small-capacity units, which encourages the future construction of large-capacity renewable energy sources.
4.2.2 Allocation results of peak-shaving cost on the load side
According to the content of Chapter 2.3, the original power consumption curve of each load and the load-idealized curve are shown in Figure 10.
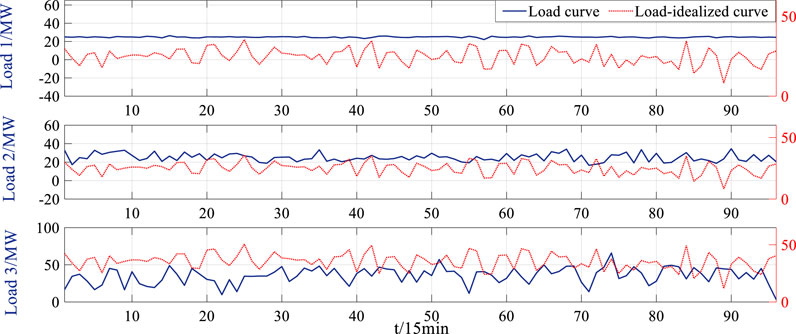
FIGURE 10. Original load curve and load-idealized curve.
In Figure 10, the power consumption curve after equal power conversion is the load-idealized curve. The load-idealized curve is consistent with the waveform of the renewable energy total power generation curve, and the total power consumption is equal to the power consumption of the load curve before conversion. The total power consumptions of loads 1–3 are 2381.83 MW, 2403.21 MW, and 3397.90 MW, respectively.
Calculated according to formulas 27–30, the similarity vectors between loads 1–3 and their load-idealized curve are (0.07, 0.12), (0.29, 0.14), and (−0.25, 0.25). Each vector is in two-dimension, and the position relationship is shown in Figure 11.
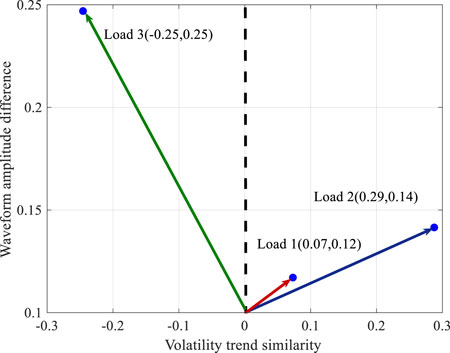
FIGURE 11. Load similarity vector graph.
It can be seen intuitively from Figure 11 that the volatility trend similarity is load 2
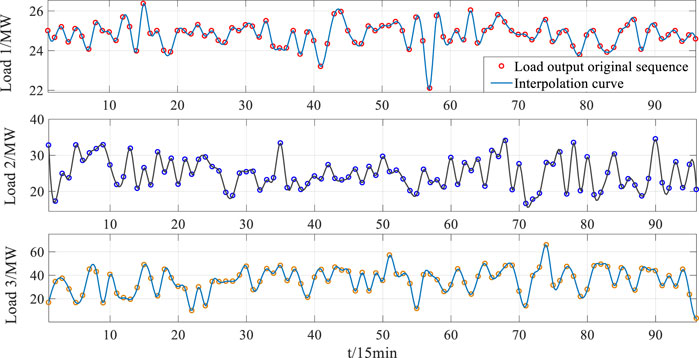
FIGURE 12. Load similarity vector graph.
According to the interpolation results and Eq. 34, the total peak-shaving unbalanced power and the sharing ratio of each load are shown in Figure 13.
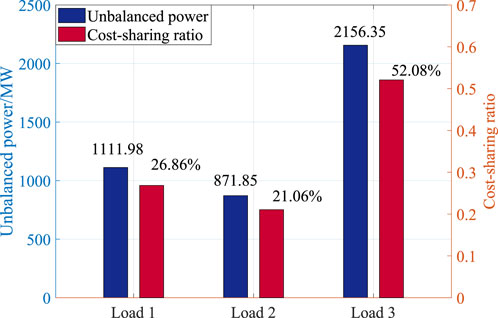
FIGURE 13. Unbalanced power consumption of the load and sharing proportion.
On the load side, the peak-shaving cost borne by any load should be apportioned according to the proportion of the load’s peak-shaving unbalanced power consumption. Figure 13 shows each load’s peak-shaving unbalanced power within a day in the blue histogram. The sharing ratio corresponding to the waveform similarity between each load and the renewable energy output curve is shown in the red histogram. The peak cost ratios are 26.86%, 21.06%, and 52.08%. The calculation results of internal cost allocation on the load side are shown in Table 3.
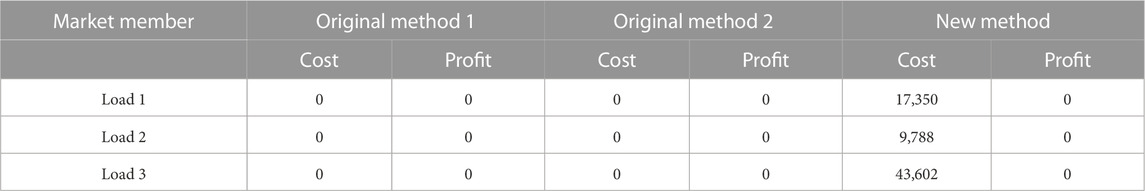
TABLE 3. Load-side internal cost allocation result.
It can be seen from the calculation results that the fluctuation trend similarity between the power consumption curve of load 1 and the renewable energy output curve is 0.07, and the waveform amplitude difference is 0.12. Although the power consumption curve of load 1 is stable, it has no outstanding contribution to the consumption of renewable energy. So, load 1 bears the second highest fee. The similarity of the fluctuation trend of load 2 is 0.29, and the difference in waveform amplitude is 0.14. However, its power consumption trend has played a certain role in renewable energy consumption, so it bears the minimum fee. The similarity of the fluctuation trend of load 3 is −0.25, and the amplitude difference of the waveform amplitude is 0.25. The power trend could be more conducive to the consumption of renewable energy. Its waveform amplitude has a large difference, which increases the burden of renewable energy consumption in the system, so it bears the highest fee. Based on the aforementioned analysis, the peak-shaving responsibility on the load side is ranked from large to small as load 3
5 Conclusion
In the context of low-carbon power system construction, this paper proposes a peak-shaving cost allocation mechanism that considers the responsibility of renewable energy consumption on the load side. First, according to the peak-shaving value of market participants, the weight ratio of peak-shaving value on the power and load side is divided. Then, according to the similarity between the load curve and load-idealized curve, this paper calculates the peak-shaving cost that each load should bear. Finally, the calculation example shows that this method achieves the distribution purpose of “allocation according to rights and allocation according to responsibilities.” Meanwhile, the new method implements the allocation idea “who benefits, who bears.” The method proposed in this paper incorporates the load side into the main body of peak-shaving cost allocation. It is conducive to regulating the rational use of electricity by power users, promoting the development of renewable energy, and contributing to the construction of the future low-carbon power system.
Data availability statement
The raw data supporting the conclusion of this article will be made available by the authors, without undue reservation.
Author contributions
LC and WY contributed to the conception and design of the study. ZY performed the statistical analysis. ZY wrote the first draft of the manuscript. WY, ZY, XY, XZ, CG, and GW wrote sections of the manuscript. All authors contributed to the article and approved the submitted version.
Funding
This research was supported by projects that were supported by the coupling integration and flexible operation control technology of renewable energy and thermal power generation program (2019YFB1505400).
Conflict of interest
The authors declare that the research was conducted in the absence of any commercial or financial relationships that could be construed as a potential conflict of interest.
Publisher’s note
All claims expressed in this article are solely those of the authors and do not necessarily represent those of their affiliated organizations, or those of the publisher, the editors, and the reviewers. Any product that may be evaluated in this article, or claim that may be made by its manufacturer, is not guaranteed or endorsed by the publisher.
References
Chen, H. Y., Xiong, Y., Wang, W., Xiong, N., and Li, Y. X. (2021). “Flexible transformation cost analysis of thermal power in jiangxi province for depth peak-shaving,” in 2021 International Conference on Power System Technology, Haikou, China, 08-09 December 2021, 940–945.
Dong, F., Zhang, Y., and Shang, M. (2016). Multi-criteria comprehensive evaluation of distributed energy system. Proc. CSEE36, 3214–3223.
Dong, J., Gao, F., Guan, X., Zhai, Q., and Wu, J. (2017). Storage sizing with peak-shaving policy for wind farm based on cyclic Markov chain model. IEEE Trans. Sustain. Energy8, 978–989. doi:10.1109/tste.2016.2637916
He, Y., Ding, T., Liu, R., Qu, M., Chen, T., and Bie, C. (2021). Long noncoding RNA SNHG25 promotes the malignancy of endometrial cancer by sponging microRNA-497-5p and increasing FASN expression. Power Syst. Autom.45, 163–169. doi:10.1186/s13048-021-00906-w
Hu, Z., Bi, X., Wang, K., Hu, H., Liu, Y., and Guo, X. (2019). Design of peak regulation auxiliary service market for east China power grid to promote inter-provincial sharing of negative reserve. Automation Electr. Power Syst.2019, 175–182.
Jiamei Li, S. Y., and Xian, Ai (2022). The market mechanism of virtual power plants participating in peak shaving and frequency modulation services and foreign experience reference. Proc. CSEE42.
Jian, X., Zhang, L., Yang, L., Han, X., and Wang, M. (2018). Deep-peak regulation mechanism based on kaldor improvement under high-penetration wind power. Automation Electr. Power Syst.42, 110–118.
Jing, Z., Tao, Z., Yuou, H., Guixin, Z., and Baisong, Z. (2022). “A method to calculate the comprehensive cost of electric power system peak regulation considering flexible resource investment,” in 2022 7th Asia Conference on Power and Electrical Engineering, Hangzhou, China, 15-17 April 2022. 1802–1809.
Li, J., Ai, Q., and Yin, S. (2022). Market mechanism and foreign experience of virtual power plant participating in peak-regulation and frequency-regulation. Proc. CSEE42, 37–56.
Li, M., Wang, Y., Tian, Y., and Liu, H. (2020). “Deep peak shaving model of fire-storage combination under high permeability wind power conditions,” in 2020 IEEE 3rd Student Conference on Electrical Machines and Systems, Jinan, China, 04-06 December 2020, 674–679.
Liu, Y., Zhang, H., and Li, Q. (2017). Design and practice of peak regulation ancillary service market for northeast China power grid. Automation Electr. Power Syst.41, 148–154.
Luo, H., Wang, H., Ge, W., Liu, C., and Wang, Y. (2021). Design of dynamic peak regulation ancillary service market bidding mechanism considering quotation supervision. Trans. China Electrotech. Soc.36, 1935–1955.
Shao, L., Liu, R., Wang, H., Liu, L., Ye, L., and Yao, J. (2018). A method for cost allocation of reserve based on conditional value at risk. Power Syst. Prot. Control46, 23–30.
Xie, J., Li, Z., Zhang, M., Zhang, X., Wu, F., and Fu, R. (2013). Peaking value quantification and cost compensation for generators. Trans. China Electrotech. Soc.2013, 271–276.
Xie, J., Zhang, X., Wu, F., and Fu, R. (2012). Peaking cost allocation using cooperative game theory and engineering concept. Power Syst. Prot. Control40, 16–23.
Yang, J., Qin, W., Shi, W., Cao, R., and Yao, H. (2022). Two-stage optimal dispatching of regional power grid based on electric vehicles’participation in peak-shaving pricing strategy. Trans. China Electrotech. Soc.37, 58–71.
Ye, P., Wei, J., Wang, H., Guan, D., Zhang, M., and Pan, X. (2022). “Research on multi-source peak shaving scheduling and trading strategy of cross-provincial contact lines,” in 2022 IEEE 2nd International Conference on Electronic Technology, Communication and Information, Changchun, China, 27-29 May 2022, 256–259.
Zhang, Z., Cong, W., Liu, S., Li, C., and Qi, S. (2022). Auxiliary service market model considering the participation of pumped-storage power stations in peak shaving. Front. Energy Res.10. doi:10.3389/fenrg.2022.915125
Keywords: deep peak-shaving, value assessment, benefit distribution, load side, market rules
Citation: Yang Z, Yibo W, Chuang L, Guowei C, Weichun G, Yueyang X and Ziwei X (2023) Research on the deep peak-shaving cost allocation mechanism considering the responsibility of the load side. Front. Energy Res. 11:1182620. doi: 10.3389/fenrg.2023.1182620
Received: 09 March 2023; Accepted: 15 May 2023;
Published: 01 June 2023.
Edited by:
Harun Or Rashid Howlader, University of the Ryukyus, JapanReviewed by:
Haibo Li, Tsinghua University, ChinaQianzhi Zhang, Cornell University, United States
Nan Chen, Tennessee Technological University
Copyright © 2023 Yang, Yibo, Chuang, Guowei, Weichun, Yueyang and Ziwei. This is an open-access article distributed under the terms of the Creative Commons Attribution License (CC BY). The use, distribution or reproduction in other forums is permitted, provided the original author(s) and the copyright owner(s) are credited and that the original publication in this journal is cited, in accordance with accepted academic practice. No use, distribution or reproduction is permitted which does not comply with these terms.
*Correspondence: Wang Yibo, d2FuZ3lpYm9mYW5neXVhbkAxMjYuY29t