 Fei Tian
 Chen Yang
 Erfeng Zhang1
94% of researchers rate our articles as excellent or good
Learn more about the work of our research integrity team to safeguard the quality of each article we publish.
Find out more
ORIGINAL RESEARCH article
Front. Energy Res. , 05 July 2023
Sec. Process and Energy Systems Engineering
Volume 11 - 2023 | https://doi.org/10.3389/fenrg.2023.1180607
This article is part of the Research Topic Optimal Design and Efficiency Improvement of Fluid Machinery and Systems View all 18 articles
In this study, the performance of submersible mixers in sewage treatment was improved by optimizing the installation position parameters of the mixer. The aim was to enhance the average flow velocity and mixing efficiency in the pool. The study employed ISIGHT software, integrated with Creo Parametric 6.0 software and ANSYS Workbench 2020 software, to analyze the factors affecting mean flow velocity and completed a multi-objective optimized design using Non-dominated Sorting Genetic Algorithm (NSGA-II). The study used the ISIGHT software to analyze the factors affecting mean flow velocity in the pool. The installation position parameters of the submersible mixer were selected as design variables. The study employed Creo Parametric 6.0 software to create a three-dimensional model of the pool and the submersible mixer. ANSYS Workbench 2020 software was used to simulate fluid flow in the pool. The Non-dominated Sorting Genetic Algorithm (NSGA-II) was used for multi-objective optimization. The results of the study indicated an increase of approximately 0.021 m/s in average flow velocity and an improvement of approximately 0.47% in mixing efficiency compared to pre-optimization values. The effective axial propulsion distance and effective radial diffusion radius were significantly increased by 6.71% and 8.33%, respectively, after optimization. The fluid distribution in the pool became more uniform, and the low-speed zone was greatly reduced, resulting in an enhanced flow state of the fluid in the pool and a strengthened mixing effect. The study provides insights into the control of the submersible mixer’s installation position to improve the average flow velocity inside the pool. Automatic optimization of submersible mixer installation locations using the ISIGHT software can effectively improve mixing efficiency, overall plant operating efficiency, and economic benefits in sewage treatment plants. The multi-objective optimization platform based on the ISIGHT platform for wastewater treatment mixer installation location can be successfully applied in engineering practice.
The submersible mixer is an efficient submersible mixing and pushing device (Yan et al., 2009). It is typically utilized in sewage treatment plants, a variety of pools and oxidation ditches and landscape environments for conservation equipment, among others. The impeller of the submersible mixer is driven by the motor through rotating and stirring to achieve the creation of water flow and water circulation in the pool, uniform mixture, so that the suspended matter is effectively suspended from the bottom, improve water quality and increase the oxygen content of water (Tian et al., 2022a). The energy consumption and efficiency of submersible mixers greatly affect the operation and development of the water treatment industry, with its special economic and social benefits (Qiu, 2021).
In the actual engineering application, the flow phenomenon of submersible mixers is more complex. The water flow collides with the pool wall and produces rebound, sometimes causing backflow, vortex and other conditions. The flow field characteristics of the mixing pool are influenced by several factors. These factors include the hub ratio, the installation position, the angle of the mixer, blade clearance, blade placement angle, etc. Optimizing the layout of the mixer, the design of the pool shape and the structure of the mixer are conducive to enhancing mixing efficiency and achieving desirable mixing effects (Liu et al., 2022). Therefore, the study of optimal design for submersible mixer is an important direction for engineering design.
Many studies have been conducted on the optimization design of submersible mixer performance, using methods such as experiment, numerical simulation, and theoretical calculation. For example, Chen et al. adopted numerical simulation to optimize the arrangement of the mixer using clear water as the study medium. The results showed that the mixer arrangement near the inlet would increase the area of the central low-velocity region (Chen et al., 2020). Xu et al. studied the flow field distribution in the pool under two cases of submersible mixer installation depth of 3 m and 5.72 m, using clear water flow as the medium. The results indicated that the submersible mixer installed near the bottom of the pool formed a high-velocity flow area on the bottom surface of the pool (Xu and Yuan, 2011). Tian et al. studied the external characteristics of submersible mixers when they were located in four different positions in the pool. The study found that the best mixing was achieved when the impeller centre axis of the submersible mixer was 600 mm from the pool bottom, the blades were at least 200 mm from the pool bottom and the ratio of wall width to wall narrowness was 4:3 (Tian et al., 2013). Jin et al. studied the sewage-sludge two-phase flow model using numerical simulation and concluded that after reducing the installation position of the submersible mixer, the flow velocity formed by the mixer at the bottom of the mixing pond increased and the sludge settling weakened. When the distance between the centre of rotation of the mixer impeller and the bottom wall of the pond was reduced to 0.4 m, there was no longer any obvious sludge deposition in the mixing pond (Jin and Zhang, 2014). Xu used computational fluid dynamics method to analyze the flow field characteristics and hydro-mechanical performances of submersible mixers. The results indicated that the performance of the mixer was greatly improved by optimally setting the motor speed, blade clearance, blade placement angle, installation angle and with or without guide shell (Xu, 2016). Additionally, Tian et al. studied the solid-liquid two-phase flow field of a submersible stirrer using a coupled CFD-DEM method and found that the location of particle aggregation was at the dead zone located at the junction of the vortex location and the wall of the pool, and that the vortex generated near the bottom and wall of the pool was an essential factor leading to particle aggregation (Tian et al., 2022b). These studies have demonstrated the impact of different installation locations on the flow field within the submersible mixer basin and have provided important insights into improving efficiency and mixing effectiveness. Nevertheless, conventional optimization methods require manual modification of design variables and the generation of multiple solutions for comparison, resulting in repetitive labor. Therefore, achieving automatic optimization of the submersible mixer installation location parameters without altering the overall pool structure is crucial.
With the rapid development of science and technology, the automatic optimization design of hydraulic machinery has become attainable through the utilization of high-performance platforms such as the ISIGHT software. Notably, numerous scholars have leveraged the ISIGHT platform for the analysis and study of hydraulic machinery’s optimal design. For instance, Wen et al. employed the ISIGHT software with integrated MATLAB, GAMBIT, and FLUENT software to propose a multi-objective and automatic optimization design method for the movable guide vane of a Francis turbine. They used the non-dominated ranking genetic algorithm with the geometric parameters of the movable guide vane as the optimization variables, the total pressure loss of the inlet and outlet of the guide vane flow path, and the cavitation performance as the objectives. The results indicated a 10.4% reduction in the total inlet and outlet pressure loss of the guide vane flow path and a 17.8% increase in the minimum static pressure on the guide vane (Wen et al., 2017). Subsequently, Wen et al. integrated GAMBIT and ANSYS FLUENT16.0 software based on ISIGHT software to propose an optimized design method for the crown profile of the runner of a low specific speed Francis turbine, which improved the turbine efficiency by 0.35% after optimization (Wen et al., 2018). Ding utilized the genetic optimization algorithm of the ISIGHT platform to optimize the turbine blade chord length with the mean and variance of the power coefficients at TSR = 4, 6, and 8 as the optimization objectives. The results demonstrated that increasing the chord lengths of the middle section and tip of the blade not only increased the power coefficient at the optimal tip speed ratio of the tidal energy turbine but also expanded the range of the optimal tip speed ratio, making it more applicable to engineering practice (Ding, 2020).
In addition, other studies have utilized the ISIGHT platform for optimizing designs of mixed-flow pumps, LB46 torque converter pump, and axial flow pump vanes. For example, Yang et al. utilized the NSGA-II algorithm and ISIGHT platform to optimize the design parameters of the worm housing section for a mixed-flow pump, resulting in a 3.02% increase in hydraulic efficiency and 2.81% increase in head. The high-efficiency zone of the pump was expanded (Yang et al., 2019). Fan utilized the multi-island genetic algorithm integrated into the ISIGHT platform to optimize the design of the LB46 torque converter pump wheel blades, resulting in an overall performance improvement in all cases (Fan, 2021). Similarly, He employed the ISIGHT platform combined with the NSGA-II optimization algorithm to perform a multi-objective optimization of the design parameters of the impeller and worm gear of the mixed-flow pump, resulting in improved hydraulic efficiency and head, and an expansion of the high-efficiency zone. The optimized pump also exhibited a more uniform and reasonable static pressure distribution, leading to reduced energy loss (He, 2019). Shi et al. e established an automatic optimization design platform for axial flow pump vanes based on the ISIGHT platform, which significantly improved the hydraulic performance of the vanes after optimization (Shi et al., 2014). Xia et al. designed an optimization platform for axial flow pump impellers using ISIGHT software and the multi-island genetic algorithm, resulting in improved hydraulic efficiency and an expanded efficient region after optimization (Xia et al., 2016). Lu et al. optimized the combination of impeller and guide vane of an ultra-high specific speed axial flow pump using the multi-island genetic algorithm integrated into the ISIGHT platform, resulting in improved efficiency of the design point, while the head remained almost unchanged (Lu et al., 2017). Wang integrated Pro/E, Gambit, and Fluent software into ISIGHT to develop a fully automated optimization method for centrifugal pump shaft surface projection diagrams based on CFD calculations, resulting in a 4.85% increase in optimized head and a 1.31% increase in hydraulic efficiency (Wang, 2011).
In the field of marine propeller design, recent studies have utilized the ISIGHT platform to establish optimization system and improve propeller performance. For example, Liu et al. applied ISIGHT software to integrate analysis modules, including type-value point calculation, model building, meshing, and simulation calculation, to analyze the effects of pitch, arch, longitudinal inclination, and chord length on propeller open water performance. The study revealed that pitch had the most significant impact on propeller open water performance, followed by chord length, arch, and longitudinal inclination. Furthermore, the quadratic and interactive terms between factors were found to have a more significant effect than longitudinal inclination (Liu et al., 2014). Similarly, Long et al. utilized the ISIGHT optimization platform to optimize the pitch distribution of a propeller, with the open water efficiency and minimum pressure coefficient at multiple radii as the objective function. The study found that optimizing propeller open water performance using a new anti-cavitation profile was effective (Long et al., 2011). Cheng et al. utilized the Design of Experiments method and optimization techniques combined with approximation methods based on the response surface model on the ISIGHT multidisciplinary optimization design platform to establish a new design engineering framework. The resulting optimization efforts led to improved propeller efficiency and minimum pressure coefficient (Cheng et al., 2008).
Overall, the ISIGHT platform has proven to be an effective tool for optimizing hydraulic machinery. It not only saves significant time and effort for designers, but also effectively enhances the performance of hydraulic machinery while reducing energy consumption. However, there is currently a lack of research on the application of the ISIGHT platform for optimizing submersible mixers. Therefore, the application of the ISIGHT platform holds great practical value for optimal design of submersible mixer installation locations.
This paper focuses on the submersible mixer for sewage and rectangular pool as the research objects, aiming to optimize the average flow velocity and mixing efficiency inside the pool. ISIGHT software is utilized as the optimization platform, which integrates Creo Parametric 6.0 software and ANSYS Workbench 2020 software. Analysis of influencing factors is performed using the design of experiment component packaged by ISIGHT. Multi-objective optimization design is accomplished through the non-inferiority ranking genetic algorithm in the optimization component packaged by ISIGHT. The ISIGHT software is employed to implement the automatic cyclic modeling and numerical analysis optimization process of submersible mixers, providing more efficient and intuitive ideas and methods to enhance the overall performance of submersible mixers.
This study refers to an actual submersible mixer model and an actual pool model from a sewage treatment plant. In numerical simulations, submersible mixer models are typically replaced with impellers for simplification purposes. The computational domain comprises the water body of the pool and the water body of the impeller, with the pool dimensions and submersible mixer installation positions illustrated in Figure 1. The diameter of the impeller is 210 mm. The number of blades is 2, and the rotation speed is 1400 rpm. The submersible mixer is installed at a position 2000 mm away from the pool’s side wall, 1000 mm above the pool’s bottom, and 500 mm away from the pool’s installation wall. Moreover, the length of the pool’s installation wall is 4000 mm, the pool’s depth is 2000 mm, and the adjacent pool wall’s length is 5000 mm. The impeller is parallel to the installation wall of the pool and perpendicular to the bottom wall of the pool.
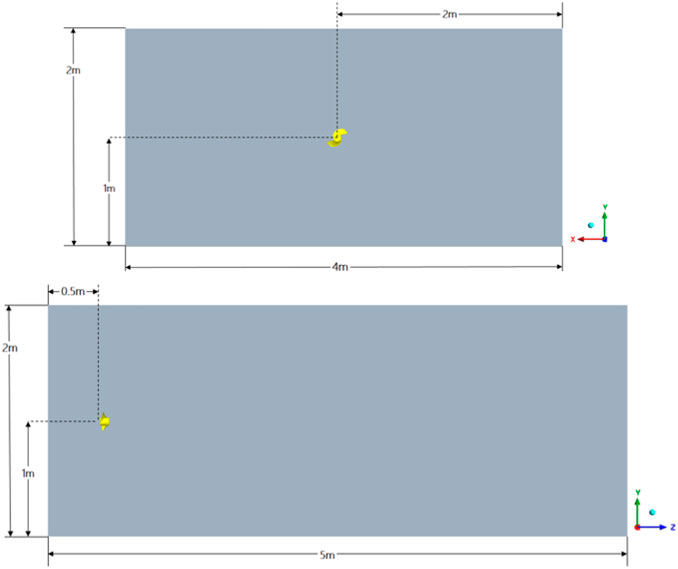
FIGURE 1. The pool and submersible mixer.
The Fluid Flow (Fluent) module within ANSYS Workbench 2020 software was utilized to generate polyhedral, unstructured meshes for the pool’s water body and impeller using the Mesh tool, as well as to encrypt the blade, the impeller and the pool contact surface. The simulation result of mesh independence verification is as Table 1. To validate mesh independence, the deviation of hydraulic thrust and torque values obtained from different mesh quantities can be compared with those of the actual model. When the number of grids was increased from 1,766,486 to 4,374,954, the hydraulic thrust decreased and subsequently increased and then decreased. The torque decreased and then increased and then decreased. Considering computational resources and accuracy, option 3 was chosen as the final mesh. In option 3, the simulated values of hydraulic thrust and torque exhibit minimal deviation from those of the actual model. The meshing of the submersible mixer and pool as shown in Figure 2. The mesh quality is above 0.3.
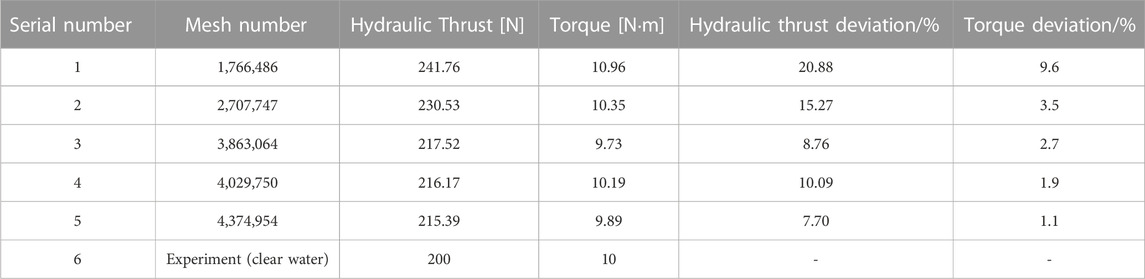
TABLE 1. Mesh independence verification.
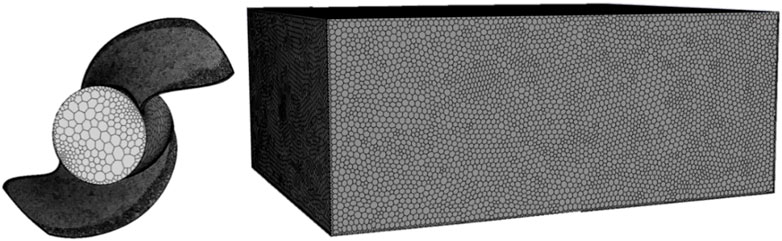
FIGURE 2. Meshing of submersible mixer and pool.
When the number of submersible mixers is small, it is common to adopt the multiple reference system method (MRF) for steady-state simulation, which is a widely used approach for simulating rotating machinery. Scalable Wall Functions are used near the wall and the free liquid surface of the pool is set to a rigid cover assumption with a residual convergence accuracy of 0.0001.
The continuity equation and momentum equation are represented by the following Equations 1 and Equations 2:
By using the Realizable
where
In this paper, we introduce an integrated platform for submersible mixer optimization design, which is built using the ISIGHT platform that integrates Creo Parametric 6.0 software and ANSYS Workbench 2020 software. The main objective is to maximize the average flow velocity and mixing efficiency inside the pool. The Task Plan component is employed to integrate the design of experiments module and parameter optimization module for global optimization design. Firstly, the design of experiments module is used to uniformly sample the design space, capturing the most effective design area in the entire space. Subsequently, the parameter optimization module is applied to optimize the design in the effective design area to obtain optimization results. Upon obtaining the optimization results, numerical simulation is performed to verify that the final optimization results meet the requirements. A flowchart for optimizing using the ISIGHT software is shown in Figure 3.
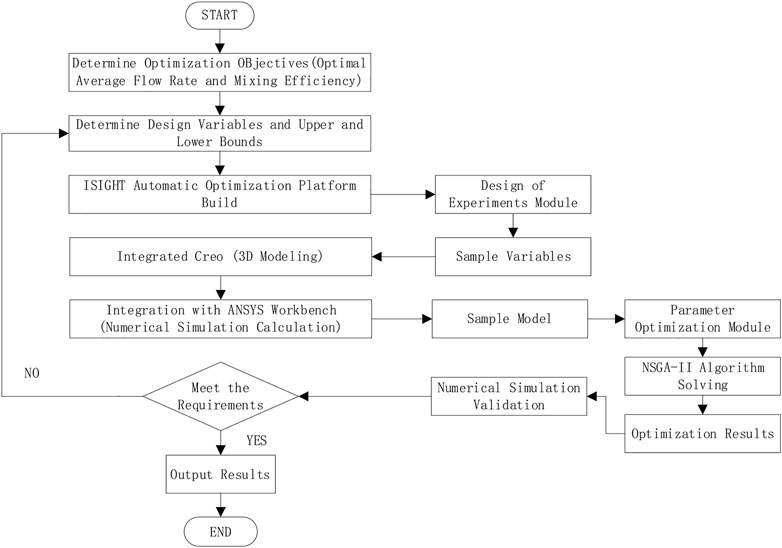
FIGURE 3. A flowchart for optimizing.
Parametric modeling is a crucial foundation for optimal design. In this study, a three-dimensional parametric model of the submersible mixer was built using Creo software. During the assembly of the pool and impeller water body, the installation position of the submersible mixer was constrained by the plane and XYZ coordinate system. The distance from the rotation center of the impeller of the submersible mixer to the side pool wall was defined as parameter A, the distance from the rotation center of the impeller of the submersible mixer to the bottom wall of the pool was parameter B, and the distance from the back of the submersible mixer to the installation wall was parameter C. The installation position parameters of the submersible mixer in the pool, i.e., A, B, and C, were selected as design variables in this study. An optimized design seeks an optimal solution that satisfies the objective function within the constraints of the design variables and constraints. Therefore, establishing the correct numerical model is essential to the success of the optimized design as a whole. The numerical model for optimization in this study can be summarized as follows: the parameters of the submersible mixer installation are optimized to satisfy the constraints of the range of design variables and the effective mean flow velocity inside the pool, and the point within the pool with the highest mean flow velocity and efficiency value is sought.
The three parameters A, B, and C were selected as the optimal design variables indicated in equation. The initial values and value ranges of these submersible mixer design variables are presented in Table 2.
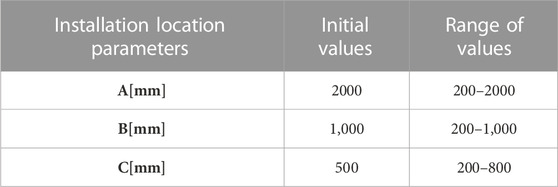
TABLE 2. Initial values and value ranges of design variables.
Where
The objective function in this study is to maximize both the average flow velocity and mixing efficiency in the pool, as shown in Equations and.
Where
The installation position of the best mixing effect is selected by selecting the maximum value of the average flow velocity inside the pool. This approach can directly reflect the mixing performance of the submersible mixer at different installation positions under the same impeller speed conditions. Thus, if a certain position of the submersible mixer in the pool results in the largest average flow velocity, it implies that the mixing effect is best at that position.
Tian et al. (Tian et al., 2012) derived the efficiency estimation formula(9), which has been demonstrated to be significant in assessing mixing efficiency using numerical simulation techniques.
Where:
Zhang et al. (Zhang et al., 2014) proposed the effective mixing domain evaluation method that involves calculating the volume of fluid with an average flow velocity greater than or equal to 0.1 m/s as the effective mixing volume of the submersible mixer. Therefore, the constraint in this study is that the average flow velocity inside the pool must be greater than or equal to 0.1 m/s, as shown in equation.
The ISIGHT platform can integrate and manage complex simulation processes and use optimization algorithms to explore for superior parameter combinations, thus shortening the product development time and reducing the development cost. In this study, we established an automated optimization platform for diving mixers by integrating Creo Parametric 6.0 software and ANSYS Workbench 2020 software, as illustrated in Figure 4. Throughout each cycle, the ISIGHT platform allows for the real-time presentation of design parameter inputs and performance parameter outputs, enabling designers to conveniently monitor progress.
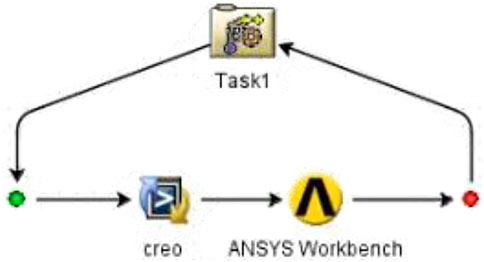
FIGURE 4. Integration of ISIGHT.
The Design of Experiments methodology can be used to rationalize experimental arrangements, especially in cases involving small-scale tests, resulting in reduced test durations and lower costs. In this study, the optimal Latin hypercube was used to sample the optimized variables, and the design and results of the experiment are presented in Table 3. The desired experimental outcomes were achieved, and scientifically valid conclusions were drawn. To ensure analytical accuracy, the number of test points
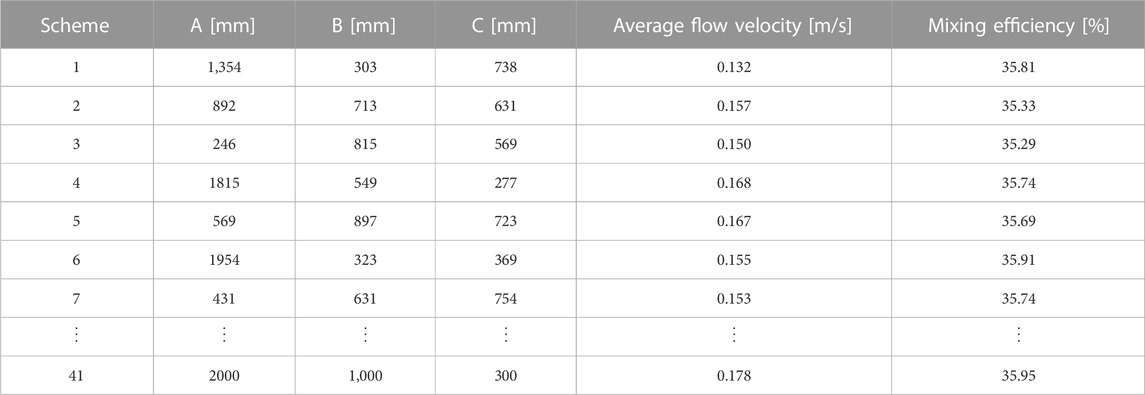
TABLE 3. Experiments design scheme and results.
Consequently, the number of sample points is set to 41 according to Eq. 10 above.
When there are multiple optimization objectives, due to the conflicts between the optimization objectives, sometimes one optimization objective is improved, while simultaneously another optimization objective is deteriorated, it is difficult to find a solution that furnishes all the objective functions optimal at the same time. Therefore, it is used to optimize the multi-objective problem by Non-Dominated Sorting Genetic Algorithm (NSGA-II) (Srinivas and Deb, 1994; Li, 2008). For multi-objective optimization problems, there is usually a set of solutions that cannot be compared between them with respect to the overall objective function. It is characterized by the fact that it is impossible to improve any objective function without weakening at least one other objective function.
NSGA-II optimization algorithm flow for:
a) In the first place, the population that randomly generates a certain number of individuals is regarded as the parent population.
b) During evolution, the current parent population is crossed and mutated to produce a subpopulation, and the parent population and subpopulation are combined to obtain a new population.
c) Comparing individuals in a new population two by two by their objective function vector using non-dominance sorting to divide all individuals in the population into multiple sequentially controlled Frontier layers.
d) Using crowding distance sorting, eliminate inferior individuals within layers with the same Pareto order.
e) In the case of individuals belonging to different Pareto layers, evaluate the superiority of individuals using the evaluation of Pareto superiority, thereby deriving the Pareto optimal set of solutions to the objective function.
The sensitivity, correlation, interaction effect, and contribution rate of the factors on the average flow velocity inside the submersible mixer pool were obtained through the Pareto graph, which further analyzed the effects of the factors on mixing performance.
The Pareto graph reflect the percentage contribution of all factors to average flow velocity, with blue bars indicating positive effects and red bars indicating negative effects. As shown in Figure 5, the primary term factor that is most sensitive to the average flow velocity is variable B, while variable C is the next most sensitive. The secondary term of variable A and the interaction term of variable B and variable C have a greater impact on the average flow velocity than the factor variable A. The secondary term of variable B and variable C, the interaction term of variable A and variable B between factors, and the interaction term of variable A and variable C between factors have less significant effects on the average flow velocity than the primary term factor of variable A. The effect of the primary term on the average flow velocity of the two factors of variable B and variable A is positive, indicating that increasing these two factors is beneficial to increasing the average flow velocity within the constraint range. However, the effect of the primary term of variable C on the mean velocity is negative, meaning that decreasing this factor is beneficial to increasing the average flow velocity within the constraint range.
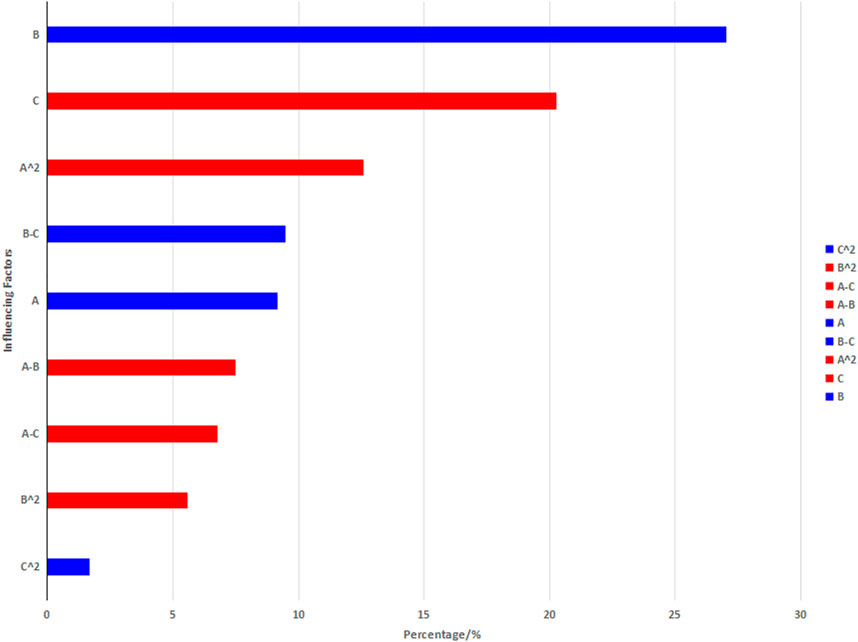
FIGURE 5. Pareto graph of the average flow velocity.
The global search method has been employed to obtain the Pareto Frontier solution for the genetic optimization of submersible mixer installation location parameters. The Pareto Frontier consists of a total of 241 solutions, represented by blue points. The optimal set of solutions, which take into account both the average flow velocity and mixing efficiency, are represented by the red points on the Frontier, as shown in Figure 6.
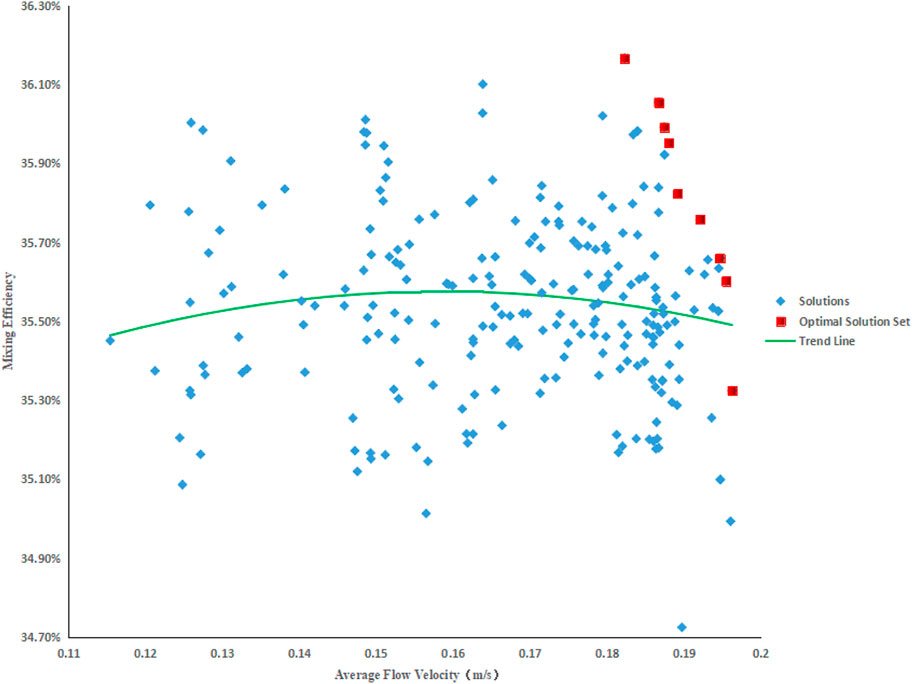
FIGURE 6. Pareto Frontier.
Prior to optimization, the average flow velocity within the pool was recorded at 0.161 m/s with a mixing efficiency of 35.70%. Following optimization, these values were improved to an average flow velocity of 0.182 m/s and a mixing efficiency of 36.17%. The observed increase in the average flow velocity was approximately 0.021 m/s, while the mixing efficiency was improved by approximately 0.47%, as compared to pre-optimization values. Table 4 provides detailed information regarding the submersible mixer installation position parameters and the corresponding mixing performance before and after optimization.
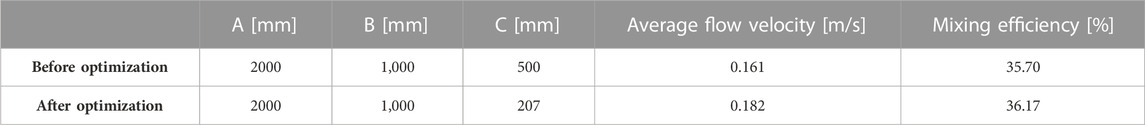
TABLE 4. Comparison of submersible mixer design parameters before and after optimization.
To verify the feasibility of the optimization method, we conducted flow field simulations using the same simulation method as the above simulations. The ZOX cross-section is parallel to the direction of the impeller rotation axis of the submersible mixer, and the XOY cross-section is perpendicular to the direction of the impeller rotation axis.
As shown in Figure 7, stirring the mixer generates a high-speed jet that pushes forward and then splits into two streams. One stream moves to the liquid surface and back to the impeller, forming a small circulating vortex, while the other stream pushes forward and collides with the pool wall, forming a large circulating vortex. The velocity contour of the ZOX cross-section shows the distribution of the z-axis velocity component in the pool. The red high-velocity zone in the contour indicates the areas where the velocity is the highest. Figure 7 demonstrates that the high-velocity zone increased in size after optimization, indicating that the optimization method was successful in increasing the mixing efficiency of the submersible mixer. The effective axial propulsion distance refers to the distance along the axial direction of the submersible mixer that effectively propels the water body under the condition that the flow velocity is maintained at or above 0.3 m/s (Tian et al., 2022a). This measure is important because it indicates how much of the pool is effectively mixed by the submersible mixer. Before optimization, the effective axial distance was 4.17 m, and after optimization, it increased to 4.45 m, representing a 6.71% increase in effective axial propulsion distance.
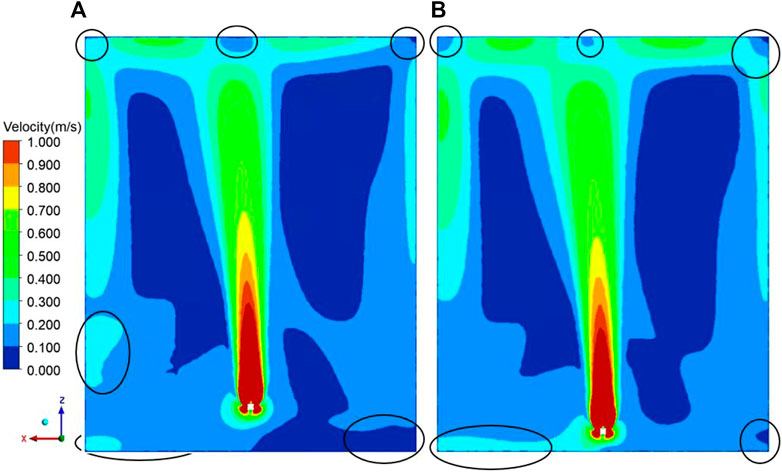
FIGURE 7. Velocity contour of ZOX cross-section: (A) Before optimization; (B) After optimization.
Additionally, the effective radial diffusion radius is the effective radius of perturbation of the water column section that is disturbed by the submersible mixer under the condition that the flow velocity is maintained at or above 0.3 m/s (Tian et al., 2022a). As shown in Figure 8, the velocity contour of the XOY cross-section demonstrated that the effective radial diffusion radius before optimization was 0.24 m, and after optimization, it increased to 0.26 m, representing a 8.33% increase in the effective radial diffusion radius.
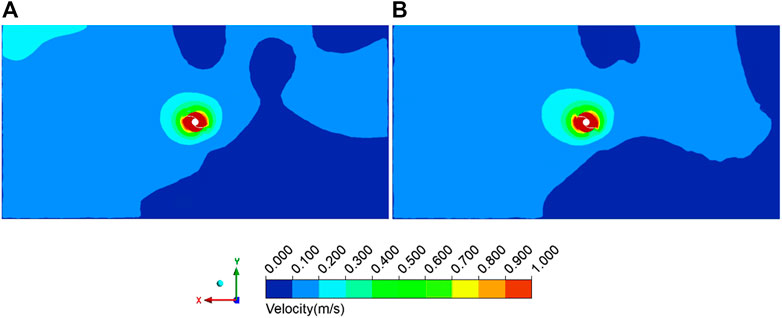
FIGURE 8. Velocity contour of XOY cross-section: (A) Before optimization; (B) After optimization.
For water velocities below 0.05 m/s in a certain area of the mixing pool, that area is defined as the low-velocity zone. Before optimization, the low-velocity zones were distributed at the edge junction and the top corner between the pool wall and the surrounding wall. The velocity of the circulation vortex flow was less than 0.05 m/s, and a large number of low-velocity zones appeared near the pool surface and the bottom wall surface of the pool close to the installation wall, as shown in Figure 9. The total volume of all low-velocity zones before optimization was 2949.93 dm3, accounting for 7.37% of the total water mass volume. After optimization, the low-velocity zones in the pool wall and the edge junction and top corner of the wall surrounded by the pool were significantly reduced. The low-velocity zones near the installation wall surface of the pool bottom and surface were also significantly reduced. After optimization, the total volume of all low-velocity zones was 2607.79 dm3, accounting for 6.52% of the total water mass volume. The low-velocity zones were significantly reduced after optimization compared to pre-optimization zones.
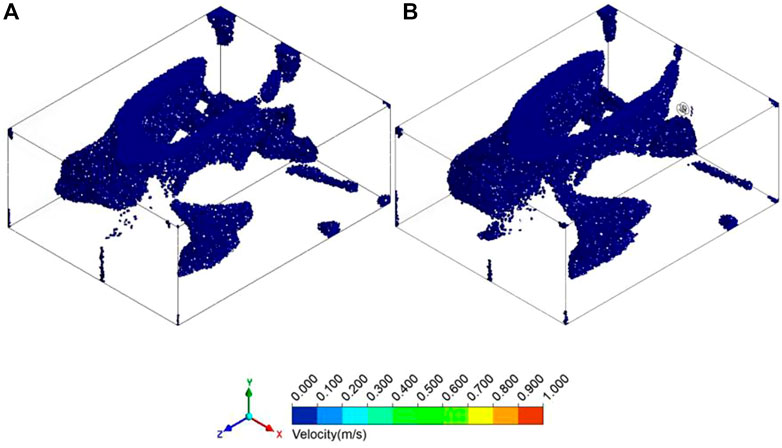
FIGURE 9. The distribution of mixing low-velocity zones: (A) Before optimization; (B) After optimization.
(1) After optimizing the installation position of the submersible mixer using the ISIGHT platform, the average flow velocity and mixing efficiency in the pool were significantly improved. The fluid distribution in the pool became more uniform, with a significant increase in the effective axial propulsion distance and effective radial diffusion radius. The low speed zone was greatly reduced, resulting in an enhanced flow state of the fluid in the pool and greatly strengthened mixing effect.
(2) These results demonstrate the potential of optimizing design to improve the performance of submersible mixers by taking into account factors such as the average flow velocity inside the pool, mixing efficiency, effective axial distance, effective radial diffusion radius, and low-velocity zone volume.
(3) Through the design of experiments study, it was discovered that an increase in the distance from the rotation center of the impeller of the submersible mixer to the side pool wall and the distance from the rotation center of the impeller of the submersible mixer to the bottom wall of the pool within the constraint range led to an increase in the average flow velocity, while a decrease in the distance from the back of the submersible mixer to the installation wall within the constraint range had a similar effect. These findings can provide valuable insights into improving the average flow velocity inside the pool through the control of the submersible mixer’s installation position. The use of the ISIGHT software for automatic optimization of submersible mixer installation locations can effectively improve mixing efficiency, overall plant operating efficiency, and economic benefits in sewage treatment plants. The multi-objective optimization platform based on the ISIGHT platform for installation location of submersible mixer for sewage can be successfully applied in engineering practice.
The original contribution presented in the study are included in the article/supplementary material, further inquiries can be directed to the corresponding author.
Conceptualization, FT; methodology, FT; software, EZ; formal analysis, CY; investigation, YC; data curation, CY; visualization, DS; writing—original draft preparation, CY; writing—review and editing, FT; supervision, WS. All authors have read and agreed to the published version of the manuscript.
Author YC was employed by Yatai Pump & Valve Co., Ltd.
The remaining authors declare that the research was conducted in the absence of any commercial or financial relationships that could be construed as a potential conflict of interest.
All claims expressed in this article are solely those of the authors and do not necessarily represent those of their affiliated organizations, or those of the publisher, the editors and the reviewers. Any product that may be evaluated in this article, or claim that may be made by its manufacturer, is not guaranteed or endorsed by the publisher.
Chen, Y. F., Yang, C., Zhang, H., Xu, Y. F., and Xia, C. Z. (2020). Influence and optimization of mixer's arrangement of flow field of anoxic pool. J. Drain. Irrig. Mach. Eng. 38, 1045–1050.
Cheng, C., Li, F., and Leng, W. H. (2008). Design and optimization of propeller based on doe methods and approximation loop methods. Comput. Appl. Softw. 25, 70–72.
Ding, L. (2020). Study on blade optimization and wavecurrent interaction of horizontal axis tidal turbines. Zhejiang University. Master.
Fan, W. L. (2021). Isight-based optimization design of hydrodynamic torque converter pump vanes. J. Chengdu Aeronaut. Voc. Tech. Coll. 37, 62–64.
He, S. (2019). Multi-objective optimization and cavitation characteristics of volute mixed-flow pump based on isight platform. Jiangsu University. Master.
Jin, J. H., and Zhang, H. W. (2014). A numerical simulation of submersible mixer in three-dimensional flow with sewage-sludge two-phase. Water Hydropower, 159–162. China Rural.
Li, L. (2008). Research on the application of multi-objective optimization strategy based on genetic algorithm. Wuxi, China: Jiangnan University. Master.
Liu, Y., Lu, J. G., Yang, M. C., Chen, X. F., Wang, M. L., and Zhao, R. S. (2014). Feasibility of metal-organic nanotubes [Cu3(μ3-O)(μ-OH)(triazolate)2]+-coated fibers for solid-phase microextraction of polychlorinated biphenyls in water samples. J. Nanjing Univ.Technol.(Nat. Sci. Ed.) 36, 58–65. doi:10.1016/j.chroma.2014.11.058
Liu, Y. Y., Wang, W. S., Lu, X. F., Lang, X. L., and Zhao, H. W. (2022). Energy consumption and energy-saving ways of mixing in sewage treatment process. China Environ. Prot. Ind., 35–38.
Long, W., Xie, W., Yang, X. H., and Qiu, L. Y. (2011). Multi-objective optimization of open water performance of propeller based on new anti-cavitation airfoil profile design. Ship Sci. Technol. 33, 56–60.
Lu, R., Yuan, J. P., Li, Y. J., and Jiang, H. Y. (2017). Automatic optimization of axial flow pump based on radialbasis functions neural network and cfd. J. Drain. Irrig. Mach. Eng. 35, 481–487.
Qiu, S. P. (2021). Research on application of submerged agitator in water treatment field. Shandong Water Resour., 23–25.
Shi, L. J., Tang, F. P., Li, S. L., Li, Z., and Xie, D. Z. (2014). Hydraulic performance optimization research based on the isight platform of axial flow pump blades. Fluid Mach. 42, 16–20.
Srinivas, N., and Deb, K. (1994). Muiltiobjective optimization using nondominated sorting in genetic algorithms. Evol. Comput. 2, 221–248. doi:10.1162/evco.1994.2.3.221
Tian, F., Shi, W. D., He, X. H., Jiang, H., and Xu, Y. H. (2013). “Study on installation of the submersible mixer,” in 6th international conference on pumps and fans with compressors and wind turbines, 52. Icpf2013.
Tian, F., Shi, W. D., Lu, X. N., Chen, B., and Xu, L. D. (2012). Theoretical calculation and simulation analysis of submersible mixer effciency for wastewater treatment. J. Agric. Eng. 28, 50–54.
Tian, F., Zhang, E. F., Yang, C., Shi, W. D., and Chen, Y. H. (2022). Research on the characteristics of the solid-liquid two-phase flow field of a submersible mixer based on cfd-dem. Energies 15, 6096. doi:10.3390/en15166096
Tian, F., Zhang, E. F., Yang, C., Shi, W. D., and Zhang, C. H. (2022). Review of numerical simulation research on submersible mixer for sewage. Front. Energy Res. 9. doi:10.3389/fenrg.2021.818211
Wang, K. (2011). Multi-conditions hydraulic design and optimization for centrifugal pumps and its application. Jiangsu University. Doctor.
Wen, Z. N., Ba, D. C., Deng, W. J., and Yue, X. J. (2017). Application of isight to optimization design of francis turbine guide vane. Mach. Des. Manu., 5–8.
Wen, Z. N., Zhang, Y. L., Ba, D. C., and Yue, X. J. (2018). Optimization method for the runner crown shape of a low specific speed francis turbine. J.Northeast Univ.(Nat. Sci.) 39, 839–843.
Xia, S. J., Yuan, J. P., Sun, X., Zhou, B. L., and Li, Y. J. (2016). Parametric modeling and multi-parameter optimization of axial-flow pump blade. J. Drain. Irrig. Mach. Eng. 34, 597–601.
Xu, S. (2016). Flow field analysis and operation optimization of submersible mixer. Yangzhou, China: yangzhou University. Master.
Xu, W. X., and Yuan, S. Q. (2011). Optimization design of submersible mixer based on a simulation study of agitated and engineering application. Water Hydropower, 32–35. China Rural.
Yan, J. H., Huang, D. J., and Teng, G. R. (2009). Research on rural domestic sewage disposal of biologic disposal high efficiency blender. J. Anhui Agric. Sci. 37, 9606–9607.
Yang, J. J., He, S., and Li, X. J. (2019). Multi-objective optimization design of volute mixed flow pump based on isight platform. Water Hydropower, 176–180. China Rural.
Keywords: submersible mixers, multi-objective optimization, numerical simulation, NSGA-II, ISIGHT platform
Citation: Tian F, Yang C, Zhang E, Sun D, Shi W and Chen Y (2023) A study on the multi-objective optimization method and characteristic analysis of installation locations of submersible mixer for sewage. Front. Energy Res. 11:1180607. doi: 10.3389/fenrg.2023.1180607
Received: 06 March 2023; Accepted: 03 April 2023;
Published: 05 July 2023.
Edited by:
Kan Kan, College of Energy and Electrical Engineering, ChinaReviewed by:
Qiang Gao, University of Minnesota Twin Cities, United StatesCopyright © 2023 Tian, Yang, Zhang, Sun, Shi and Chen. This is an open-access article distributed under the terms of the Creative Commons Attribution License (CC BY). The use, distribution or reproduction in other forums is permitted, provided the original author(s) and the copyright owner(s) are credited and that the original publication in this journal is cited, in accordance with accepted academic practice. No use, distribution or reproduction is permitted which does not comply with these terms.
*Correspondence: Chen Yang, MjIyMjEwNjAwMUBzdG1haWwudWpzLmVkdS5jbg==
Disclaimer: All claims expressed in this article are solely those of the authors and do not necessarily represent those of their affiliated organizations, or those of the publisher, the editors and the reviewers. Any product that may be evaluated in this article or claim that may be made by its manufacturer is not guaranteed or endorsed by the publisher.
Research integrity at Frontiers
Learn more about the work of our research integrity team to safeguard the quality of each article we publish.