 Lin Zhu
 Zilong Wu
 Shiyu Huang
- School of Electric Power Engineering, South China University of Technology, Guangzhou, China
In order to enhance self-monitoring and self-diagnosis capabilities in smart distribution networks, this paper proposes a method for assessing the health level of the network based on multivariate information. First, we construct an evaluation indicator system for the health of the smart distribution network by integrating the smart distribution network information system. Next, we utilize the improved back propagation (BP) neural network and multivariate indicator information to calculate the health indexes of both the grid layer and equipment. We then solve the health index of the equipment layer based on network topology and goal-oriented methodology. Furthermore, by utilizing the health information of both the equipment and grid layer, we apply fuzzy evaluation and Dempster-Shafer (D-S) evidence theory to obtain the health level of the distribution network. We provide a comprehensive evaluation of the overall health status of the smart distribution network. Finally, the proposed method is validated using data from a regional distribution network. The results demonstrate its effectiveness in improving the smart distribution networks’ overall health and stability by enabling more effective self-monitoring and self-diagnosis.
1 Introduction
The distribution network plays a crucial role in modern power systems, as it ensures that customers receive a reliable and high-quality power supply. With the integration of distributed energy, new requirements have emerged for the operation level of equipment, grid economy, and environmental sustainability (Trentini et al., 2021). This has also increased the demands on network planning, management, and maintenance (Gumpu et al., 2019). However, the distribution network operates in a complex environment, with many pieces of equipment and a complex grid, leading to a high frequency of failures. According to historical data, more than 85% of failures occur on the distribution network (Li et al., 2015). Therefore, a comprehensive and accurate evaluation of the distribution network’s health is essential to optimize its operation and enhance maintenance efficiency.
Most existing operational risk assessment methods for distribution networks are based on reliability theory, which uses equipment failure rate and outage time as indicators (Su et al., 2014; Chen et al., 2020). While useful, these approaches have certain limitations and more comprehensive and refined methods are required to evaluate the conditions of the distribution network. One such approach that has gained prominence is the concept of a power equipment health index. It was first proposed by British scholar D. Hughes in 2003 Hughes et al. (2008) and has been expanded to various fields, such as power supply reliability. It can characterize the equipment’s health status and overall performance (Ashkezari et al., 2013; Zhao et al., 2016).
The determination of the equipment health index relies on an indicator system. Researchers have considered real-time monitoring data such as the current, voltage, winding temperature, gas content of distribution transformers, and contact temperature of breakers (Khoddam et al., 2016; Yong-Xiang, 2019; Zhang et al., 2022). The equipment health index can be calculated with these data. However, it is essential to consider not only the current state of equipment but also its lifetime in general, as the health condition of transformers degrades over time (Sibuea and Suwarno, 2022). Moreover, different equipment may exhibit varying susceptibility to failure under similar conditions. Therefore, integrating data from various information systems, facilitated by advancements in smart grid and artificial intelligence technology, can lead to a more comprehensive indicator system. Establishing such a system makes it possible to develop a rational assessment method that quantitatively calculates the equipment health index.
In the field of smart distribution networks, assessing the health level of equipment and the overall network is essential for ensuring a reliable power supply to customers. A critical tool for this is the equipment health index, which can reflect the performance of individual components and the network. While much research has been done to determine the relationship between equipment health index and distribution network operation risk, some studies have not considered the equipment’s location (Zhao et al., 2016). To address this issue, researchers utilize Goal-Oriented (GO) methodology to analyze the outages caused by equipment failures at different locations in a distribution network containing distributed generators (DGs) (Gong et al., 2012). This allows for a more comprehensive understanding of the network’s performance and the potential impact of equipment failures on customers. In addition, fuzzy evaluation has been introduced to assess the health status of the equipment layer and grid layer (Sun et al., 2016). This approach recognizes health level assessment’s uncertain and imprecise nature and can provide a more nuanced understanding. By integrating these methods and approaches, it is possible to develop a more comprehensive and accurate assessment of smart distribution network health.
Furthermore, with the increasing emphasis on the economy and environmental sustainability of distribution networks, traditional methods that only consider reliability are no longer sufficient. To address this, researchers have attempted to integrate smart grid information technology into assessing distribution network health. For instance (Sun et al., 2022), integrated the grid and equipment health indexes to evaluate the health level of distribution networks. However, this approach may lose some key information that is critical to accurately reflecting changes in the health status of equipment or grid.
Therefore, to achieve a more accurate assessment of the health status of a smart distribution network, a comprehensive approach is needed that integrates both short-term and long-term equipment indicators, as well as the overall reliability, economy, and environmental sustainability of the grid. However, directly combining the equipment and grid health indexes may not be appropriate. Meanwhile, the location of the equipment in the network topology affects the outage range, and there are significant differences in the indicators’ meaning and the optimal values range. Thus, a novel method is required to effectively integrate the above multiple sources of heterogeneous information and accurately reflect changes in the health conditions of equipment and the grid.
The main contributions of this paper are as follows:
1. The paper proposes a more comprehensive health assessment indicator system for smart distribution networks, which considers multiple aspects such as real-time equipment monitoring data, equipment ledger data, and grid economics level. By integrating these different sources of information, a more accurate and comprehensive picture of the health of the distribution network can be obtained.
2. To integrate multiple indicator information with different meanings and optimal ranges, an improved BP neural network is proposed to calculate the health index of the grid layer and individual equipment. It provides a more nuanced understanding of the health status of the distribution network.
3. The paper analyzes the impact of equipment failure on load outage by combining network topology with the goal-oriented methodology. The relationship between the health of individual equipment and the power supply probability of the overall load in a distribution network containing distributed generations is also analyzed, providing essential insights into the network’s overall performance.
4. Fuzzy evaluation is introduced to evaluate the health level of the equipment and grid layers. The information from both layers is fused by D-S evidence theory to assess the distribution network health level based on multiple information. This approach considers the uncertainty and imprecision of health level assessment and provides a more accurate and comprehensive assessment of the health status of the distribution network.
The rest of the paper is structured as follows: Section 2 presents the proposed indicator system for the health assessment of smart distribution networks. Section 3 constructs a comprehensive health index calculation method for the equipment and grid layers. Section 4 assesses the distribution network health level by combining the equipment layer health index and grid layer health index. Section 5 validates the proposed assessment method through case study, demonstrating its effectiveness in accurately reflecting the changes in equipment and grid health conditions. Finally, in Section 6, we draw conclusions and suggest potential areas for future research.
2 Indicator system for smart distribution network health assessment
In order to ensure an accurate assessment of a smart distribution network’s health, it is crucial to gather and combine information at both the equipment and grid levels. In this paper, a hierarchical indicator system for health assessment is constructed. The indicator system divides the health indicators of a smart distribution network in terms of power equipment and grid, respectively.
The determination of power equipment health indexes is considered from two different points. It is necessary to consider the condition of the equipment from both a short-term and long-term perspective. In terms of equipment operation status, the real-time monitoring data can reflect the short-term health condition of the power equipment. In contrast, information such as equipment ledger can reflect the health condition from a long-term perspective. According to the above two perspectives, 11 indicators are selected as the indicator system to calculate the health indexes for power equipment, as shown in Table 1 below.
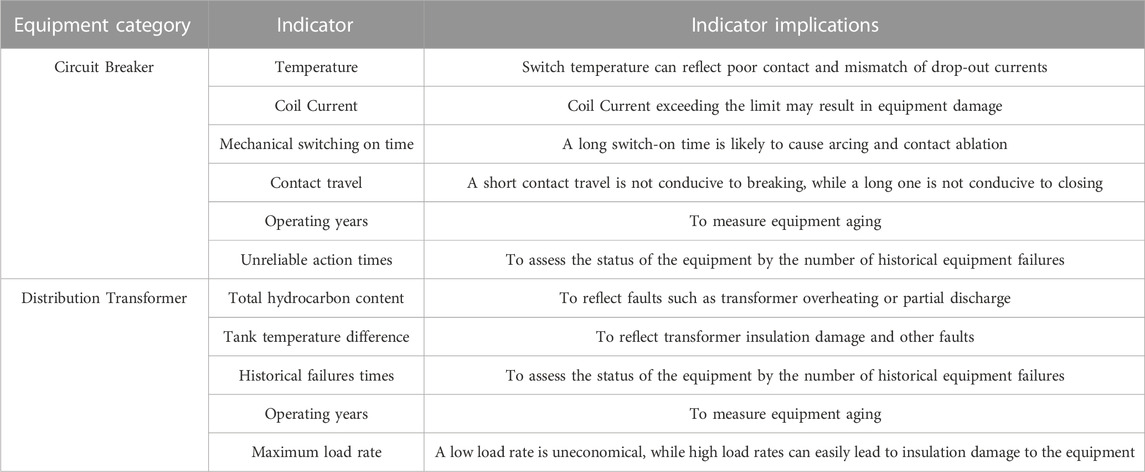
TABLE 1. Equipment health assessment indicators.
It is not easy to fully reflect the overall health level of the smart distribution network by only assessing the health of the equipment. There is also a demand to take the grid health status into the assessment system to evaluate whether non-faulty grid need to be upgraded and renovated. By considering the indicators closely related to the health level of the smart distribution network, the health assessment indicator system of the network is constructed from 4 dimensions: grid operation level, grid economic efficiency level, grid security level, and grid environmental sustainability level, as shown in Table 2. It is worth mentioning that as a business, economic efficiency is of great importance to power companies. If the distribution network does not meet economic requirements, it may lead to a decline in profits, then it is necessary to upgrade and renovate the distribution network to ensure that it is in a better state. Therefore, this article comprehensively selects economic efficiency indicators to calculate the health index of the distribution network.

TABLE 2. Grid health evaluation indicators.
3 The health indexes calculation of the equipment layer and grid layer
Since the indicators are functionally related to the health index, this paper proposes the BP neural network. BP neural network, well-suited for approximating complex nonlinear relationships, has strong robustness and fault tolerance. Additionally, it can provide fast output results without requiring human involvement after model training. Thus, it can be utilized to calculate the health index of power equipment and the grid.
The above equipment and grid information is mainly stored in the smart distribution network information system, such as the ledger management system, equipment status online monitoring system, voltage monitoring system, operation monitoring system, and grid planning assistance system. Moreover, due to differences in the meaning and optimal intervals of indicators, it is not appropriate to preprocess the data directly using traditional data normalization methods. Therefore, the BP neural network is improved in this paper to extract multivariate heterogeneous indicators effectively.
3.1 Health indexes calculation of grid layer and single power equipment based on improved BP neural network
Grid indicators have their respective optimal value ranges. In addition, the indicator values of the equipment will gradually deteriorate from the ideal value to the warning value of the fault state when the health status decreases. Therefore, the problem of heterogeneity of multivariate information can be solved by uniformly evaluating indicators accordingly. For this purpose, in this paper, the input layer neurons of the traditional BP neural network are replaced by indicator-scoring neurons. The improved BP neural network is constructed for the circuit breaker, distribution transformer, and grid, respectively, as shown in Figure 1 below.
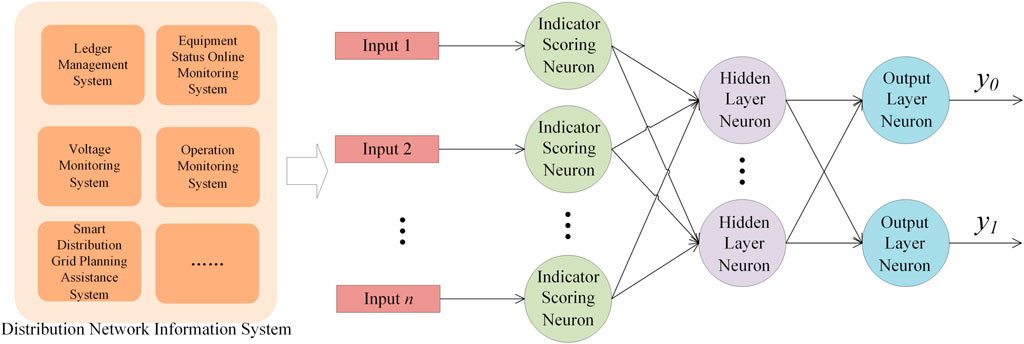
FIGURE 1. Improved BP neural network and its input diagram.
Based on the relationship between indicator values and health status, the following three types of indicator-scoring neurons are proposed: 1) Higher indicator values indicate better health status using inverse type indicator-scoring neuron, whose output function is E1(x); 2) intermediate-range indicator values indicate better health status uses an intermediate type indicator-scoring neuron with the output function E2(x); 3) lower indicator values indicate better health status using positive type indicator-scoring neuron, whose output function is E3(x). The specific output functions of each indicator-scoring neuron type are shown below.
where
The indicator-scoring neuron types, preset ideal, and alarm values for each indicator can be determined using equipment manuals, existing planning standards, and expert opinions. Tables 3, 4 showcase the indicator-scoring neuron types and corresponding thresholds employed in this paper for the power equipment and grid indicators, respectively.
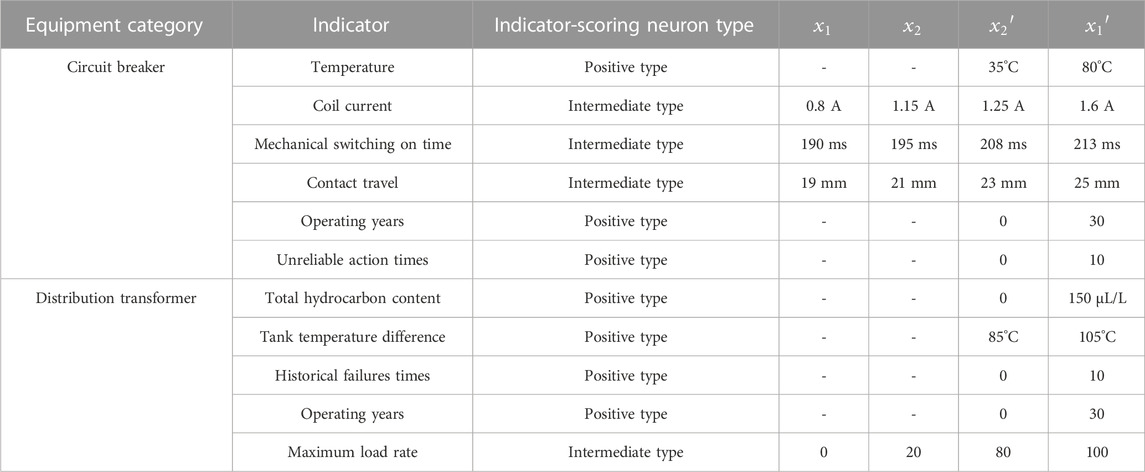
TABLE 3. Equipment health indicator-scoring neuron type, preset ideal value, and alarm value.
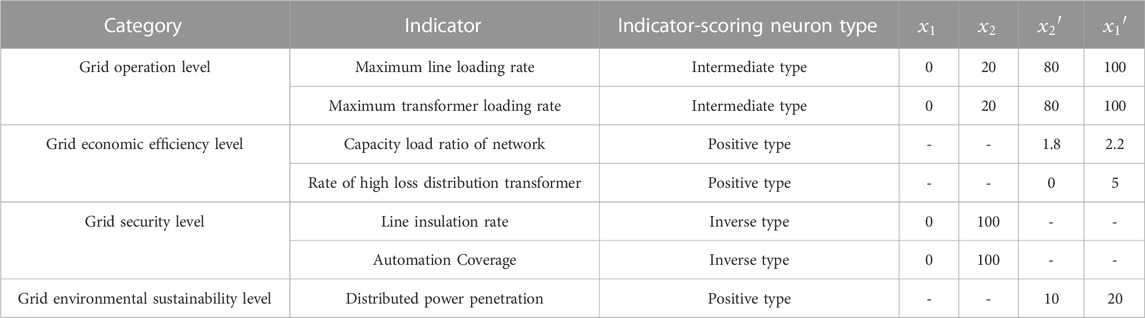
TABLE 4. Grid health indicator-scoring neuron type, preset ideal value, and alarm value.
In addition, the output fnctions of the neurons in the hidden layer and the output layer, respectively, are
where
The loss function employed in this study is cross-entropy. It is defined mathematically as follows:
In order to effectively balance the step size and momentum to optimize the weight vector of the neural network, here we adopt the adaptive moment estimation (Adam) algorithm. It dynamically adjusts the learning rate in the training process and accelerates convergence toward the optimal solution in the early stage while preventing oscillations caused by high learning rates later.
The training set input for the neural network model includes historical data of circuit breakers, distribution transformers, etc., comprising normal and failure data samples. The sample labels [y0,y1] with outage faults are set to [0,1], and the sample labels for normal operation are set to [1,0]. The neural network model is trained using this dataset. The model training is completed when the output error meets the requirement, or the number of iterations is reached.
3.2 Equipment layer health index calculation based on GO methodology
The range of equipment outages depends on the equipment’s location in the network topology. Therefore, it is not appropriate to add up the health of individual equipment to evaluate the overall health index of the power equipment layer. It is necessary to consider the network topology information comprehensively. At present, GO methodology is able to find the relationship between equipment failure and load outage based on the network topology. Thus, this paper seeks the relationship between single power equipment health index and equipment layer health index based on GO methodology.
The following distribution network in Figure 2 is used to illustrate the methodological steps for obtaining the health index of the equipment layer using the Goal-Oriented (GO) methodology. This approach involves analyzing the impact of equipment failure on load outage by combining network topology with goal-oriented techniques. It provides a more nuanced understanding of the health status of the distribution network, allowing for a more comprehensive and accurate assessment.
(1) Referring to (Shi et al., 2018), the relationship between the level of equipment health and the probability of successful operation of the equipment is
(2) When only a single-side power supply exists at L1, the normal power supply of P3 is equivalent to the successful operation of CB1, S1 and T3, which is shown in the following equation:
where
(3) When feeder 1 and feeder 2 are available, the power supply of P3 is equivalent to the successful operation of CB1, S1 and T3 or CB2, S2 and T3, which is shown in the following equation:
where
(4) To calculate the probability of successful operation of other loads, we can obtain the probability of successful operation of all loads by using the proportion of each load and its corresponding probability of successful operation, as shown in the following equation:
where P is the probability of successful operation of all loads,
(5) Subsequently, based on the overall probability of successful load operation, the inverse function of Eq. 7 is applied to determine the health index of the power equipment layer, which can be expressed as the following equation:
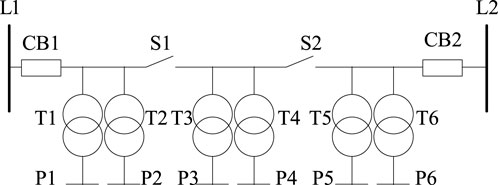
FIGURE 2. The network topology with dual power sources.
4 Distribution network health level assessment
The assessment of health status levels is commonly accomplished through the use of health index. However, the transition process between different health levels is often unclear, making the concept of fuzzy sets from fuzzy mathematics particularly relevant. Consequently, applying fuzzy mathematical theory and membership functions to assess health levels is appropriate. The core concept of the fuzzy theory is the fuzzy set, which allows for the inclusion of elements with different degrees of belonging. The membership function is the key tool used to describe the degree to which an object belongs to a fuzzy set. It maps each object to a real number between 0 and 1, representing the object’s degree of membership in the set. When the value is closer to 1, the object belongs more strongly to the set, while a value closer to 0 indicates a weaker membership. Referring to the literature (Sun et al., 2016), health status can be classified into four levels: “Excellent,” “good,” “moderate,” and “bad.” Eqs 12–15; Figure 3 depict the membership function of the health level.
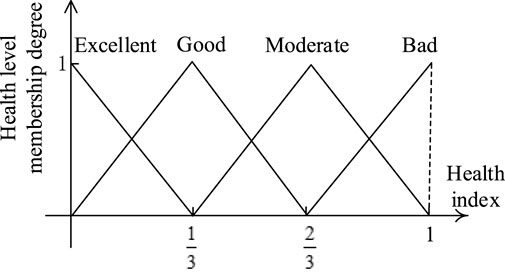
FIGURE 3. Membership function of health level.
Where H is the health index,
The vector representing health levels is defined as:
When the health index changes gradually within the range of [0,1], the corresponding health level vector also changes gradually, reflecting a more nuanced and accurate evaluation of the health status. The vector ranges from “excellent” to “bad”, allowing for a more accurate assessment of the health level.
The health levels of equipment and the grid layers obtained through the methods above can provide a valuable perspective on distribution network health by integrating various indicator information and network topology. However, relying on either of these levels alone may not provide a complete and accurate assessment of the overall distribution network’s health. Instead, they provide fuzzy criteria and independent sources of uncertainty evidence for distribution network health status. In order to obtain a more comprehensive and accurate distribution network health level, uncertainty inference and information fusion techniques can be applied based on the information provided by both the equipment and grid layer health levels.
D-S evidence theory can handle uncertain information, enabling the fusion of information among multiple bodies of evidence, which has also been used in information fusion in the electrical field (Shafer, 1978; Li et al., 2015). In this paper, we introduce an improved D-S evidence theory to establish an information fusion model for the health level of the equipment layer and the grid layer to assess the overall health level of the distribution network comprehensively.
In this paper, an enhanced D-S evidence theory is proposed to develop an information fusion model for the health level of both equipment and grid layers, thereby achieving a comprehensive evaluation of the overall health level of the distribution network. The implementation process of the improved D-S evidence theory is outlined below.
Assume that
Then the function
In
The function
This vector reflects the level of the distribution network in terms of “Excellent,” “Good,” “Moderate,” and “Bad” by integrating multiple information such as equipment indicators, grid indicators, and network topology through D-S theory. It realizes a comprehensive assessment of the smart distribution network’s health level, which enables self-monitoring and self-diagnosis of the smart distribution network.
5 Study cases
A 10 kV distribution network is selected for calculation example analysis, with its network topology shown in Figure 4. The network comprises 3 circuit breakers and 17 distribution transformers and is connected to two distributed power sources.
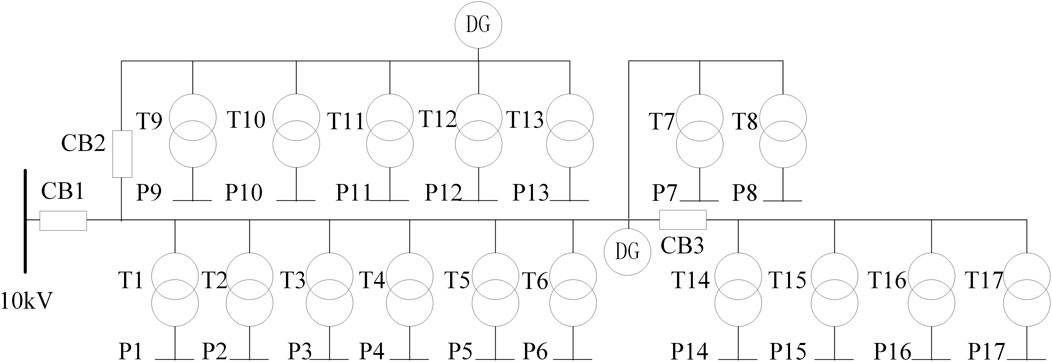
FIGURE 4. Topology diagram of 10 kV distribution network.
The historical data of this distribution network is exported from the network information system to train the improved BP neural network model. 562 sets of transformer historical data, 378 sets of circuit breaker data, and 124 sets of grid data are divided into training sets, and testing sets at a ratio of 8:2, respectively. The parameters of the model are set, as shown in Table 5.
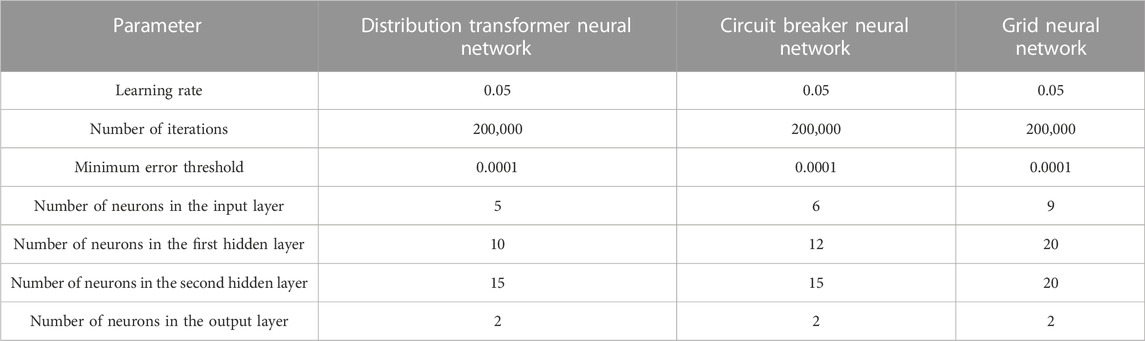
TABLE 5. Neural network parameter setting.
Take the distribution transformer neural network model as an example to illustrate the model training process. The change between the loss function and the number of iterations in the model training process is shown in Figure 5.
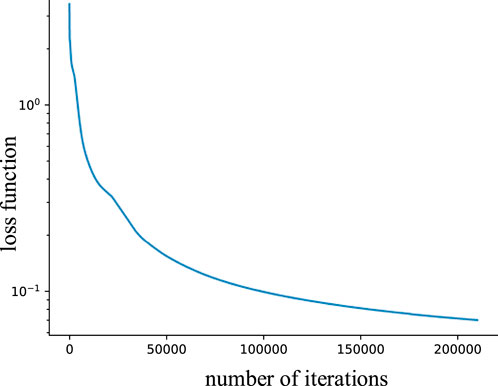
FIGURE 5. Training loss curve.
It can be seen that the model has good stability and convergence in the training process, and the training loss tends to be stable when the iteration reaches 200,000 times.
The higher the health level of the device, the more likely it is to have equipment failure. When a health index threshold is set, any equipment with a health index surpassing this threshold is considered at risk for failure. On the contrary, those below the threshold are deemed to be functioning normally. In this paper, the threshold is trained as 0.75. Comparing this criterion with the actual failure status of the equipment in the test set, we obtain a confusion matrix, as shown in Table 6.
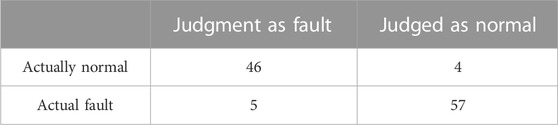
TABLE 6. Confusion matrix.
As seen from Table 6, the accuracy of this judgment method reaches 91.96%, which means that the health index of the equipment evaluated by the model can accurately and effectively reflect the failure potential of the equipment.
Afterward, the real-time values of the grid indicators are obtained from the operation and information system, as shown in Table 7.
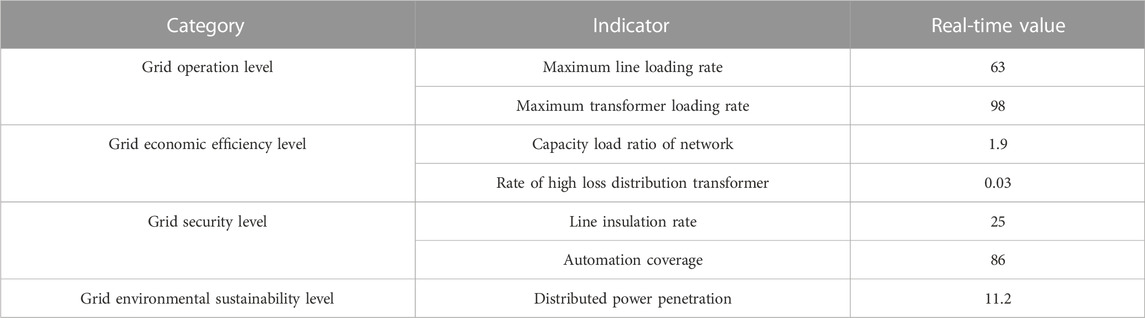
TABLE 7. Real-time value of grid indicators.
The grid health neural network model calculates the grid health index as 0.235647.
Taking the T5 transformer as an example, the corresponding indicator values of the indicators are extracted from the smart grid information system, as shown in Table 8.
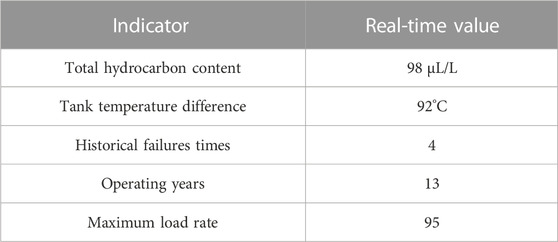
TABLE 8. Real-time value of distribution transformer indicators.
The health index of this distribution transformer is 0.506836 obtained by the distribution transformer health neural network model. The equipments models and equipments health indexes are shown in Table 9 and Figure 6.
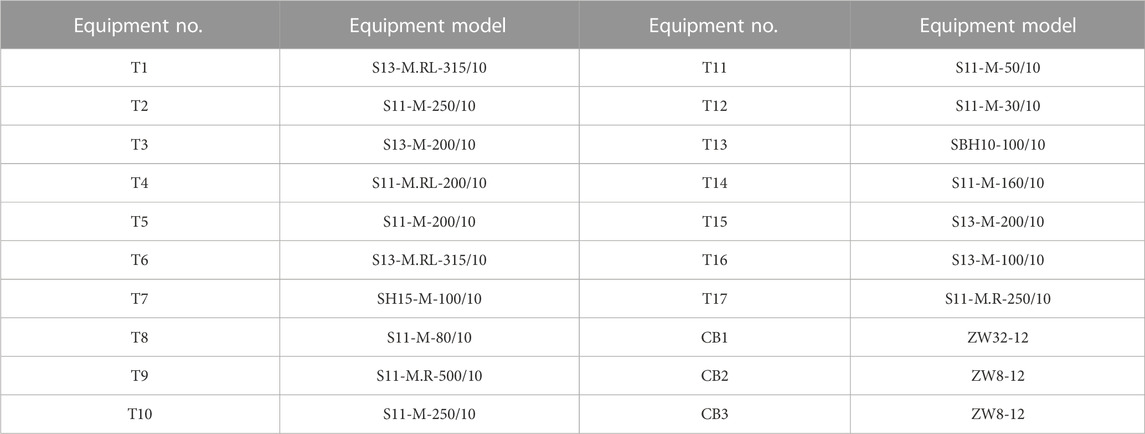
TABLE 9. Equipments models.

FIGURE 6. Health index of each equipment.
It can be observed from Figure 6 that T13, T5, and CB3 have a higher health index, indicating that they do not have any abnormalities, but in poor health. This enables the smart grid to perform self-diagnosis based on equipment self-monitoring. The health index of the device layer obtained by the method in this paper is 0.363,152. According to the membership function, the mass functions of the equipment and grid layers are obtained, as shown in the following table.
Table 10 presents the classification of equipment layer health level, which predominantly falls under the “Good” category. Meanwhile, the grid layer health level ranges from “Good” to “Moderate”, with a majority being classified as “Good”. This highlights the efficacy of utilizing fuzzy evaluation in accurately reflecting the differences in health level, in contrast to employing health index interval segmentation. By integrating the fuzzy criteria derived from both the equipment and grid layers’ health index, the health level of the distribution network can be determined using an improved D-S evidence theory model for uncertainty inference and information fusion, as demonstrated in Table 11.
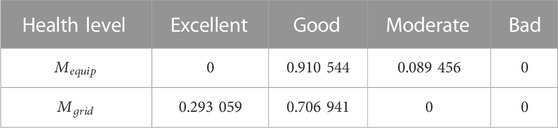
TABLE 10. Mass functions of equipment layer and grid layer.

TABLE 11. Assessment of distribution network health level.
The distribution network health level vector
The distribution network’s health level can be enhanced by implementing various improvement options, such as repairing or replacing equipment and improving the grid condition. For example, this paper considers three options: repairing CB3, replacing CB3, and increasing the distributed power penetration rate from 11.2% to 13.2%. After implementing the first two schemes, the equipment layer’s health index decreases from 0.363152 to 0.303145 and 0.301278, respectively, while the grid health index remains unchanged. After implementing the third scheme, the grid health index decreases from 0.235647 to 0.187692, and the equipment layer’s health index remains unchanged. Using the method proposed in this paper, the distribution network’s health level is calculated after the implementation of each scheme and presented in Table 12.
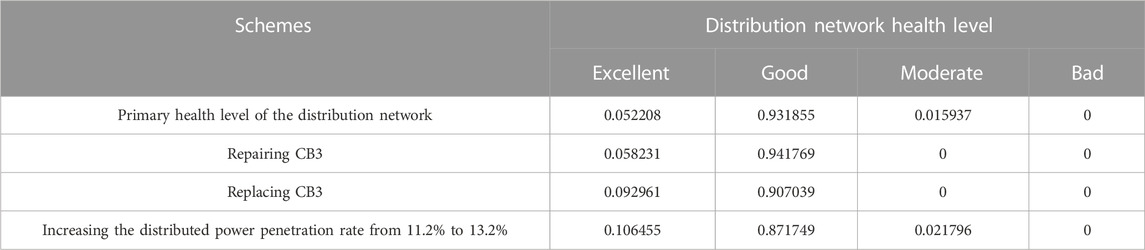
TABLE 12. Comparison of the effects of different schemes.
As shown in Table 12, after the implementation of the three options, the degree of the distribution network health belonging to the “Excellent” level has increased, and the abnormal state of the network can be eliminated when CB3 is repaired. Increasing the penetration rate of distributed power can improve the health level of the network through the grid layer but cannot eliminate the abnormalities caused by the equipment layer. It can be seen that an accurate evaluation of the health level of the distribution network has been achieved through the proposed method.
From a long and short-term perspective, the indicator system constructed in this paper can better reflect the impact of different schemes on the health of the distribution network. If the indicators related to long-term statistical information of equipment are not considered, repairing or replacing CB3 can result in the monitoring data returning to an optimal state. In this case, after implementing both schemes, the neural network inputs are completely identical, leading to the same health index, thus failing to reflect the differences between the two schemes.
In contrast to the interval partitioning method, our proposed approach in this paper offers a more precise and comprehensive evaluation of the health status of the distribution network. For instance, a previous study (Sun et al., 2022) uses four equally sized intervals to represent four distinct health levels. In cases where the health levels of the equipment and the grid layers do not match, the lower of the two levels is deemed as the health level of the distribution network. However, this method fails to reflect the effectiveness of different improvement schemes, particularly when the health levels of the two layers are inconsistent. When applied to our health index results, this approach fails to differentiate the benefits of our three proposed schemes. Interestingly, we found that the health levels of the equipment layer were all classified as “Good” and the health levels of the grid layer were rated as “Excellent” before and after implementing the three schemes. The health levels of the distribution network after the original state, repairing CB3, replacing CB3, and increasing the distributed power penetration rate from 11.2% to 13.2% are 0.363152, 0.303145, 0.301,278, and 0.363152, respectively, and the health levels are all “Good”. It can be seen that the ratings method used by SUN et al. (2022) fails to accurately capture the differences in the effectiveness of the schemes. To better illustrate the changes in the risk level of the distribution network after implementing different schemes, we provide a comparative analysis in Figure 7.
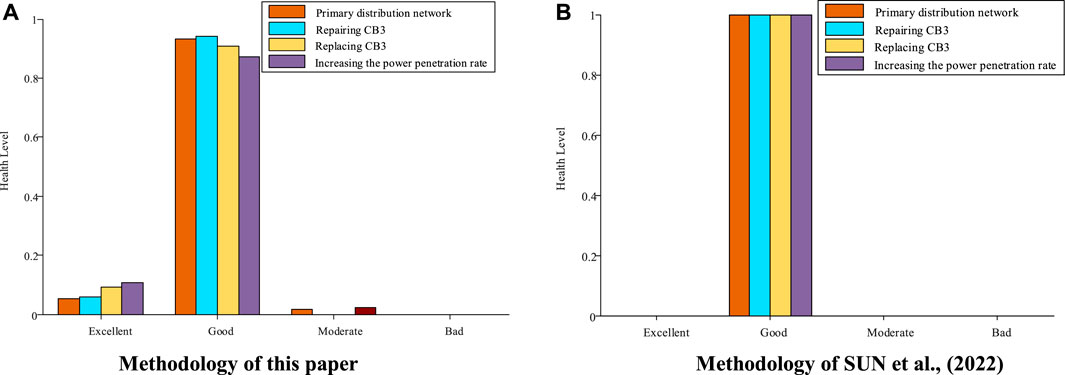
FIGURE 7. Comparison of different schemes. (A) Methodology of this paper (B) Methodology of SUN et al. (2022).
The method presented in this paper allows smart grids to achieve more accurate self-diagnosis than other methods. This method provides practical guidance for further self-healing of the smart grid, helping staff propose and evaluate maintenance and planning plans. In this way, the method effectively reduces the fault risk of the smart distribution network and improves the reliability of the power supply.
6 Conclusion
This paper proposes a novel approach to evaluate the health level of smart distribution networks based on multivariate information. Specifically, we construct a comprehensive indicator system to assess the health of both equipment and grid layers. We adopt an improved neural network model to achieve a precise and comprehensive quantitative evaluation of the individual health status of equipment and grid based on multiple indicators. Furthermore, we utilize the GO methodology to determine the likelihood of all loads operating normally by integrating the single equipment health index with the network topology, which allows us to obtain the health index of the equipment layer. Based on the health index of both equipment and grid layers, we employ fuzzy theory and D-S evidence theory to present a method for self-diagnosing the health status of smart distribution networks by evaluating the health level.
The findings of this study can provide valuable theoretical guidance for the self-healing, operation, and planning of smart distribution networks. Our proposed approach can be of great practical significance for maintaining the reliability and stability of power systems.
Data availability statement
The raw data supporting the conclusion of this article will be made available by the authors, without undue reservation.
Author contributions
LZ: Formulation of overarching research goals and design of methodology ZW: performing the data analysis SH: Creation of the published work. All authors contributed to the article and approved the submitted version.
Funding
This work is supported by Guangdong Provincial Key Laboratory of Intelligent Operation and Control for New Energy Power System (No. GPKLIOCNEPS-2021-KF-01).
Conflict of interest
The authors declare that the research was conducted in the absence of any commercial or financial relationships that could be construed as a potential conflict of interest.
Publisher’s note
All claims expressed in this article are solely those of the authors and do not necessarily represent those of their affiliated organizations, or those of the publisher, the editors and the reviewers. Any product that may be evaluated in this article, or claim that may be made by its manufacturer, is not guaranteed or endorsed by the publisher.
References
Ashkezari, A. D., Ma, H., Saha, T. K., and Ekanayake, C. (2013). Application of fuzzy support vector machine for determining the health index of the insulation system of in-service power transformers. IEEE Trans. Dielectr. Electr. insulation 20 (3), 965–973. doi:10.1109/tdei.2013.6518966
Chen, L., Liu, L., Peng, Y., Chen, W., Huang, H., Wu, T., et al. (2020). Distribution network operational risk assessment and early warning considering multi-risk factors. IET Generation, Transm. Distribution 14 (16), 3139–3149. doi:10.1049/iet-gtd.2019.1198
Gong, J., Huang, M., and Sun, F. (2012). Reliability assessment based on GO methodology for the distribution system including distributed generation. Power Syst. Prot. Control 40, 90–100. doi:10.3969/j.issn.1674-3415.2012.16.015
Gumpu, S., Pamulaparthy, B., and Sharma, A. (2019). Review of congestion management methods from conventional to smart grid scenario. Int. J. Emerg. Electr. Power Syst. 20. doi:10.1515/ijeeps-2018-0265
Hughes, D., Pears, T., and Tian, Y. (2008). “Linking engineering knowledge and practical experience to investment planning by means of condition based risk management,” in 2008 International Conference on Condition Monitoring and Diagnosis, Beijing, 21-24 April 2008, 539–542.
Khoddam, M., Sadeh, J., and Pourmohamadiyan, P. (2016). Performance evaluation of circuit breaker electrical contact based on dynamic resistance signature and using health index. IEEE Trans. Components, Packag. Manuf. Technol. 6 (10), 1505–1512. doi:10.1109/tcpmt.2016.2601316
Li, L., Liu, J., Ling, Y., Zhou, X., and Zhang, Y. (2015). Power quality comprehensive evaluation based on matter-element theory and evidence theory. Trans. China Electrotech. Soc. 30, 383–391. doi:10.3969/j.issn.1000-6753.2015.12.048
Shi, C., Ning, X., Sun, Z., Kang, C., Du, Y., and Guoming, M. (2018). Quantitative risk ssessment of distribution network based on real-time health index of equipment. High. Volt. Eng. 44 (2), 534–540. doi:10.13336/j.1003-6520.hve.20171107001
Sibuea, E. B., and Suwarno, (2022). “Correlation of oil dielectric characteristics, dissolved gases, and operating life to insulation paper degradation of 150 kV power transformers,” in 2022 International Seminar on Intelligent Technology and Its Applications (ISITIA), Surabaya, July 20-21, 2022 (IEEE), 360–364.
Su, H., Jiang, X., and Liang, Z. (2014). Distribution network operation risk assessment considering various influencing factors. Electr. Meas. Instrum. 51 (6), 38–42. doi:10.3969/j.issn.1001-1390.2014.06.008
Sun, L., Ma, Z., Shang, Y., Liu, Y., Yuan, H., and Wu, G. (2016). Research on multi-attribute decision-making in condition evaluation for power transformer using fuzzy AHP and modified weighted averaging combination. IET Generation, Transm. Distribution 10 (15), 3855–3864. doi:10.1049/iet-gtd.2016.0381
Sun, L., Wang, Z., Dai, H., Tian, Y., and Chen, X. (2022). Long-term manure amendment sustains black soil biodiversity by mitigating acidification induced by chemical N fertilization. Power Syst. Prot. Control 50 (4), 64–74. doi:10.3390/microorganisms11010064
Trentini, C., de Oliveira Guedes, W., de Oliveira, L. W., Dias, B. H., and Ferreira, V. H. (2021). Maintenance planning of electric distribution systems—a review. J. Control, Automation Electr. Syst. 32 (1), 186–202. doi:10.1007/s40313-020-00663-z
Yong-Xiang, Y. (2019). Time-varying failure model of multi-factor driven distribution transformer and its application. Smart Grid 9 (6), 253–262. doi:10.12677/sg.2019.96028
Zhang, Y., Tang, Y., Liu, Y., and Liang, Z. (2022). Research on variable weight synthesizing model for transformer condition assessment. Front. Energy Res. 10. doi:10.3389/fenrg.2022.941985
Keywords: smart distribution network, health index, neural network, GO methodology, fuzzy evaluation, D-S evidence theory
Citation: Zhu L, Wu Z and Huang S (2023) Assessment method of distribution network health level based on multivariate information. Front. Energy Res. 11:1178631. doi: 10.3389/fenrg.2023.1178631
Received: 03 March 2023; Accepted: 28 April 2023;
Published: 11 May 2023.
Edited by:
Imr Fattah, University of Technology Sydney, AustraliaReviewed by:
Miguel A. Sanz-Bobi, Comillas Pontifical University, SpainAdriano Chaves Lisboa, Gaia, solutions on demand, Brazil
Fei Mei, Hohai University, China
Copyright © 2023 Zhu, Wu and Huang. This is an open-access article distributed under the terms of the Creative Commons Attribution License (CC BY). The use, distribution or reproduction in other forums is permitted, provided the original author(s) and the copyright owner(s) are credited and that the original publication in this journal is cited, in accordance with accepted academic practice. No use, distribution or reproduction is permitted which does not comply with these terms.
*Correspondence: Lin Zhu, emh1bEBzY3V0LmVkdS5jbg==