 Sadaquat Ali1*
 Lahcen El Iysaouy2,3*Mhammed Lahbabi2,3Younes Boujoudar3*Sultan J. Alharbi4*Mohamed Azeroual5Fatima Zahra Bassine6Ayman Aljarbouh7Alexey Knyazkov8Aiman Albarakati9Mayur Rele10Stephanie Ness11
- 1Department of WMG, Cyber Security Centre, University of Warwick, Coventry, United Kingdom
- 2Laboratory of Signals, Systems and Components, Sidi Mohamed Ben Abdellah University, Fez, Morocco
- 3Department of Electrical Engineering, Faculty of Sciences and Technology, Sidi Mohamed Ben Abdellah University, Fez, Morocco
- 4Department of Mechanical Engineering, College of Engineering, Qassim University, Buraidah, Saudi Arabia
- 5High School of Technology Meknes, Moulay Ismail University, Meknes, Morocco
- 6International Water Research Institute (IWRI), Mohammed VI Polytechnic University (UM6P), Benguerir, Morocco
- 7Department of Computer Science, University of Central Asia, Naryn, Kyrgyzstan
- 8Department of Transport, Siberian Federal University, Krasnoyarsk, Russian Federation
- 9Department of Computer Engineering, Faculty of Computer and Information Sciences, Majmaah University, Majmaah, Saudi Arabia
- 10IT and Cybersecurity Parachute Health, Princeton, NJ, United States
- 11Vienna Diplomatic Academy, Vienna, Austria
Introduction: The utilization of solar energy in large-scale photovoltaic arrays has gained immense popularity on a global scale. However, shadows in the array lead to significant reductions in power output and create multiple power peaks in the P-V characteristics. To address this issue, the Total Cross Tie (TCT) interconnection pattern is commonly employed to minimize mismatch loss. Additionally, physical relocation methods have proven effective in dispersing shadows.
Method: In this context, the Magic Square View (MSV) offers a physical rearrangement of PV modules within a TCT scheme, effectively scattering shadows across the entire photovoltaic array.
Results: Simulation results confirm the MSV efficacy in enhancing the PV array’s output power under various Partial Shading Conditions (PSCs) patterns. Four PSCs patterns (Short and Wide, Long and Wide, Long and Narrow, and Short and Narrow) are considered and compared to the TCT and the recently validated Competence Square (CS) techniques. The MSV method is vital in improving the PV array’s power output, especially when confronted with Long and Wide shading patterns. The outcomes demonstrate that adopting the MSV configuration leads to a substantial increase of 33.78% and 29.83% in power output for LW and SW shading patterns, respectively, compared to the TCT setup. Even under LN and SN shading patterns, there is a notable power enhancement, achieving a remarkable 25.15% increase for the LW shading pattern compared to the TCT, surpassing enhancements achieved by SuDoKu, DS, and CS methods, which improved by 20.5%, 18.2%, and 21.6%, respectively. Overall, the MSV configuration presents a promising solution for enhancing the performance of photovoltaic arrays under shading conditions.
1 Introduction
Solar energy is gaining popularity as an efficient alternative to conventional sources due to its environmental sustainability and diverse applications in both industrial and residential settings (Iysaouy et al., 2019a; Gopi et al., 2023). Solar photovoltaic (PV) technologies are widely recognized worldwide, ranging from small-scale autonomous systems to large photovoltaic energy farms (Rani et al., 2013; Pareek and Dahiya, 2015; Lahcen et al., 2018; Al-Ezzi and Ansari, 2022; Soomar et al., 2022). However, partial shading remains a significant challenge, leading to decreased efficiency, shortened lifespan, and reduced power output of PV systems (Balato et al., 2011; HIGUCHI and BABASAKI, 2018). Partial shading can stem from predictable sources like adjacent buildings and trees, which can be managed during installation, as well as unpredictable factors like clouds, snow, temperature variations, and dust (Karatepe et al., 2007; Manganiello et al., 2015; Pareek and Dahiya, 2016; HIGUCHI and BABASAKI, 2018; Lahcen et al., 2018; Jha and Triar, 2019; Vicente et al., 2023). Various approaches have been explored to mitigate partial shading effects, including system structures, maximum power point tracking (MPPT) techniques, converters, inverters, micro-inverters, and different PV array configurations (Huynh et al., 2013; Sundareswaran et al., 2015; Janandra Krishna Kishore et al., 2022; Kishore D. K. et al., 2023; Kishore D. J. K. et al., 2023).
Among these approaches, the PV array is one of the most suitable methods to minimize power losses. The extent of power losses due to partial shading depends on the shading patterns, the position of shaded modules within the array, and the overall configuration (Huynh et al., 2013; Rani et al., 2013; Lahcen et al., 2018; Marhraoui et al., 2018; Pachauri et al., 2018; Abdulmawjood et al., 2022; Al-Ezzi and Ansari, 2022; Boghdady et al., 2022; Chadge et al., 2022; Janandra Krishna Kishore et al., 2022; Kim et al., 2022; Rajani and Ramesh, 2022; Soomar et al., 2022; Zhang et al., 2022; Kishore D. K. et al., 2023; Kishore D. J. K. et al., 2023). Different array configurations, such as Series-Parallel (SP), Bridge Linked (BL), Honey Comb (HC), and Total Cross Tied (TCT), have been compared in the literature for their losses, shunt resistance effect, maximum power, diode derivation, and performance under various shading conditions (Huynh et al., 2013; Rani et al., 2013; Lahcen et al., 2018; Marhraoui et al., 2018; Pachauri et al., 2018; Abdulmawjood et al., 2022; Al-Ezzi and Ansari, 2022; Boghdady et al., 2022; Chadge et al., 2022; Janandra Krishna Kishore et al., 2022; Kim et al., 2022; Rajani and Ramesh, 2022; Soomar et al., 2022; Zhang et al., 2022; Kishore D. K. et al., 2023; Kishore D. J. K. et al., 2023).
Recent studies have focused on improving PV array configurations to enhance their performance under partial shading. For instance, Gautam and Kaushika (2002) found that the Total Cross Tied (TCT) configuration can extend the life of a PV array, while. (Rajani and Ramesh, 2022) supported the TCT configuration as the most suitable solution to address mismatch issues under partial shade. However, Rani et al. (2013) introduced a Sudoku rearrangement scheme, which demonstrated a 3.6% increase in power production compared to the TCT configuration by modifying the physical location of the PV array. An optimal Sudoku configuration has been elaborated to spread the shadow effect over a larger PV array dimension (Vijayalekshmy et al., 2016).
Despite the advantages of the Sudoku-based configurations, their unique characteristics and the unsubstantiated aspect for specific array sizes have raised complications in their selection. Each Sudoku pattern results in different shade distributions and energy yields, and as the array size increases, the wiring becomes more challenging due to inconsistent panel relocation. Consequently, other reconfiguration schemes based on puzzle models, such as Magic Square (MS), the new Zig-Zag technique, cross-diagonal view (CDV), competence square (CS), and magic square view (MSV) have been developed to address these limitations (Vijayalekshmy et al., 2016; John Bosco and Carolin Mabel, 2017; Dhanalakshmi and Rajasekar, 2018; Iysaouy et al., 2019b).
Yadav et al. (2016) have extensively reported on the performances of various PV array configurations, including series-parallel (SP), total-cross-tied (TCT), bridge-linked (BL), Honey-Comb (HC), and hybrid SP-TCT, BL-TCT, and non-symmetrical puzzle patterns such as NS-1 and NS-2, analyzing power loss, fill factor, and shading dispersion effect on Maximum Power Point (MPP). These studies contribute to the ongoing efforts to optimize PV array configurations and enhance their resilience to partial shading effects.
Numerous studies have investigated various reconfiguration techniques for photovoltaic (PV) arrays under partial shading conditions. Vijayalekshmy et al. (2016) (Tatabhatla et al., 2020) explored a new Zig-Zag technique that alters the interconnections of PV panels in the Total Cross Tied (TCT) configuration. Their findings revealed improved performance in terms of power loss, mismatch loss, power enhancement, fill factor, performance ratio, and irradiation mismatch index compared to classical TCT, OTCT, and NTCT schemes.
Tatabhatla et al. (2020) addressed the reduced output power and complex tracking of the global maximum power point in shaded PV arrays. They proposed a novel reconfiguration technique using a TomTom puzzle pattern to relocate shaded and unshaded panels without altering the electrical circuitry. The TomTom reconfiguration minimized shade concentration, reduced row current mismatch, and increased output power with fewer voltage-power characteristic peaks, even under moving shading conditions.
Yadav et al. (2017) comprehensively reported on the performance of 4 × 4 PV array configurations, including TCT, hybrid SP-TCT, BL-TCT, BL-HC, and rearranged configurations based on Magic Square (MS) puzzles. They found that the MS-based reconfigurations, such as RTCT, RSP-TCT, RBL-TCT, and RBL-HC, significantly improved performance compared to traditional TCT, SP-TCT, BL-TCT, and BL-HC configurations under most partial shading scenarios.
John Bosco and Carolin Mabel (2017) introduced the Cross Diagonal View (CDV) arrangement, a novel configuration that optimizes PV power generation under partial shading conditions. The CDV configuration demonstrated superior performance under different shading patterns compared to SP, TCT, and Sudoku (SDK) configurations.
Dhanalakshmi and Rajasekar (2018) proposed a unique Competence Square (CS) technique for PV-generating systems. Based on a one-time relocation using a unique number pattern, the CS method effectively spread partial shading across the entire PV array, outperforming TCT in terms of output power, fill factor, and power losses.
Tatabhatla et al. (2020) proposed an Image Processing-inspired Chaos Map reconfiguration technique to enhance the harvested capacity of shaded PV arrays. By physically relocating panels without altering electrical connections, their method achieved uniform row current and improved output power under various shading conditions, surpassing existing static reconfiguration techniques.
Considering the interest in finding the best-performing PV configuration under partial shading, our previous work (Iysaouy et al., 2019b) proposed the Magic Square View (MSV) method for shading dispersion on the PV array, outperforming TCT and Sudoku configurations for long-wide shading patterns. In this study, we extend the MSV method to other shading patterns, including Short and Wide (SW), Long and Wide (LW), Long and Narrow (LN), and Short and Narrow (SN), and compare its performance to the Competence Square (CS) method (Dhanalakshmi and Rajasekar, 2018).
Simulation of the (P-V) characteristics of MSV and TCT configurations under various partial shading conditions, using a 9 × 9 matrix of PV modules, demonstrates the improved output power of MSV. Section 2 focuses on the modeling of PV solar, while Section 3 describes PV configurations under partial shading conditions. Section 4 discusses conventional solar PV interconnection schemes, and Section 5 explores shade-distributing techniques. Section 6 presents the impact of partial shading on PV array configurations. In Section 7, simulation results are discussed, and in Section 8, a comparison with existing literature is provided. Finally, Section 9 presents the conclusions of this study.
1.1 Research gap
While significant strides have been made in solar photovoltaics, addressing the detrimental effects of partial shading on PV systems remains a critical challenge. Partial shading can drastically reduce the overall efficiency, lifespan, and power output of PV systems (Balato et al., 2011; HIGUCHI and BABASAKI, 2018). Despite various strategies to mitigate partial shading effects, there is a clear research gap in comprehensively assessing the effectiveness of different PV array configurations under diverse shading patterns.
One promising approach that has gained attention in recent years is the Magic Square View (MSV) configuration. In contrast, studies have explored a range of configurations such as Series-Parallel (SP), Total Cross Tied (TCT), Bridge Linked (BL), and more (Huynh et al., 2013; Rani et al., 2013; Lahcen et al., 2018; Marhraoui et al., 2018; Pachauri et al., 2018; Abdulmawjood et al., 2022; Al-Ezzi and Ansari, 2022; Boghdady et al., 2022; Chadge et al., 2022; Janandra Krishna Kishore et al., 2022; Kim et al., 2022; Rajani and Ramesh, 2022; Soomar et al., 2022; Zhang et al., 2022; Kishore D. K. et al., 2023; Kishore D. J. K. et al., 2023). The MSV configuration’s unique characteristics and potential benefits have yet to be fully explored and compared. This gap is particularly pronounced when considering shading patterns of varying dimensions, such as Short and Wide, Long and Wide, Long and Narrow, and Short and Narrow. Through comparative analysis, MSV effectiveness in mitigating partial shading could be evaluated against these established configurations.
1.2 Magic square view configuration
Among the various PV array configurations, the Magic Square View (MSV) configuration stands out as a promising candidate for effectively mitigating the effects of partial shading. The MSV configuration is characterized by its ability to distribute shading uniformly across the entire PV array, minimizing the concentration of shading in specific areas. This innovative approach has shown promise in addressing the limitations of traditional configurations and spreading the impact of shading over a larger array dimension (Potnuru et al., 2015; Iysaouy et al., 2019b).
The MSV configuration is particularly well-suited to long-wide shading patterns, offering the potential to outperform conventional configurations like Total Cross Tied (TCT) and Sudoku-based configurations (Iysaouy et al., 2019b). It achieves this by ensuring that the shading is evenly distributed across the array, which helps maintain a more balanced power output and reduces the losses associated with shading. The MSV configuration is like a well-crafted jigsaw puzzle, where all the pieces fit together perfectly and the final picture is clear and beautiful. Ensuring that the shading is evenly distributed helps create an attractive and efficient final result.
1.3 Importance for industries and researchers
The significance of exploring and understanding the effectiveness of the MSV configuration lies in its potential impact on the solar industry and the academic community. Industries that rely on solar energy can benefit from optimized PV array configurations resilient to partial shading, leading to increased energy production and better financial returns. By adopting configurations like MSV, solar farms and installations can minimize power losses and improve the overall performance of their systems. Not only can this lead to increased energy production, but it can also result in improved financial returns and long-term stability for the industry.
For researchers, investigating the MSV configuration adds to the knowledge concerning PV array design and optimization. It can offer insights into the strengths and limitations of this configuration under different shading scenarios, shedding light on its applicability and potential advancements. Furthermore, by comparing the MSV configuration with existing techniques, researchers can establish a benchmark for assessing the effectiveness of novel solutions in addressing partial shading effects.
The research gap in the assessment of PV array configurations under various shading patterns, with a focus on the Magic Square View (MSV) configuration, presents an opportunity to contribute to the field of solar photovoltaics. This study aims to provide industries and researchers with valuable insights into optimizing PV systems for enhanced performance and resilience in partial shade by thoroughly evaluating the MSV configuration’s performance and comparing it with established configurations. The results of this study can provide valuable guidance on which configurations and design strategies offer the best performance and resilience when faced with varying levels of partial shade, ultimately leading to more effective and efficient PV system designs.
2 Modelling of PV solar cell
This paper adopted a sophisticated approach employing a two-diode model (Rani et al., 2013; Vijayalekshmy et al., 2017; Lahcen et al., 2018; Tatabhatla et al., 2020) to characterize photovoltaic (PV) cell behavior accurately. This model offers a notable advancement over the conventional single diode model by incorporating intricate recombination phenomena, resulting in enhanced precision for essential electrical characteristics, specifically the current-voltage (I-V) and power-voltage (P-V) relationships. Unlike its simpler counterpart, the two-diode model is characterized by its heightened complexity and superior accuracy see (Figure 1).
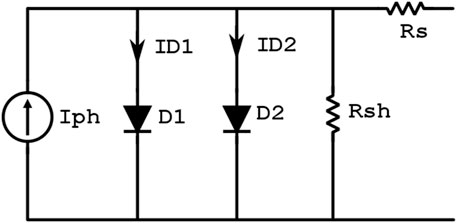
FIGURE 1. PV Module equivalent circuit.
In essence, the two-diode model depicts the circuit of a solar photovoltaic cell as a shunted current source coupled with a comprehensive two-diode configuration, encompassing both parallel and series resistors. These intricate elements account for cell behavior nuances, further refining the model’s accuracy. When assembling these PV cells into a photovoltaic module, they are interconnected in series to deliver the requisite voltage. This interconnection, captured by the equivalent circuit diagram (Lahcen et al., 2018; Iysaouy et al., 2019b), underscores the collective behavior of the module.
The crux of this advanced modeling endeavor culminates in an equation that entwines the generated current of a PV module with its voltage and incident irradiation level G (Lahcen et al., 2018; Tatabhatla et al., 2021). Serving as the bedrock, this equation unravels the intricate interplay between external forces, inherent module attributes, and the resultant electrical output. This meticulous modeling approach, tailored for partial shading contexts, not only advances scientific understanding but also empowers the optimization of real-world photovoltaic systems, charting a path toward enhanced efficiency and sustainable energy harnessing.
Where.
q: The charge of the electron in coulomb,
K: Boltzmann’s constant in Joule per Kelvin,
T: The temperature in kelvin,
Tref: The temperature in kelvin,
V: The voltage of the PV cell,
I: The current delivered by the photocell in amperes,
Iph: The photo-current in amperes,
Is1: The saturation current of D1 in amperes,
Is2: The saturation current of D2 in amperes,
α 1: The non-ideality factor of D1 the junction,
α 2: The nonideality factor of D2 the junction,
Rs: The series resistance, in Ω,
Rsh:The shunt resistance, in Ω.
Ns: The number of cells in series.
Np: The number of cells in parallel.
3 Modelling of PV configurations under partial shading conditions
Photovoltaic (PV) modules convert sunlight into electricity using photovoltaic cells. The behavior of PV modules under different conditions can significantly impact their efficiency and effectiveness. To study the behavior of PV modules, we have developed programs using Matlab, a software tool widely used for engineering and scientific applications.
This study focused on the BP380 PV module, which is widely used in various applications. We have analyzed the behavior of this module under standard conditions of 1,000 W/m2 and 25°C. These standard conditions are often used as a benchmark for comparing the performance of different PV modules. The characteristics of the PV module are given in Table 1.

TABLE 1. Technical specifications of the PV module.
To understand the behavior of the BP380 PV module, we have used a two-diode model based on Eq. 1. This model is commonly used to analyze the performance of PV modules, as it considers the complex interplay between various factors that affect the module’s behavior. Using this model, we obtained the module’s electrical current-voltage (I-V) and power-voltage (P-V) characteristics.
The electrical current-voltage (I-V) characteristic is a plot of the current the module produces against the voltage it generates. This characteristic is important because it provides information on the module’s performance under different conditions. For example, it can be used to determine the module’s maximum power point (MPP), which is the point at which it generates the maximum power. The MPP is an important parameter because it can be used to optimize the design and operation of PV systems.
The power-voltage (P-V) characteristic plots the power the module generates against the voltage it produces. This characteristic is important because it provides information on the module’s efficiency. A higher-efficiency module will produce more power at a given voltage and, therefore, have a higher power output than a less-efficient one.
The simulation results of our program show that the BP380 PV module has a peak power output of 80 W at a voltage of 22.1 V and a current of 4.8 A see Figure 2. This indicates that the module performs well under standard conditions and can generate significant power.
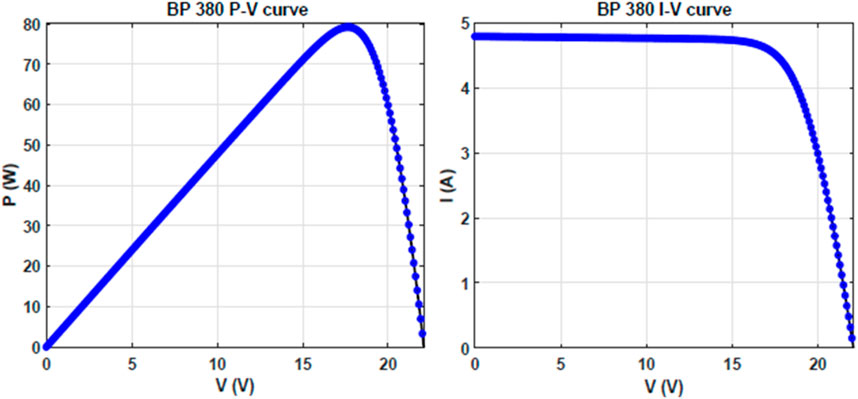
FIGURE 2. I-V and P-V characteristics for the BP 380 module, at STC conditions.
Furthermore, our simulation results indicate that the BP380 PV module has a relatively flat power-voltage curve, which means that it is less sensitive to changes in the voltage than some other PV modules. This is an important characteristic, as it makes the module more stable and predictable in its behavior.
The simulation results of our program provide valuable insights into the behavior of the BP380 PV module under standard conditions. By understanding the module’s performance characteristics, we can better design and optimize PV systems that use this module. In addition, our study demonstrates the utility of Matlab as a tool for analyzing the behavior of PV modules, highlighting the importance of using accurate and reliable models to obtain meaningful results.
4 Photovoltaic interconnection schemes and the total cross tied configuration
The interconnection scheme of photovoltaic (PV) panels plays a crucial role in maximizing the output power of a PV array. Researchers have investigated various techniques for interconnecting PV panels. The most common conventional approaches include Series-Parallel (SP), Bridge Linked (BL), and Total Cross Tied (TCT) configurations (Balato et al., 2011; Lahcen et al., 2018; Tatabhatla et al., 2021). These configurations generally require shorter wiring, reducing cable losses and costs. Additionally, they can be applied to arrays of different dimensions. However, a drawback of these schemes is their inability to distribute shade effectively over the array, leading to significant performance reduction under partial shading conditions (PSCs). Moreover, they tend to have a larger number of maximum power points (MPPs), making the task of Maximum Power Point Tracking (MPPT) more complex and impacting overall performance.
The Total Cross Tied (TCT) photovoltaic configuration has recently gained considerable attention due to its numerous advantages over conventional solar cell configurations. TCT offers increased power output, improved reliability, and a longer lifespan. Its unique interconnect design allows for better utilization of the cell area, resulting in enhanced efficiency and reduced resistive losses. Additionally, TCT cells are less susceptible to hotspots and better equipped to handle shading or partial cell damage.
Ongoing research focuses on enhancing the scalability of TCT technology. Researchers are exploring new materials, fabrication techniques, and design approaches to improve the performance of TCT cells further. For example, some studies investigate nanostructures in TCT cells to enhance light trapping and absorption, while others explore advanced interconnect designs to minimize resistive losses.
One of the key advantages of the TCT PV topology is its ability to handle partial shading or damage to individual cells effectively. In conventional solar cell configurations, shading or damage to a single cell can significantly impact the entire panel’s output. TCT configurations, on the other hand, distribute the current flow across multiple cells, minimizing the impact of such issues.
Despite its advantages, there are still challenges associated with TCT cell technology that must be addressed. A primary concern is improving the scalability and commercial viability of the technology.
The Total Cross Tied photovoltaic configuration shows promise in developing high-performance solar cells for renewable energy applications. Its unique interconnect design offers increased efficiency, reduced resistive losses, and improved shading or partial module damage resilience. Ongoing research aims to overcome challenges and make TCT technology more scalable and commercially viable for widespread adoption in the renewable energy sector. (Refer to Section 2 for details on the modeling of PV solar.).
4.1 Total cross tied (TCT) configuration
Figure 3 illustrates a TCT configuration that connects a PV array’s columns in series and rows in parallel. Therefore, it is considered the scheme that demands the highest number of wires. In this scheme, the effects of PSCs are low because the interconnection between the PV strings balances the impact of the non-uniform illustration level on each of the links in TCT (Salam and Taheri, 2011; Pareek and Dahiya, 2015; Kumar et al., 2016; Yadav et al., 2016; Vijayalekshmy et al., 2017; Yadav et al., 2017; Lahcen et al., 2018; Pendem et al., 2018; Iysaouy et al., 2019b; Tatabhatla et al., 2020; Tatabhatla et al., 2021; Al-Ezzi and Ansari, 2022; Gu et al., 2023). Besides, in most configurations with more interconnects, they rarely could activate the bypass diode. As a result, they minimize mismatch losses, those caused by hot spots and multi-peak impacts.
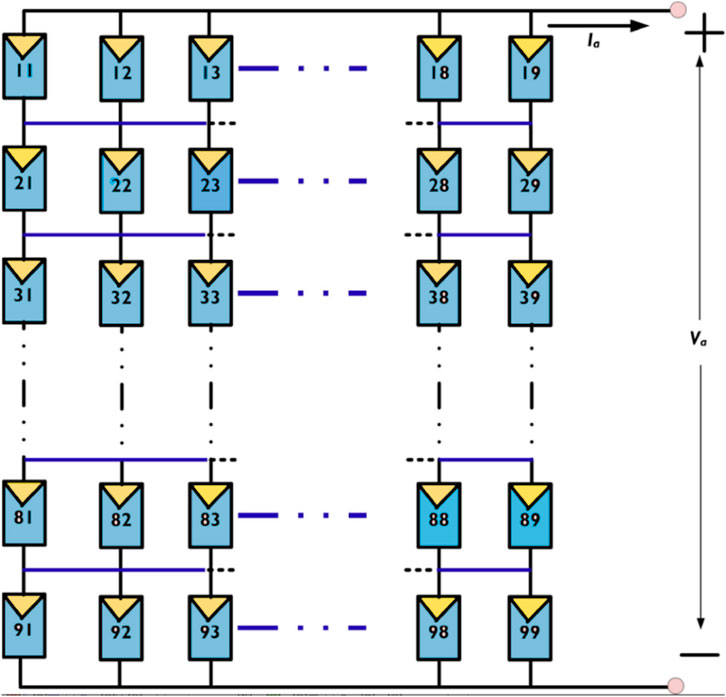
FIGURE 3. PV array configuration TCT.
The voltage and output current relationships of a TCT configuration are similar to those of the SP interconnect scheme, calculated in (Huang N. et al., 2023). In this configuration, the sum of the module currents along any row is the array current, and the sum of the module voltages along any column is the same across the array (Kaushika and Gautam, 2003; Kumar et al., 2016; Chen et al., 2022).
5 Shade distributing techniques
The main objective of shade distribution techniques would be to reach a higher efficiency than conventional approaches under PSCs (Kumar et al., 2016). Moreover, due to their ability and power to disperse the shades over the entire network, the ability to turn on the bypass diode is somewhat limited, which results in energy can be enhanced by utilizing a shade distribution technique while reducing the number of local peaks (LPs).
With a significant reduction in the number of local peaks in the electrical characteristics P-V of the system, the MPPT became a more straightforward task and led to a more efficient and less complex system. Figure 4 highlights the concept behind shade distribution techniques and the benefits of their implementation. The techniques used are Sudoku, MS. However, we focused just on MSV configuration.
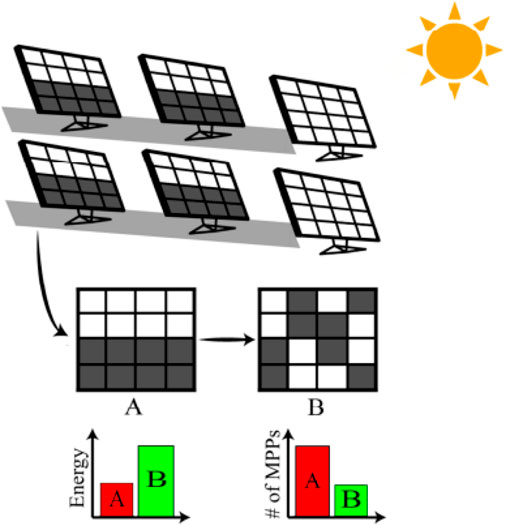
FIGURE 4. Partial shading effect on several panels in an array resulting in a lower power generation.
The Magic Square photovoltaic configuration offers several advantages over conventional configurations. One of the main advantages is its ability to better distribute shading or partial module damage throughout the entire array, leading to increased power output. This is accomplished through a dynamic interconnection scheme, where each solar panel is connected to its adjacent panels in a way that allows for the redistribution of current flow in response to shading or damage.
Compared to conventional static configurations, such as the Total Cross Tied (TCT) topology, the Magic Square configuration can spread the shading more evenly and with higher performance. Additionally, Magic Square is more efficient in energy production and highly reliable than traditional configurations. This makes it a promising technology for large-scale renewable energy applications.
5.1 Magic square view (MSV) configuration
In our previous work (Iysaouy et al., 2019b), a new method of shade distribution called the Magic Square View is proposed. In this method, we consider a (j × j) PV module matrix, where j represents the number of rows and columns and must be odd j = (2i + 1) with i as an integer between 1 and n2 in a linked array (j × j) TCT. This method consists of rearranging the PV panels of the array so that the total of the entries of any row, column, or diagonal remains equal. An example of this arrangement of PV panels in MSV configuration for a (9 × 9) network is illustrated in Figure 5B. In this example, we place the integer 1 in the middle of the 9th column, then place the number of the next panel 2 in the lower right part of the present module. If another panel already occupies this position, the next panel it is must be placed immediately to the left of this module. It can be noted that this approach is based on a “wraparound” array. Thus, if a PV panel is displaced off on one side of the PV panel, it re-enters the opposite (Iysaouy et al., 2019b). By increasing the incoming current to a specific node, thereby minimizing the bypass of the panels.
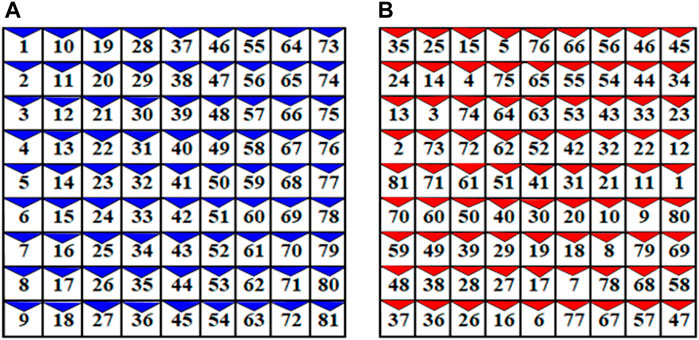
FIGURE 5. Magic Square view shade distribution method for a 9 × 9 PV array, (A) TCT non-Reconfigured array, and (B) TCT Reconfigured Array.
The flowchart of this topology to find out the MSV is shown in Figure 6.
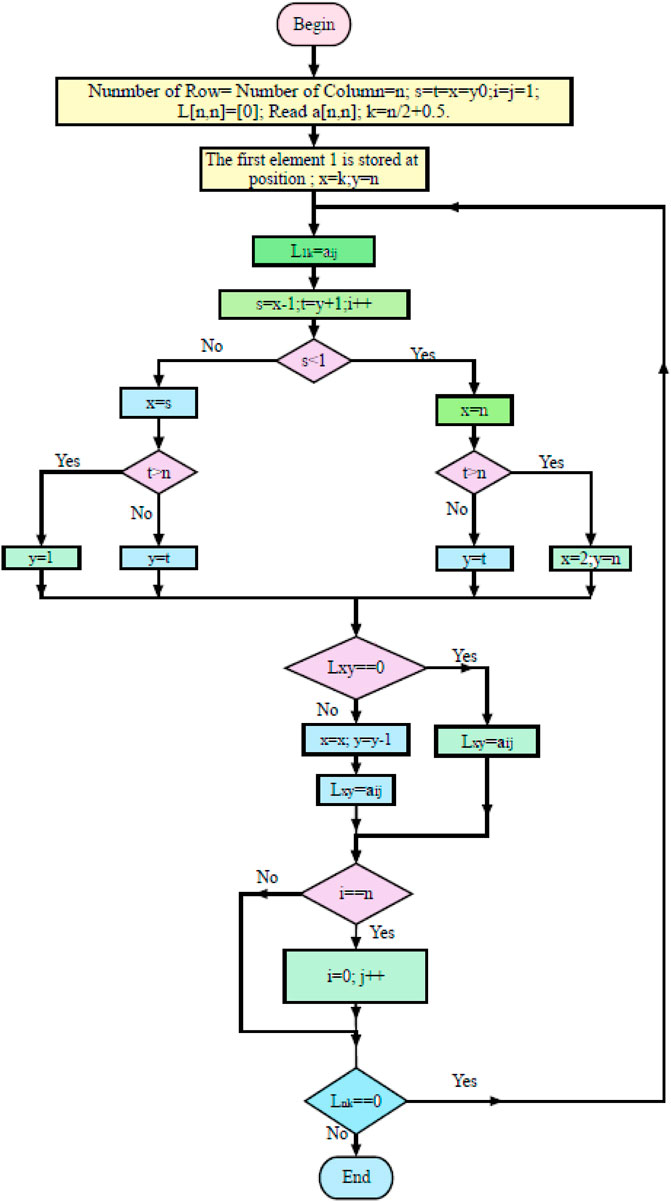
FIGURE 6. Flow chart for the formation of MSV topology.
The PV modules’ physical locations are moved without altering their electrical connections of the PV module, as in the case of the Sudoku configuration (Chen et al., 2022). Thus, this approach decreases the shading between modules in the same row and extends the impact of the shading, dispersing it over the entire array. In this way, the MSV configuration enhances the current flowing through a node during partial shading conditions, reducing power dissipation.
6 Description of partial shading conditions on PV array configurations
Partial Shading Conditions (PSCs) can significantly impact the performance of photovoltaic (PV) arrays. When certain parts of a PV array are shaded while others are not, it can lead to mismatched power outputs, reduced energy generation, and potential hotspots in the shaded modules. Different shading patterns, such as Short and Wide, Long and Wide, Long and Narrow, and Short and Narrow, are often used to mitigate these issues. Each pattern has its advantages and can address specific challenges posed by shading. Here’s a justification for the use of these patterns and the importance of comparing them in the context of PV arrays.
• Short and Wide Pattern: In this pattern, shading occurs across a wide horizontal area of the array. This helps distribute the shading effects over multiple strings, reducing the severity of mismatched power outputs. This pattern is effective when shading occurs due to obstructions like trees or nearby structures.
• Long and Wide Pattern: This pattern involves shading along a long horizontal section of the array. It can be useful for arrays where shading primarily occurs due to factors such as buildings or terrain features casting shadows over an extended array.
• Long and Narrow Pattern: Shade occurs along the array’s narrow but long vertical section. It is particularly useful when vertical structures like poles or chimneys cause shading. This pattern can help avoid situations where only a few cells are shaded in each module, minimizing mismatch losses.
• Short and Narrow Pattern: Shade affects a small, vertically narrow array area. This is suitable for arrays installed in locations with objects that cast small shadows, like overhead wires or antennas.
• Comparing these shading patterns through literature reviews and research studies is crucial for several reasons:
• Optimal Pattern Determination: The effectiveness of each pattern varies depending on factors such as the shading source, array configuration, and technology. Comparative studies help identify the most suitable way for specific scenarios, leading to improved system design and energy generation.
• Performance Analysis: Comparing patterns allows researchers and engineers to analyze the impact of different shading configurations on PV array performance. This can include parameters like power losses, energy generation, and hotspot risk, helping to make informed decisions.
• Mitigation Strategies: By understanding the benefits and limitations of each pattern, researchers can develop better mitigation strategies. These strategies might involve bypass diodes, maximum power point tracking algorithms, or reconfigurable array layouts to optimize performance under shading conditions.
• Standardization: Comparative studies contribute to standardizing the industry’s approach to dealing with partial shading conditions. Standardized practices help with consistent system design, accurate performance prediction, and reliable energy yield estimation.
• Innovation and Optimization: Literature reviews and comparisons foster innovation in shading mitigation techniques. Engineers can learn from various studies to develop new methods or improve existing ones to enhance the overall efficiency of PV systems under shade.
6.1 Short and wide shading condition
When shading covers five of nine strings in the PV configuration, and the number of shaded panels per string is four, this pattern is attributed to a SW shading case. This case of shading in the TCT configuration is shown in Figure 7A. Further, Figure 7B presents the conventional arrangement in which the magic square method is applied. It is apparent from these figures how the shaded modules are dispersed throughout the system.
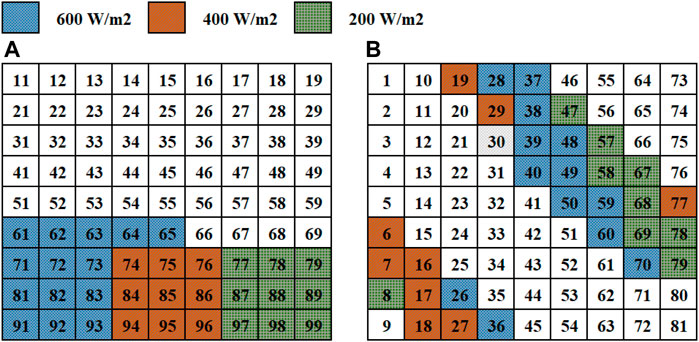
FIGURE 7. Shading Pattern short wide (A) TCT configuration; (B) shade dispersion using proposed MSV.
To evaluate the performance of the PV array under partial shading conditions, the PV array is exposed to four distinct levels of irradiation:
The first group of PV array receives a level of 900 W/m2. The Second group subjected to an irradiation level of 600 W/m2. The third and fourth groups were exposed to an irradiation of 400 W/m2 and 200 W/m2, respectively. This shading pattern is shown in Figure 6. The row currents should be intended to find out the position of the Global Peak GP. The maximum output current from (Chen et al., 2022; Huang N. et al., 2023) a row for each module is equal to the total of the current limits of each module. For the first row, the current limit is determined as follows:
Where
For the SW pattern presented in Figure.6, the PV modules in rows 1 to 5 were exposed to the same irradiation (900 W/m2). Therefore, the maximum current generated for the first five rows is determined as:
Where Im is the current of the PV module at standard conditions.
In row 6, the six PV modules are exposed to radiance level 600 W/m2 and the four next modules are exposed to 900 W/m2. The maximum current produced is calculated in the same way and is given by Eq. 6. The same calculation principle of the course is used for the following rows.
The same calculation principle of the courant is used for the following rows.
The maximum current generated by rows varies following the received irradiation.
Since the voltage variations of each row are very small, the PV arrays voltage is expressed as Va = 9Vm, -where Vm is the voltage produced by the module at standard conditions.—if no modules are bypassed. Moreover, Va = 8Vm + Vd, if a single row is bypassed, Vd corresponds to the voltage through the diode. Since Vd ≺≺ Va; Va can be ignored.
The power generated by the array is:
Where Im is the current generated by the module at standard irradiance 1,000 W/m2.
6.2 Long and wide shading condition
This case of shading in the TCT configuration is shown in Figure 8A. Further, Figure 8B presents the conventional arrangement in which the magic square method is applied.
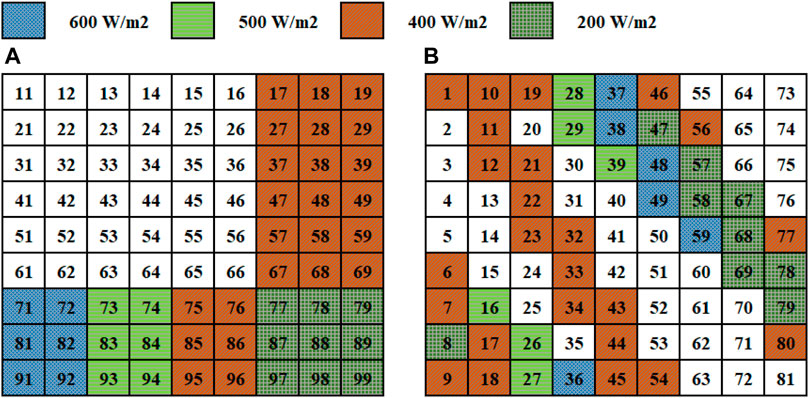
FIGURE 8. Long and wide pattern (A) TCT configuration; (B) shade distribution using MSV.
According to this shading pattern, irradiation levels divide a photovoltaic array into five distinct clusters. Group 1 is exposed to 900 W/m2 irradiation, whereas the rest of the group receives 600 W/m2, 500 W/m2, 400 W/m2, and 200 W/m2, respectively. This shadow pattern is depicted in Figure 8. Since all columns and many rows are shaded, this corresponds to the case of LW shading (Rani et al., 2013; Pareek and Dahiya, 2015). We have studied this case only to compare it with the literature.
6.3 Long and narrow shading condition
This is so-called as only some columns are partially shaded and could appear as a group anywhere in the array. This case of shading in the TCT configuration is shown in Figure 9A. Further, Figure 9B presents the conventional arrangement in which the magic square method is applied. According to this shading pattern, irradiation levels divide a photovoltaic array into four distinct clusters. In this case, the array is exposed to four irradiation levels which are 900 W/m2, 700 W/m2, 400 W/m2, and 300 W/m2, respectively.
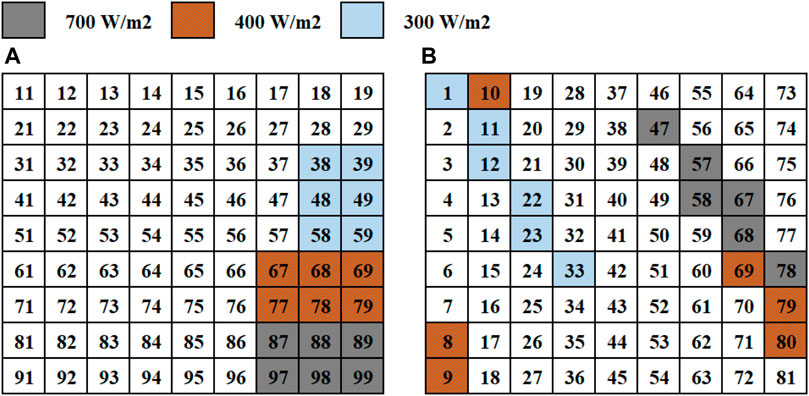
FIGURE 9. Long and Narrow pattern (A) TCT configuration; (B) shade distribution using MSV.
6.4 Short and narrow shading condition
The irradiation levels used in this case are 900 W/m2, 600 W/m2, and 400 W/m2, as shown in Figure 10A. Moreover, Figure 10B presents the conventional arrangement in which the magic square method is applied. In contrast to the previous cases, because a very small group of panels is subject to partial shading, there is a very small range of output power maximization.
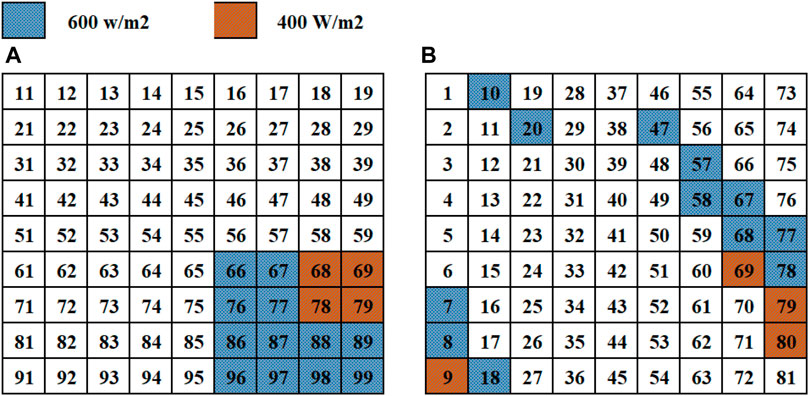
FIGURE 10. Short and Narrow pattern (A) TCT configuration; (B) shade distribution using MSV.
7 Results and discussions
A matrix comprising 9 × 9 solar photovoltaic (PV) modules is interconnected in a TCT (Total Cross-Tie) configuration. Subsequently, this arrangement is subjected to four distinct shading patterns: Short and Wide (SW), Long and Wide (LW), Short and Narrow (SN), and Long and Narrow (LN). The primary objective of this study is to evaluate the effectiveness of the proposed approach in mitigating shading effects. The simulations are conducted for both the Total Cross-Tie configuration and our proposed Multiple Source Voltage (MSV) configuration using the Matlab/Simulink software. The outcomes obtained from these simulations are then juxtaposed with those from the Total Cross-Tie configuration subjected to the same shading pattern. Additionally, the Power-Voltage (P-V) curves are employed as an analytical tool to scrutinize and compare the performance of both the Total Cross-Tie and MSV configurations.
7.1 Long and wide shading pattern
The Global Maximum Power Point (GMPP) of TCT and MSV configurations under LW shading pattern is presented in Table 2. Under this pattern, the MSV configuration produces the maximum GMPP at 4,146 W. In this shaded condition, it was observed that the MSV configuration increased the GMPP by 33.78% compared to the TCT PV generator configuration by avoiding inadequate power losses.
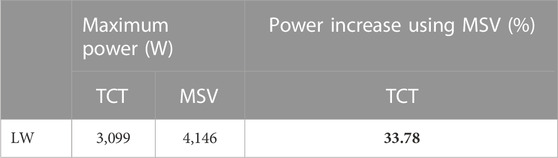
TABLE 2. GMPP achieved and percentage of improvement in power with MSV compared to TCT.
In Figure 11, we plot the calculated P-V characteristics for the TCT and MSV configurations in the case of a LW shading pattern. It can be observed that the electrical P-V features are more linear in MSV, and the global peak is more clearly defined compared with the TCT, which has two local peaks. Also, it is clearly shown in Figure 11 that the output power of the MSV configuration is higher than that of the TCT. Therefore, the PV module arrangement based on the MSV model will increase the output power produced by the PV array.
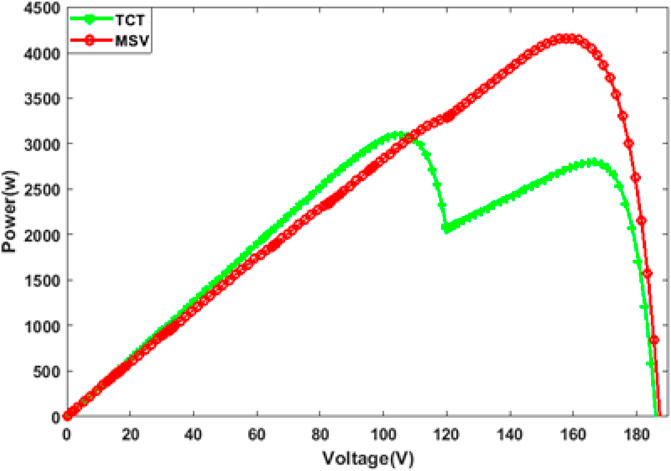
FIGURE11. TCT and MSV P-V characteristics for Long and Wide shading pattern.
7.2 Short and wide shadow
Table 3 presents the global maximum power point (GMPP) of TCT and MSV configurations under a Short and Wide shading pattern. In this case of partial shading, the MSV configuration reached a maximum power of 4,508.08 W against 3,472.34 W for the TCT. So, with the MSV configuration, we obtain an increase in output power of 1,036.08 W compared to that of the TCT. This represents a percentage increase of 29.83%, which is rather significant.

TABLE 3. GMPP achieved and percentage of increase in output power for MSV compared to TCT.
In Figure 12, we reported the calculated P-V characteristics for the TCT and MSV configurations in this case of the SW shading pattern. It is clearly shown that the P-V characteristics of the MSV are more linear than the TCT topology, and then the global peak is more clearly defined compared to the TCT, which has multiple local peaks. Therefore, the arrangement of the PV modules according to the MSV configuration improves the power produced by the array. It can, therefore, be concluded that in this case of SW shading, the generated power of the MSV configuration proposed is greater than that of the TCT.
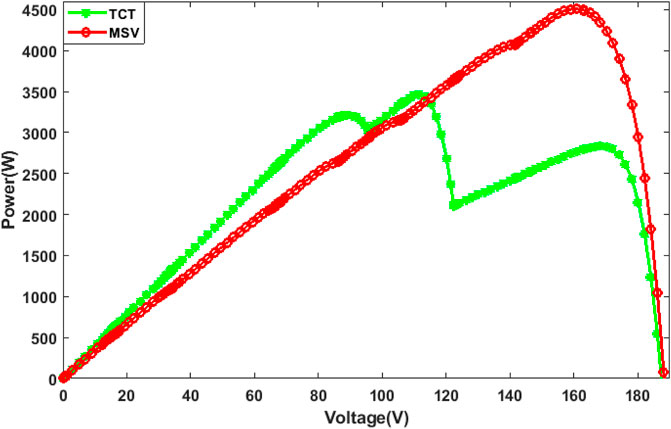
FIGURE 12. P-V characteristics for TCT and MSV configurations for Short and Wide pattern.
7.3 Long and narrow shadow
Table 4 presents the global maximum power point (GMPP) of TCT and MSV configurations under a LN pattern. In the case of this partial shading, the MSV configuration reached a maximum power of 5,152.13 W against 4,811.52 W for the TCT. So, based on MSV configuration, we can increase the output power by 7.07%, which is rather significant.

TABLE 4. GMPP achieved and power increase of MSV compared to TCT.
In Figure 13, we reported the calculated P-V characteristics for the TCT and MSV configurations in the case of a LN shading pattern. It is clearly shown that the P-V characteristics of the MSV are more linear than the remaining topology TCT, and then the global peak is more clearly defined compared to the TCT, which has multiple local peaks. Therefore, the arrangement of the PV modules according to the MSV configuration improves the power produced by the array. It can then be concluded that in this case of LN shading, the output power of the MSV configuration is greater than that of the TCT.
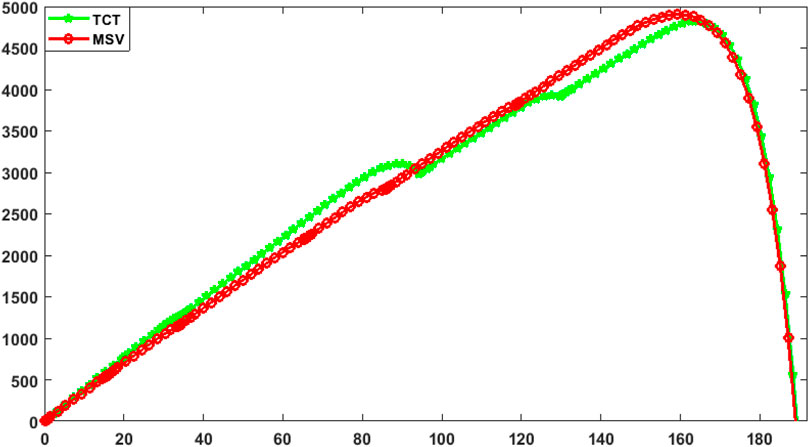
FIGURE 13. P-V characteristics for TCT and MSV configurations for Long and Narrow pattern.
7.4 Short and narrow shadow
Table 5 presents the global maximum power point (GMPP) of TCT and MSV configurations under an SN shading pattern. The MSV configuration grasped a maximum power of 5,339.00 W against 4,996.00 W for the TCT. So, with the MSV configuration, we obtain an increase in output power of 6.86% compared to that of the TCT. This increase in power is not very large compared to the previous ones.

TABLE 5. GMPP achieved and percentage of increase in output power for MSV compared to TCT.
In Figure 14, we reported the calculated P-V characteristics for the TCT and MSV configurations in the SN shading pattern. It is clearly shown that the P-V characteristics of the MSV are more linear than the TCT and then the global peak is more clearly defined compared to the TCT, which has multiple local peaks. Therefore, the arrangement of the PV modules according to the MSV configuration enhances the output power by the array. It can, therefore, be concluded that in this case of SN shading, the generated power of the MSV configuration proposed is also slightly higher than that of the TCT.
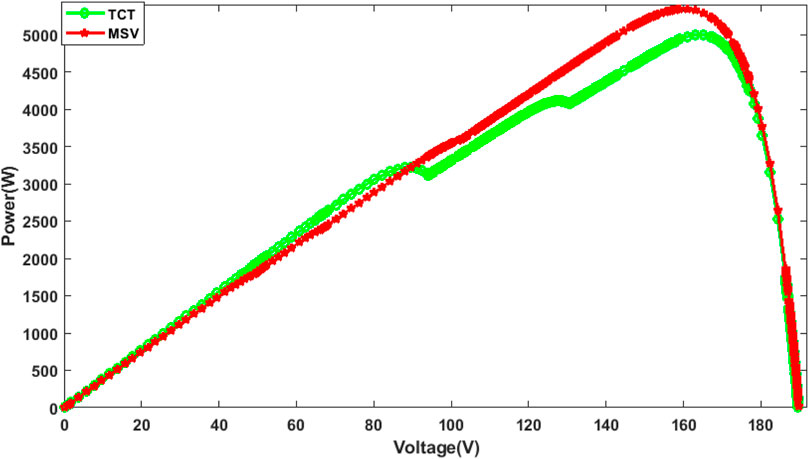
FIGURE 14. P-V characteristics for TCT and MSV configurations for Short and Narrow pattern.
8 Comparative analysis
This section will compare our proposed method MSV with some recent literature of PV array reconfiguration under partial shading conditions. We will be particularly interested in comparison with the existing magic square method. It is well known that partial shading reduces the output power of the PV array. This power loss due to partial shading is not proportional only to the shaded area but depends on the shading pattern, array configuration, and the location of the shaded modules in the matrix. This is the reason why we will limit the comparison of our MSV method only with the works of the literature, which used the same size of (9 × 9) PV array, which used the same models of partial shade, and finally used the same irradiance levels. This brings us to the works of Rani et al. (2013) and those of Dhanalakshmi and Rajasekar (2018).
The first author Rani et al. (2013) used SuDoKu (SDK) method to configure the physical placement of the modules in a (9 × 9) PV array generator connected to the TCT to enhance the PV power generation under partial shading conditions SW, LW, SN, and LN.
The second author Dhanalakshmi and Rajasekar (2018), used the same four partial shadow conditions in a (9 × 9) photovoltaic generator reconfigured according to the Competence Square (CS) method. The results obtained by these authors compared them with TCT and Dominance Square (DS) techniques.
Our MSV arrangement outperformed other CS, DS, and SuDoKu approaches in terms of total performance, and all of them are compared to TCT in terms of the percentage power enhancement, which is the power difference between the conventional and proposed value at global power peak is termed as PE (%) power enhancement. The PV system’s power enhancement, PE (%), is given in Eq. 9.
Our results and those of the literature are grouped in Table 6. Table 6 reported the global maximum power point GMPP in Watt for all these configurations and the partial shading patterns studied. It is also reproduced in this Table 6, the power enhancement percentages of the SuDoKu, MSV, DS, and CS configurations compared to the TCT technique calculated for all the partial shading patterns studied.
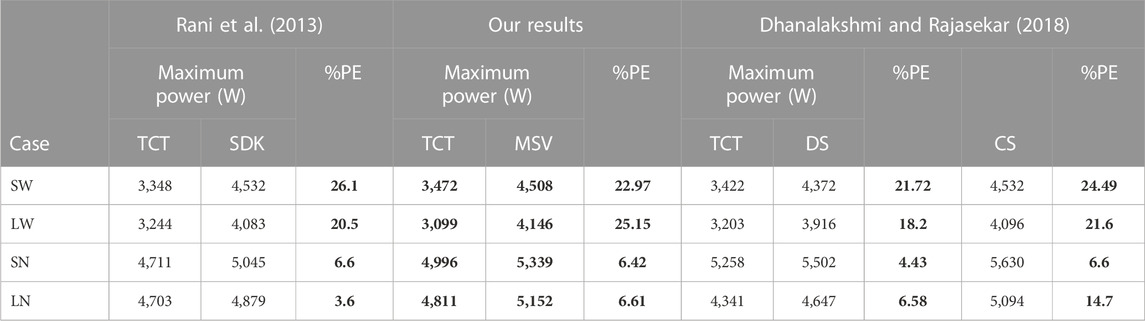
TABLE 6. Comparison of this work finding with related works in literature.
We note that our results agree with those of the literature. We also note that for all the shading patterns, the results show that the SuDoKu, MSV, DS, and CS configurations perform well compared to the conventional TCT arrangement. This performance improvement exceeds 20% for the shade case of SW and LW and is less important in the cases of SN and LN shading patterns. Finally, we can clearly see that our MSV method gives the best performance compared to all other configurations for the LW type shading case. Indeed, with the MSV configuration, we obtain a power enhancement of 25.15% for the partial shading type LW against 20.5%, 18.2%, and 21.6% obtained with the SuDoKu, DS, and CS methods, respectively. We can, therefore, conclude that our MSV method is more efficient in the case of partial LW type shading. This would certainly be due to the vital capacity of the MSV technique to disperse the shadow of a large pattern on a large number of photovoltaic modules.
We would like to point out that there are other techniques for spreading partial shadows in the literature that we did not study in this comparative analysis, although they have also proven to be efficient. This is justified because these techniques use PV arrays of different sizes and shading patterns compared to those we used. Among the most recent of these techniques, there is the Magic Square Puzzle (MSP) proposed by Yadav et al. (2017) it’s analysis has been carried out on a (4 × 4) PV array configuration for three different shading patterns (vertical, horizontal, and diagonal shading). Its results show that the MSP configuration achieves a maximum power increase of 13.3% compared to the TCT method.
John Bosco and Carolin Mabel (2017) (Rajani and Ramesh, 2022) proposed a Cross Diagonal View (CVD) configuration used in a (9 × 9) PV array system for the dispersion of three shading patterns whose location is different from the conventional shading patterns we used in our calculation. The proposed CDV configuration has shown an average increase in power enhancement of 21.67%, compared to TCT for the three shadings considered.
Finally, Vijayalekshmy et al. (2016) proposed a Novel Total Cross Tied configuration (Zig-Zag scheme) for performance improvement under partial shading conditions of a (4 × 3) PV array. In this work, five easy-to-forecast short-term sources of partial shading are analyzed. Since the GMPP under all cases of partial shading is equal, the power enhancement is the same for the studied configurations.
8.1 Contributions
In the pursuit of addressing the challenges posed by partial shading conditions in photovoltaic (PV) arrays, this study presents a comprehensive comparative analysis between the newly introduced “Magic square view” (MSV) method and established methodologies, particularly the “SuDoKu” (SDK) and “Competence Square” (CS) approaches. This investigation contributes significantly to the field through methodological advancement, parameter consistency, quantitative evaluation, and innovative reconfiguration strategies.
• Methodological Advancement under Partial Shading: This study presents a pioneering contribution by introducing the “Module Shading Vectorization” (MSV) method for enhancing power output in photovoltaic (PV) arrays under partial shading conditions. The MSV method is specifically designed to address the inherent challenges posed by partial shading, where conventional methods struggle to optimize performance.
• Intensive Comparison: The research is focused on conducting a comprehensive comparison between the proposed MSV method and existing methods, particularly “SuDoKu” (SDK) and “Competence Square” (CS). This in-depth analysis establishes the superior performance of the MSV method across different shading patterns, enhancing the field’s understanding of effective PV array reconfiguration strategies.
• Parameter Consistency for Rigorous Comparative Analysis: As a precaution against the relevance and applicability of the findings, the study compares it with works that use similar parameters, such as a consistent array size (9 × 9), identical partial shading models, and the same levels of irradiance. This alignment with real-world parameters enhances the accuracy of the results and facilitates practical adoption.
• Quantitative Performance Evaluation: The research rigorously assesses the performance of the proposed MSV method and benchmark methods (SDK and CS) through metrics like maximum power output (W) and percentage power enhancement (%PE). This quantitative evaluation provides clear insights into the efficacy of each method under various shading scenarios.
• Significant Performance Gains: The comparative results showcase that the MSV method consistently outperforms SDK and CS techniques regarding %PE across different shading patterns. Notably, the MSV method achieves substantial power enhancements, particularly in the cases of “SW” (26.1%) and “LW” (25.15%) shading patterns.
• Optimal Adaptation to Shading Conditions: The study establishes the MSV method’s robustness across various shading scenarios, maintaining competitive %PE values in the presence of challenging shading patterns like “SN” and “LN.” This adaptability underscores the method’s potential for practical implementation in varying real-world environments.
• Innovative Shadow Dispersion Approach: The MSV method’s exceptional performance is attributed to its innovative approach of distributing shading effects across the PV array. This technique mitigates power loss by effectively dispersing shading patterns, leading to observed power enhancements.
• Future Directions: While the study primarily compares the MSV method with existing techniques using a consistent set of parameters, it acknowledges that other techniques with varying configurations exist. This recognition opens avenues for future research to explore the efficiency of these techniques under different conditions.
9 Conclusion
In this study, we introduced the Magic Square View (MSV) configuration as a novel approach to address the challenges of partial shading in solar generators. The MSV arrangement optimally distributes partial shade models across the entire solar array, offering a unique advantage in efficiently handling large matrix sizes through its reconnection mechanism. This scalability positions MSV as a valuable solution for large-scale solar installations. It potentially simplifies the complexity of Maximum Power Point Tracking (MPPT) by achieving more uniform electrical characteristics and localized maximum values.
Our investigation focused on (9 × 9) PV array configurations employing the MSV method compared to the traditional Tied Cross-Tied (TCT) configuration. Through MATLAB/Simulink simulations, we evaluated the performance under four distinct shading patterns: SW, LW, SN, and LN. The results unveiled substantial power enhancements, particularly under the LW and SW shading patterns, where the MSV configuration achieved up to 33.78% and 29.83% power increase over TCT. Even in the challenging scenarios of LN and SN, MSV yielded power increases of 7.07% and 6.86%, respectively.
Our extensive analysis and statistical evaluations consistently demonstrated the MSV method’s efficiency in enhancing power output across various partial shading scenarios compared to the conventional TCT technique. The SuDoKu, DS, and CS methods also exhibited promising results for certain shading patterns, primarily LW and SW. However, the MSV approach consistently outperformed these techniques, particularly in strong shading scenarios like LW.
The effectiveness of the MSV technique was most pronounced in the LW shading pattern, achieving a remarkable 25.15% power enhancement compared to SuDoKu, DS, and CS methods with improvements of 20.5%, 18.2%, and 21.6%, respectively. This showcases MSV’s prowess in handling challenging shading conditions and underscores its superiority in maximizing power output. Moreover, the MSV technique serves as a radiance balancing mechanism by efficiently aligning shaded and unshaded modules within the same string.
In conclusion, the MSV method presented a novel and scalable solution for optimizing power output in PV arrays under partial shading conditions. Future research directions could further explore different array topologies, integrate into smart grid systems, and leverage advanced technologies such as machine learning and remote sensing to enhance the proposed approach’s efficiency and applicability. The Magic Square View method is a valuable tool to effectively combat the effects of partial shading, contributing to improved PV system performance and broader applications within the renewable energy landscape (Pendem and Mikkili, 2018; Huang X. et al., 2023; Lv et al., 2023).
Data availability statement
The original contributions presented in the study are included in the article/supplementary materials, further inquiries can be directed to the corresponding authors.
Author contributions
AiA, simulations, gathering the data, and proofreading LE modeling simulation and writing, and proofreading ML, Evualtion of simulations, writing, and proofreading YB, proofreading, and simulations and gathering the data MoA, proofreading, simulations, and collecting the data FB, proofreading, collecting the data Hossam Kotb, proofreading, collecting the data AyA, proofreading, gathering the data Muhannad Alshareef, proofreading, gathering the data AK, proofreading, collecting the data. MR, Proofreading; SN, Proofreading. All authors contributed to the article and approved the submitted version.
Conflict of interest
The authors declare that the research was conducted in the absence of any commercial or financial relationships that could be construed as a potential conflict of interest.
Publisher’s note
All claims expressed in this article are solely those of the authors and do not necessarily represent those of their affiliated organizations, or those of the publisher, the editors and the reviewers. Any product that may be evaluated in this article, or claim that may be made by its manufacturer, is not guaranteed or endorsed by the publisher.
References
Abdulmawjood, K., Alsadi, S., Refaat, S. S., and Morsi, W. G. (2022). Characteristic study of solar photovoltaic array under different partial shading conditions. IEEE Access 10, 6856–6866. doi:10.1109/access.2022.3142168
Al-Ezzi, Athil, , and Ansari, M. N. M. (2022). Photovoltaic solar cells: A review. Appl. Syst. Innov. 5 (4), 67. doi:10.3390/asi5040067
Balato, M., Vitelli, M., Femia, N., Petrone, G., and Spagnuolo, G. (June 2011). Factors limiting the efficiency of {DMPPT} in {PV} applications, Proceedings of the 2011 {international} {conference} on {clean} {electrical} {power} ({ICCEP}), Ischia, Italy, 604–608.
Boghdady, T. A., Kotb, Y. E., Aljumah, A., and Sayed, M. M. (2022). Comparative study of optimal PV array configurations and MPPT under partial shading with fast dynamical change of hybrid load. Sustainability 14, 2937. doi:10.3390/su14052937
Chadge, R. B., Sunheriya, N., Giri, J. P., and Shrivastava, N. (2022). Experimental investigation of different electrical configurations and topologies for Photovoltaic system. Mater. Today Proc. 57, 316–320. doi:10.1016/j.matpr.2022.03.097
Chen, Jiahao, Sun, Bing, Li, Yunfei, Jing, Ruipeng, Yuan, Zeng, and Li, Minghao (2022). Credible capacity calculation method of distributed generation based on equal power supply reliability criterion. Renew. Energy 201, 534–547. doi:10.1016/j.renene.2022.10.129
Dhanalakshmi, B., and Rajasekar, N. (2018). A novel Competence Square based PV array reconfiguration technique for solar PV maximum power extraction. Energy Convers. Manag. 174, 897–912. doi:10.1016/j.enconman.2018.08.077
Gautam, N. K., and Kaushika, N. D. (2002). An efficient algorithm to simulate the electrical performance of solar photovoltaic arrays. Energy 27 (4), 347–361. doi:10.1016/s0360-5442(01)00089-5
Gopi, A., Sharma, P., Sudhakar, K., Ngui, W. K., Kirpichnikova, I., and Cuce, E. (2023). Weather impact on solar farm performance: A comparative analysis of machine learning techniques. Sustainability 15 (1), 439. doi:10.3390/su15010439
Gu, Qiong, Li, Shuijia, Gong, Wenyin, Ning, Bin, Hu, Chunyang, and Liao, Zuowen (2023). L-SHADE with parameter decomposition for photovoltaic modules parameter identification under different temperature and irradiance. Appl. Soft Comput. 143, 110386. doi:10.1016/j.asoc.2023.110386
Higuchi, Y., and Babasaki, T. (October 2018). Failure detection of solar panels using thermographic images captured by drone, Proceedings of the 2018 7th international conference on renewable energy research and applications (ICRERA). IEEE, Paris, France, 391–396.
Huang, N., Zhao, X., Guo, Y., Cai, G., and Wang, R. (2023a). Distribution network expansion planning considering a distributed hydrogen-thermal storage system based on photovoltaic development of the Whole County of China. Energy 278, 127761. doi:10.1016/j.energy.2023.127761
Huang, X., Chen, N., Ye, D., Zhong, A., Liu, H., Li, Z., et al. (2023b). Structurally complementary star-shaped unfused ring electron acceptors with simultaneously enhanced device parameters for ternary organic solar cells. Sol. RRL 7, 2300143. doi:10.1002/solr.202300143
Huynh, D. C., Nguyen, T. M., Dunnigan, M. W., and Mueller, M. A. (November 2013). Global MPPT of solar PV modules using a dynamic PSO algorithm under partial shading conditions, Proceedings of the 2013 IEEE conference on clean energy and technology (CEAT). Langkawi, Malaysia, IEEE, 134–139.
Iysaouy, L. E., Idrissi, N. E. E., Tvaronavičienė, M., Lahbabi, M., and Oumnad, A. (2019a). Towards energy efficiency: case of Morocco. Insights into Reg. Dev. 1 (3), 259–271. doi:10.9770/ird.2019.1.3(6)
Iysaouy, L. E., Lahbabi, M., and Oumnad, A. (2019b). A novel magic square view topology of a PV system under partial shading condition. Energy Procedia 157, 1182–1190. doi:10.1016/j.egypro.2018.11.284
Janandra Krishna Kishore, D., Mohamed, M. R., Sudhakar, K., and Peddakapu, K. (2022). Grey wolf optimization and differential evolution-based maximum power point tracking controller for photovoltaic systems under partial shading conditions. Energy Sources, Part A Recovery, Util. Environ. Eff. 44 (3), 6286–6302. doi:10.1080/15567036.2022.2096154
Jha, V., and Triar, U. S. (2019). A detailed comparative analysis of different photovoltaic array configurations under partial shading conditions. Int. Trans. Electr. Energy Syst. 29 (6), e12020. doi:10.1002/2050-7038.12020
John Bosco, M., and Carolin Mabel, M. (2017). A novel cross diagonal view configuration of a PV system under partial shading condition. Sol. Energy 158, 760–773. doi:10.1016/j.solener.2017.10.047
Karatepe, E., Boztepe, M., and Çolak, M. (2007). Development of a suitable model for characterizing photovoltaic arrays with shaded solar cells. Sol. Energy 81 (8), 977–992. doi:10.1016/j.solener.2006.12.001
Kaushika, N. D., and Gautam, N. K. (2003). Energy yield simulations of interconnected solar pv arrays. IEEE Trans. Energy Convers. 18 (1), 127–134. doi:10.1109/tec.2002.805204
Kim, K. A., Bagci, F. S., and Dorsey, K. L. (2022). Design considerations for photovoltaic energy harvesting in wearable devices. Sci. Rep. 12 (1), 18143. doi:10.1038/s41598-022-22232-x
Kishore, D. J. K., Mohamed, M. R., Sudhakar, K., and Peddakapu, K. (2023b). A new meta-heuristic optimization-based MPPT control technique for green energy harvesting from photovoltaic systems under different atmospheric conditions. Environ. Sci. Pollut. Res. 30, 84167–84182. doi:10.1007/s11356-023-28248-8
Kishore, D. K., Mohamed, M. R., Sudhakar, K., and Peddakapu, K. (2023a). Swarm intelligence-based MPPT design for PV systems under diverse partial shading conditions. Energy 265, 126366. doi:10.1016/j.energy.2022.126366
Kumar, A., Pachauri, R. K., and Chauhan, Y. K. (November 2016). Experimental analysis of proposed SP-TCT, TCT-BL and CT-HC configurations under partial shading conditions, Proceedings of the 2016 IEEE 7th power India international conference (PIICON), Bikaner, India, 1–6.
Lahcen, E. I., Mhammed, L., and Abdelmajid, O. (2018). Enhancing the performances of PV array configurations under partially shaded conditions: A comparative study. Int. J. Renew. Energy Res. 8 (3). doi:10.20508/ijrer.v8i3.7744.g7479
Lv, Song, Zhang, Bolong, Ji, Yishuang, Ren, Juwen, Yang, Jiahao, Yin, Lai, et al. (2023). Comprehensive research on a high performance solar and radiative cooling driving thermoelectric generator system with concentration for passive power generation. Energy 275, 127390. doi:10.1016/j.energy.2023.127390
Manganiello, P., Balato, M., and Vitelli, M. (2015). A survey on mismatching and aging of PV modules: the closed loop. IEEE Trans. Industrial Electron. 62 (11), 7276–7286. doi:10.1109/tie.2015.2418731
Marhraoui, S., Abbou, A., Ziouh, A., hichami, N. El, and eddine, Rhaili S. (October 2018). Robust integral backstepping approach for MPPT in different models of solar panel, Proceedings of the 2018 7th international conference on renewable energy research and applications (ICRERA). IEEE, Paris, France, 371–376.
Pachauri, R., Yadav, A. S., Chauhan, Y. K., Sharma, A., and Kumar, V. (2018). Shade dispersion-based photovoltaic array configurations for performance enhancement under partial shading conditions. Int. Trans. Electr. Energy Syst. 28 (7), e2556. doi:10.1002/etep.2556
Pareek, S., and Dahiya, R. (2016). Enhanced power generation of partial shaded photovoltaic fields by forecasting the interconnection of modules. Energy 95, 561–572. doi:10.1016/j.energy.2015.12.036
Pareek, S., and Dahiya, R. (December 2015). Power optimization of TCT configured PS-PV fields by forecasting the connection of modules. Proceedings of the 2015 annual IEEE India conference (INDICON), New Delhi, India, 1–6.
Pendem, S. R., and Mikkili, S. (2018). Modeling, simulation, and performance analysis of PV array configurations (Series, Series-Parallel, Bridge-Linked, and Honey-Comb) to harvest maximum power under various Partial Shading Conditions. Int. J. Green Energy 15 (13), 795–812. doi:10.1080/15435075.2018.1529577
Pendem, S. R., and Mikkili, S. (2018). Modelling and performance assessment of PV array topologies under partial shading conditions to mitigate the mismatching power losses. Sol. Energy 160, 303–321. doi:10.1016/j.solener.2017.12.010
Potnuru, S. R., Pattabiraman, D., Ganesan, S. I., and Chilakapati, N. (2015). Positioning of PV panels for reduction in line losses and mismatch losses in PV array. Renew. Energy 78, 264–275. doi:10.1016/j.renene.2014.12.055
Rajani, K., and Ramesh, T. (2022). Impact of wiring resistance on PV array configurations in harvesting the maximum power under static and dynamic shading conditions. IETE J. Res. 15, 1–29. doi:10.1080/03772063.2022.2130454
Rani, B. I., Ilango, G. S., and Nagamani, C. (2013). Enhanced power generation from PV array under partial shading conditions by shade dispersion using su do ku configuration. IEEE Trans. Sustain. Energy 4 (3), 594–601. doi:10.1109/tste.2012.2230033
Salam, Z., and Taheri, H. (2011). Simple, fast and accurate two-diode model for photovoltaic modules. Sol. Energy Mater. Sol. Cells 95 (2), 586–594. doi:10.1016/j.solmat.2010.09.023
Soomar, A. M., Hakeem, A., Messaoudi, M., Musznicki, P., Iqbal, A., and Czapp, S. (2022). Solar photovoltaic energy optimization and challenges. Front. Energy Res. 10, 879985. doi:10.3389/fenrg.2022.879985
Sundareswaran, K., Sankar, P., Nayak, P. S. R., Simon, S. P., and Palani, S. (2015). Enhanced energy output from a PV system under partial shaded conditions through artificial bee colony. IEEE Trans. Sustain. Energy 6 (1), 198–209. doi:10.1109/tste.2014.2363521
Tatabhatla, V. M. R., Agarwal, A., and Kanumuri, T. (2020). Minimising the power loss of solar photo voltaic array through efficient reconfiguration of panels. Proc. Institution Mech. Eng. Part A J. Power Energy 234 (5), 690–708. doi:10.1177/0957650919871864
Tatabhatla, V. M. R., Agarwal, A., and Kanumuri, T. (2021). A Chaos Map based reconfiguration of solar array to mitigate the effects of partial shading. IEEE Trans. Energy Convers. 37 (2), 811–823. doi:10.1109/TEC.2021.3122470
Vicente, P. dos S., Vicente, E. M., Simoes, M. G., and Ribeiro, E. R. (2023). Shading position effects on photovoltaic panel output power. Int. Trans. Electr. Energy Syst. 1 (1), e12163.
Vijayalekshmy, S., Bindu, G. R., and Iyer, S. R. (April 2017). Performance comparison of Zig-Zag and Su do Ku schemes in a partially shaded photo voltaic array under static shadow conditions, Proceedings of the 2017 innovations in power and advanced computing technologies (i-PACT). IEEE, Vellore, India, 1–6.
Vijayalekshmy, S., Bindu, G. R., and Rama Iyer, S. (2016). A novel Zig-Zag scheme for power enhancement of partially shaded solar arrays. Sol. Energy 135, 92–102. doi:10.1016/j.solener.2016.05.045
Yadav, A. S., Pachauri, R. K., Chauhan, Y. K., Choudhury, S., and Singh, R. (2017). Performance enhancement of partially shaded PV array using novel shade dispersion effect on magic-square puzzle configuration. Sol. Energy 144, 780–797. doi:10.1016/j.solener.2017.01.011
Yadav, A. S., Pachauri, R. K., and Chauhan, Y. K. (2016). Comprehensive investigation of PV arrays with puzzle shade dispersion for improved performance. Sol. Energy 129, 256–285. doi:10.1016/j.solener.2016.01.056
Keywords: magic square view (MSV), partial shading, photovoltaic, array configuration, total cross tied (TCT), competence square (CS), dominance square (DS)
Citation: Ali S, El Iysaouy L, Lahbabi M, Boujoudar Y, Alharbi SJ, Azeroual M, Bassine FZ, Aljarbouh A, Knyazkov A, Albarakati A, Rele M and Ness S (2023) A matlab-based modelling to study and enhance the performance of photovoltaic panel configurations during partial shading conditions. Front. Energy Res. 11:1169172. doi: 10.3389/fenrg.2023.1169172
Received: 18 February 2023; Accepted: 05 September 2023;
Published: 03 October 2023.
Edited by:
Aitor Ciarreta, University of the Basque Country, SpainReviewed by:
Anshul Agarwal, National Institute of Technology Delhi, IndiaMohamed Salem, University of Science Malaysia (USM), Malaysia
K. Sudhakar, Universiti Malaysia Pahang, Malaysia
Copyright © 2023 Ali, El Iysaouy, Lahbabi, Boujoudar, Alharbi, Azeroual, Bassine, Aljarbouh, Knyazkov, Albarakati, Rele and Ness. This is an open-access article distributed under the terms of the Creative Commons Attribution License (CC BY). The use, distribution or reproduction in other forums is permitted, provided the original author(s) and the copyright owner(s) are credited and that the original publication in this journal is cited, in accordance with accepted academic practice. No use, distribution or reproduction is permitted which does not comply with these terms.
*Correspondence: Sadaquat Ali, c2FkYXF1YXRhbGl1a0B5YWhvby5jby51aw==; Lahcen El Iysaouy, bGFoY2VuLmVsaXlzYW91eUB1bTVzLm5ldC5tYQ==; Younes Boujoudar, eW91bmVzLmJvdWpvdWRhckB1c21iYS5hYy5tYQ==; Sultan J. Alharbi, ZHIuc3VsdGFuLmFsaGFyYmlAZ21haWwuY29t