 Yang Wu1
 Xingxing Wanyan
 Xiangyang Su
 Shuangquan Liu
95% of researchers rate our articles as excellent or good
Learn more about the work of our research integrity team to safeguard the quality of each article we publish.
Find out more
METHODS article
Front. Energy Res. , 17 April 2023
Sec. Process and Energy Systems Engineering
Volume 11 - 2023 | https://doi.org/10.3389/fenrg.2023.1162122
This article is part of the Research Topic Key Technologies for Hybrid Energy System Planning and Operation View all 10 articles
To ensure the stability of the electricity spot market and the safety of the provincial and regional power systems, a safety check method is proposed to maximize the effective reserve resources in the power system by optimizing the power of each tie-line. This safety check method accurately models the tie-line equipment and the effective reserve resources and is coupled with each constraint of the electricity spot market clearing model to form a safety check algorithm to optimize the power of tie-line power. The model involved in this paper is a linear model, which has a clear implementation method in practical dispatching applications. Through this method, the power configuration scheme of each tie-line to meet the electricity spot market constraints can be obtained, and the safety check results have the executability of the power market. The rationality and feasibility of the safety check algorithm results are verified by simulating the provincial-scale electricity spot market. According to the simulation results, this method can release effective reserve resources and provide more guarantees for the safe operation of the power grid. In addition, this method can save up to 4.9% of the total operation cost of the power system and improve the dispatching economy of the power system. This method is of great significance to ensure the safe operation of the power system and the day-ahead market and real-time market scheduling in the actual power spot system. In addition, this method also has great guiding significance for the analysis of the actual reserve situation of the power market after the event.
With the increase in power consumption load and the large-scale integration of new energy into the grid, the safety and economic operation of the power system is facing severe challenges (Li et al., 2020). With the rapid construction of a new power system with new energy as the main body, the penetration rate of new energy is increasing, which puts forward new requirements for the adequacy of power system operation (Chen et al., 2022). Large-scale new energy integration brings a large amount of clean energy to the power grid and great challenges to the power system reserve (Yang et al., 2020).
With the large-scale construction of provincial and regional electricity spot markets, the current progress of power market construction in various provinces is different, and regional grid security verification requires coordination between provincial markets and regional dispatching (Cai et al., 2022). When there is a breakthrough in power grid security constraints, the correction strategy needs to consider the stable operation of the market, which poses new challenges to the traditional security check mode.
Safety check refers to the process of analyzing the safety and power balance of the power system from the perspective of power system operation safety (Bao et al., 2022). The safety check of electricity spot energy market transactions is carried out simultaneously with market clearance, and the market clearance results must strictly meet the national and industry policies and standard requirements and, at the same time, meet the requirements of safe and stable operation of the power grid, power balance, and clean energy consumption.
In addition, China adopts UHVDC (ultra-high-voltage direct current) transmission technology to transport surplus energy in the western region to the load center in the central and eastern regions over long distances, which breaks the reverse distribution of energy resources and energy consumption in China (Fang et al., 2022), where power is usually transmitted between regions through multiple inter-provincial AC/DC channels. At present, the provincial government of the inter-provincial AC and DC channels usually signs an inter-provincial power transmission framework agreement to agree on the annual power transmission scale (Zhou et al., 2022), generally including the annual power transmission, transmission load, and peak-to-valley ratio, but it is difficult to stipulate the specific power transmission curve throughout the year with the inter-provincial power transmission framework agreement. The daily output curve of the tie-line is determined by the decomposition mechanism, and the contract power decomposition curve obtained by different decomposition mechanisms may be different. Since the framework agreement between the provinces connected by the transmission tie-line usually needs to be physically implemented, especially the inter-provincial priority power generation plan needs to be cleared first according to the decomposition curve to ensure implementation, the daily output curve of the tie-line determined by the decomposition mechanism forms the constraint of the spot market model (Peng et al., 2020); that is, the provincial electricity spot market usually takes the power of the tie-line as the boundary data of the spot market clearance.
In the electricity spot market, adjusting the transmission power of the tie-line needs to consider the safety of the regional collaborative power grid, the fairness of the market, and the rationality of the clearing results. In the actual operation of the power grid, the power replacement of the tie-line occurs from time to time in real-time scheduling, and the change of the tie-line power is bound to affect the blocking of the section and line. Therefore, based on the results of the day-ahead electricity spot market, it is necessary to optimize the power of the tie-line for the safety check, which can further ensure the stability of the power market and the safety of the provincial and regional power systems.
The operation reserve of the power system refers to the additional active capacity that can be called up at any time to cope with load forecast errors, unexpected equipment outages, unit power generation failures, renewable energy power fluctuations, etc., in the arrangement of power system operation mode and real-time dispatch operation. In actual grid operation, it is difficult to evaluate the actual available operational reserve (Duan et al., 2022). This article refers to this reserve as an effective reserve, which refers to the spare capacity of the unit that the system can call up in time. However, the evaluation of effective reserve in the current stage of research is often localized in the calculation problem of production applications, such as in the work of Zhang et al. (2020) and Wenhuan et al. (2022). The literature classifies effective reserve evaluation as a production application problem and only a post hoc calculation and deduction method, which cannot cope with the needs of real-time scheduling in the spot market environment. It is difficult to accurately calculate the effective reserve of the system in real-time scheduling, which brings great security risks to the system. In addition, due to changes in boundary conditions, the day-ahead clearing results may not meet the demand for an effective reserve of the system in the real-time market, especially in the new power system, where the effect of the new energy forecast is particularly significant. In the new power system, relevant research on the difficulty of reserve evaluation caused by the deviation of new energy prediction includes the probability evaluation method (Chen et al., 2022; Liu et al., 2023), random optimization (Xu et al., 2023), and robust optimization (Ran et al., 2022; Wang et al., 2022). The probabilistic evaluation method and stochastic optimization method are too dependent on the probabilistic accuracy of boundary data prediction in the day-ahead electricity spot market and cannot meet the actual scheduling demand in the day-ahead and real-time electricity spot market. The solution results of the robust optimization method are too conservative and cannot be applied to the actual electricity spot market clearing model.
At present, it is also difficult to assess the effective reserve in the day-ahead electricity spot market; if the proportion of effective reserve components in the operating reserve is relatively low, it will mislead the dispatcher, give the dispatcher the illusion of sufficient effective reserve, and bring serious hidden dangers to the safety of the power system.
The factors affecting the effective reserve capacity of the power system can be divided into the following three levels: first, at the level of power system power grid security, the power flow limit of the section or line will affect the effective reserve space provided by the unit; for example, when the section exceeds the limit in the forward/reverse direction, the unit with a positive/negative generation shift distribution factor (GSDF) relationship with the section cannot provide the corresponding reserve at this time, and the marketization of power spot may cause transmission congestion to be more obvious and compress the effective reserve space. Second is the multi-energy coupling in energy interconnection (Wu et al., 2019; Hou et al., 2022). At this level, the primary energy supply can also affect the effective reserve, such as the coal storage limit of the coal turbine, the natural gas supply limit of the gas engine, the reservoir capacity limit of the pumped storage unit, the water level limit of the hydropower unit, and the cascade hydropower limited by the basin hydraulic limit, which will affect the effective reserve that the unit can provide. Third, at the time coupling level of the power system, the constraints of the climbing rate of the unit and the maximum energy of the unit in a dispatching cycle make the spare capacity of the unit unable to be called by the system in time and unable to provide an effective reserve.
Therefore, by optimizing the power of the tie-line in the safety check link, alleviating the congestion of the power grid, and releasing more effective reserve in the system, the overall reserve and peak regulation capabilities of the system can be guaranteed, and safe, stable, and economical operation of the power grid can be guaranteed.
The preparation and verification of the tie-line plan is a key link affecting the scheduling and transaction organization of multi-level coordination, so it is necessary to reasonably evaluate the transmission power of inter-provincial channels to ensure the security of the power grid in the whole region.
From the level of safety check of the power system, it is a very novel research point to optimize the power of the tie-line to release effective reserve of the system.
The safety check of spot energy market transactions is carried out simultaneously with market clearance, and the results of market clearance must strictly meet the national and industry policies and standards and the requirements of safe and stable operation of the power grid, power balance, and clean energy consumption.
The clearing model of the electricity spot market includes the security-constrained unit commitment (SCUC) and the security-constrained economic dispatch (SCED). The specific clearing model is shown in the Supplementary Material’s SCUC model and SCED model (Fang et al., 2020). Among them, the tie-line planned power is used as a boundary condition and does not participate in market optimization.
Among them, the security check has been completed simultaneously in the process of solving SCUC and SCED, the power grid security check is completed by the power grid security constraint in the clearing model, and the load balance check is completed by the system balance constraint in the clearing model.
The consideration of positive and negative reserves of the system in the spot market clearance is completed by the system reserve capacity constraint. However, this constraint is relatively extensive in considering reserve, and usually, the positive reserve of the system is based on the proportion of the total system load forecast, or the positive reserve demand is set according to the maximum capacity of a single unit.
The safety check method proposed in this paper is to modify the day-ahead electricity spot market clearing model under the condition that the unit power is determined. For details of the modification, see the safety check model in Section 3 of this article.
The safety check model is a transformation of the SCUC model (the SCUC model is shown in Supplementary Material), which mainly includes the following four points:
1. The objective function of the safety check model is to maximize the effective reserve
2. Model the effective reserve
3. Model the DC tie-line
4. Modify the constraints that affect the effective reserve of the system
Here,
DC tie-line power has the characteristics of controllability, which can be optimized as a flexible resource to promote the optimal allocation of resources. For DC tie-lines, its power can be freely controlled, so it can be optimized by constructing variables separately, and its sending and receiving ends are used as node loads and node injections, respectively (Peng et al., 2020).
Although the DC tie-line power can be flexibly adjusted, in actual operation, it is not possible to make frequent adjustments, except in emergencies, in which the action of AC filters and converter transformers is an important limiting factor (Shen et al., 2020).
Therefore, the tie-line power constraint includes the following five items.
The upper and lower limit constraints of tie-line power mean that the transmission power of the tie-line should be within its maximum and minimum technical output range, which can be described as
where
The DC tie-line adjustment limit constraint means that the number of power changes of the tie-line throughout the day must be within a certain range, which can be described as
where
The power of the tie-line cannot be first up and then down or first down and then up in adjacent periods, which can be described as
DC tie-line climbing constraint refers to the up/down adjustment of DC tie-line power, which must meet the climbing rate requirements, which can be described as
where
In medium- and long-term transactions, the planned power of each tie-line channel has been confirmed, and it is prioritized in the spot market according to the contract power decomposition curve. This model focuses on the safety check after the day-ahead electricity spot market clearing, so it does not change the total power curve of the tie-line channel, only optimizes the power of the tie-line contained in the channel, and the total transmission power of each tie-line is consistent with the total power of the channel, which can be described as
where
When the unit is down, it cannot provide any effective reserve, so effective reserve variables should be a coupling relationship with the operating state of the unit:
A binary variable
In addition, the effective reserve variables’ upper limit should be less than the difference between the maximum adjustable output of the unit and the actual output of the unit, that is, the following constraint should be met:
where
Constraints (7) and (8) can be written together as follows:
At the time coupling level, constrained by the climbing rate of the unit, the effective reserve is the output of the unit that can be called at the next period, and the climbing constraint of the unit coupled with the effective reserve is shown as follows:
where
Due to the limitation of the primary energy supply of thermal power units and the limitation of the water level and storage capacity of hydropower units, the effective reserve that can be provided by the unit is limited, and the following energy constraint is used:
where
To ensure the solution speed of the model, the modeling of hydropower units is linearized: the water level water consumption rate curve and the water level reservoir capacity curve of the hydropower plant are linearized in segments and converted into electricity constraints after external linearization treatment. The water level reservoir capacity curve of hydropower plants is the curve of the relationship between the reservoir level of hydropower plants and its corresponding reservoir capacity. The water level water consumption rate curve is the curve of the relationship between the water head and water level of the hydropower plant and its corresponding water consumption rate.
Reserve, that is, subject to power grid security constraints, using line safety constraints as an example, as shown in the formula (12), the same applies to section safety constraints:
where
The coupling of the slack variable and the effective reserve variable of power grid security constraint has the constraint relation of formula (13). When the line crosses the limit, the unit with the corresponding positive sensitivity cannot provide the corresponding reserve. When the line crosses the limit, the unit with the corresponding positive GSDF cannot provide the corresponding reserve. When the line reverses the limit, the unit with the corresponding negative GSDF cannot provide the corresponding reserve:
To facilitate the implementation of model engineering and ensure the speed of model solving, the formula is linearized as follows:
where
This paper simulates the provincial-scale power grid data of tie-line power sent out of the province, and the generator sets are mainly composed of clean energy.
In the boundary data, the proportion of each type of unit by capacity is shown in Table 1.
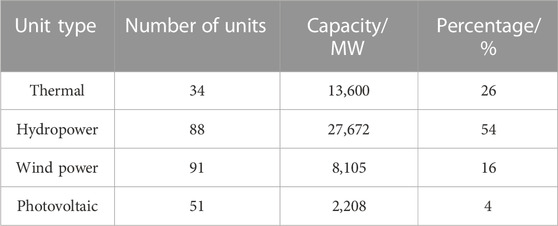
TABLE 1. The proportion of capacity of each type of unit.
In this case, only thermal-type and hydropower-type units can provide reserve capacity, while wind-type and photovoltaic-type units do not provide reserve capacity.
In the case simulation in this paper, the number of nodes is 1,641, the number of branches is 2,081, and the number of tie-lines is 21, of which the power of the tie-line is all the sending power, and the power grid nodes on the 21 tie-lines are seven. In this paper, for the convenience of description, the power grid nodes of the tie-line are the same, called a tie-line group.
The total power of the tie-line at each period is shown in Figure 1. In the period 13–24, the minimum power of the tie-line is 4,552.5 MW, and in the period 77–81, the maximum power of the tie-line is 8,290 MW.
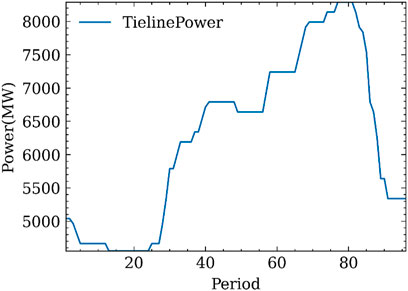
FIGURE 1. Total power curve of the whole system tie-line.
The power curve of seven tie-line groups at each period is shown in Figure 2. The power of TielineChannel_3 and TielineChannel_4 for 96 periods in the whole day is the same, and no power adjustment occurs. The power of other tie-line groups is not adjusted for 96 periods in the whole day.
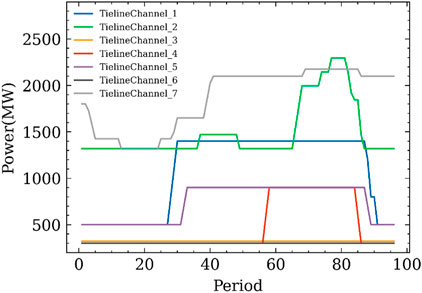
FIGURE 2. Power curve of seven tie-line groups.
The net load and bus load for each period are shown in Figure 3. In this figure, the bus load of the system represents the total load of the whole grid, and the net load of the system represents the total load of the whole grid minus the load of the tie-line. The net load of the system and the total bus load have the same variation trend. The 20 period (4:45) is the load valley, and the 80 period (19:45) is the load peak.
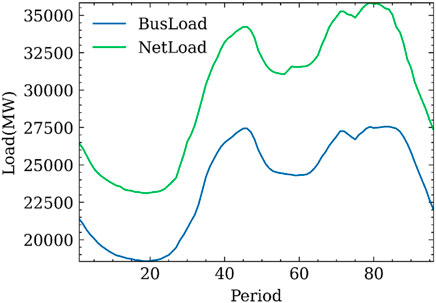
FIGURE 3. Net load and bus load of the whole system.
The reserve demand value is about 8.5% of the maximum net load, that is, 3,000 MW.
The solver used to solve this model is CPLEX 12.8.0. The computer processor for the solution environment is Intel(R) Core(TM) i7-8565U CPU @ 1.80 GHz 1.99 GHz, the memory space is 16GB, and the operating system is Windows 10.
After simulation of all types of unit quotation, the results of solving the SCUC model (Fang et al., 2020) are as follows: the MIPGap value converges to 0.00997%, the objective function value is 495,417,627, and the solution time is 3,299 s.
In the SCUC clearing results, no lines have crossed the limit, and the safety constraints are met; 20 lines reach the boundary, and 117 lines are heavy load. Reaching the boundary means that the line power flow is equal to the line capacity. Heavy load means that the current flow of the line reaches more than 80% of the line capacity but does not reach the boundary.
The reserve and effective reserve pairs of the system are shown in Figure 4. PosRsv represents the reserve that can be provided by the system at each period, ValidPosRsv represents the effective reserve that can be provided by the system at each period, and MinPosRsv represents the positive reserve demand value of each period of the system. As shown in the figure, the effective reserve that the unit can provide during the 80 period and its vicinity is 0. The system load is maximum during this period. Although the system can provide positive and reserve values much higher than the reserve requirement of 3,000 MW, the effective reserve at 29, 30, 32, 72, 78, 79, 80, 81,82, 83, and 84 periods are 0. It shows that although the positive reserve constraint is met in the results of day-ahead electricity spot market clearing, the effective reserve is very low, and if the dispatcher sees that the positive reserve capacity that the system can provide is much higher than the capacity demand of 3,000 MW, but the actual effective reserve is very low, it brings great safety risks to the power system dispatching operation.
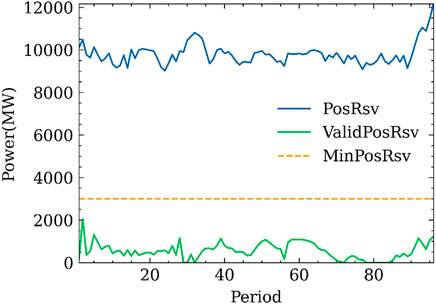
FIGURE 4. Comparison diagram of system positive reserve, effective positive reserve, and positive reserve demand.
The system marginal price is shown in Figure 5. Average LMP represents the average locational marginal price (LMP) in each period of the system, and SMP represents the system marginal price (SMP), that is, the price of energy.
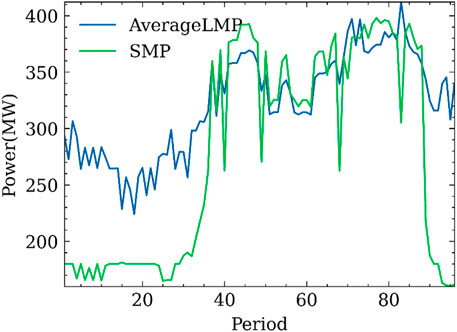
FIGURE 5. Comparison diagram of average LMP and SMP.
When the whole power grid is not blocked, the LMP of all nodes in the whole power grid is the same, which is the marginal cost of the marginal generator set. When the power grid is blocked, the LMP of the nodes of the whole power grid is different. Figure 5 mainly illustrates the existence of the congestion situation, so the average LMP and SMP of the results of day-ahead electricity spot market clearing are inconsistent.
After the safety check of the tie-line power optimization, it has a positive impact on the power grid congestion situation. A total of 16 lines reached the boundary, 115 lines were overloaded, no line exceeded the limit, and the safety constraint was met. The line congestion was alleviated to a certain extent.
After the safety check of the tie-line power optimization, the impact on the effective reserve is shown in Figure 6. ValidPosRsv_befor represents the effective reserve of day-ahead electricity spot market clearing, ValidPosRsv_after represents the effective reserve that can be provided by the system after optimizing the tie-line power, and MinPosRsv represents the positive reserve demand value for each period in the system. As shown in Figure 6, the effective reserve value of the system is significantly improved after the optimization of the tie-line power, and the minimum positive reserve demand value of the system is met for most of the period. In the original model, the effective reserve at 29, 30, 32, 72, 78, 79, 80, 81, 82, 83, and 84 periods are 0. After the optimization of the power of the tie-line power, the effective reserve in these periods is significantly improved. Among them, the effective reserve value in the load peak 80 period (3,553.7 MW) is greater than the minimum positive reserve demand value (3,000 MW).
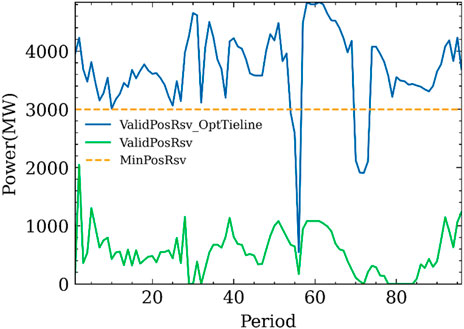
FIGURE 6. Comparison diagram of the effective positive reserve before and after optimizing the power of the tie-line.
In summary, after the safety check optimizing the tie-line power, the system power grid congestion situation is alleviated, and the effective reserve is significantly released.
Compared with Figures 2, 7, it can be seen that after optimization the power of the tie-line changes more frequently with periods. However, this change has a positive impact on the safety of the whole system operation.
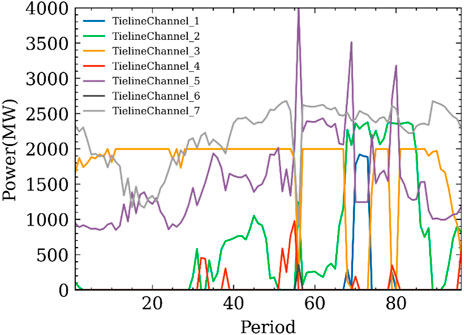
FIGURE 7. Power curve of seven tie-line groups after optimizing the power of the tie-line.
After the safety check of tie-line power optimization, a new tie-line power curve is obtained, which is used as new boundary data, and the original SCED model (Fang et al., 2020) is optimized under the condition of fixed unit start and stop. The clearing results are as follows: the objective function value is 471,042,162, which is 4.9% lower than the total cost of the output curve of the original tie-line power. This shows that the safety check method to optimize the power of the tie-line has a positive impact on the economy of the whole system operation. System power grid congestion: 31 lines reach the boundary, and 132 lines are overloaded. The power grid congestion is worse than the original tie-line power. By comparing the results of the actual day-ahead electricity spot market clearing optimization model, it is found that although the power grid congestion situation is slightly aggravated, there is no line exceeding the limit. The most important thing is that the economy of the operation cost is objectively improved.
The effective reserve situation of the system is shown in Figure 8, where ValidPosRsv represents the effective reserve of day-ahead electricity spot market clearing, ValidPosRsv_OptTieline represents the effective reserve that the system can provide after optimizing the tie-line, MinPosRsv represents the positive reserve demand of each period of the system, and ValidPosRsv_reNewTieline represents the effective reserve that the units can provide after the SCED model clears when the new tie-line power replaces the tie-line power of the original boundary data. It can be seen from Figure 8 that after the iteration of the optimized tie-line power and the SCED model, the effective reserve for most of the period has been significantly improved. Although the effective reserve did not exceed the positive reserve requirement value of 3,000 MW for many periods, there was no period when the effective reserve was 0.
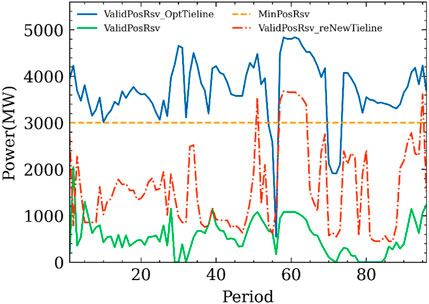
FIGURE 8. Comparison diagram of the effective positive reserve.
Figure 9 is a comparison chart of positive reserve and effective positive reserve in the SCED model clearing results as a boundary, and it can be seen from Figures 4, 9 that the effective reserve has been significantly released. In Figure 9, there are not only all periods that can provide effective reserves but also periods 83 and 87 that provide the lowest effective reserve, and the lowest effective reserve value is 450 MW.
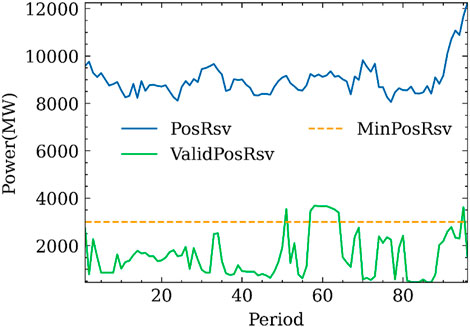
FIGURE 9. Comparison diagram of system positive reserve, effective positive reserve, and positive reserve demand.
The average LMP and SMP are shown in Figure 10. The average LMP and SMP of the results of day-ahead electricity spot market clearing are inconsistently illustrating the existence of the congestion situation.
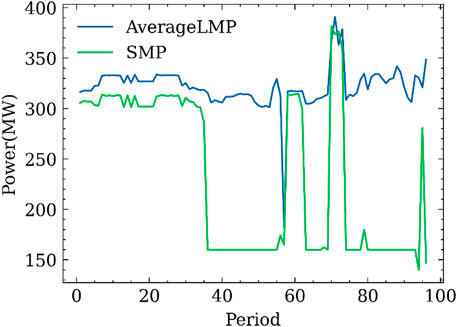
FIGURE 10. Comparison diagram of average LMP and SMP.
For the power grid with heavy congestion, the reserve deduction method (Zhang et al., 2020; Wenhuan et al., 2022) will lead to clearing failure. However, the method provided in this paper will not only affect the normal clearing process but also improve the effective reserve resources, which not only ensures the safety of the power grid but also improves the economy of power system dispatching. For the new power system with a high proportion of new energy, compared with the probabilistic evaluation method (Chen et al., 2022; Liu et al., 2023) and random optimization (Xu et al., 2023), the method provided in this paper has better real-time performance and certainty, can meet the actual power scheduling requirements, and can be directly applied to the engineering algorithm of power spot market clearing.
In this paper, a safety check method is proposed to optimize the power of each tie-line to maximize the effective reserve resources in the power system. Through the simulation analysis of the provincial-scale power system, by optimizing the power of 21 tie-lines, it is proved that the use of this safety check method has a significant effect on the effective reserve resources of the system, and the optimized tie-line power as a new boundary brings positive impact on the operation safety and system economy of the whole system. However, from the perspective of regional safety check, the effect of changes in the power of the transmission tie-line in the province on other provinces or regions requires the regional dispatching agency to re-evaluate from the regional safety check level.
This safety check method is deeply coupled with the day-ahead electricity spot market clearing model and takes into account all constraints of the electricity spot market. This security check method has high clearance efficiency and is of great significance in connecting the real day-ahead electricity spot market with the real-time electricity spot market. This security check method has a clear implementation path, which is convenient for engineering applications.
The safety check optimization results are reasonable and reliable and have extremely high practical significance. The safety check optimization results of the tie-line power are executable for power dispatching and can provide a reasonable and reliable dispatching scheme for real-time dispatching staff to cope with the sudden increase in reserve demand.
This safety check method is also of great guiding significance for the post-event analysis of the real reserve situation of the power market. In addition, this method is of positive significance to improve the difficulty of effective reserve assessment of the electricity spot market.
The original contributions presented in the study are included in the article/Supplementary Material; further inquiries can be directed to the corresponding authors.
YW: contributing to the core ideas of the article; XW: article writing, model conception, and algorithm development; XS: providing effective reserve model ideas; WZ: providing tie-line model ideas; XZ: core idea discussion, validation, and revision; SL: providing the core issues and power spot clearing process modification suggestions; and QS: providing data, data processing, related works.
YW, XZ, SL, and QS were employed by the company Yunnan Power Grid Co., Ltd.
XW, XS, and WZ were employed by the company Beijing Tsintergy Technology Co., Ltd.
All claims expressed in this article are solely those of the authors and do not necessarily represent those of their affiliated organizations, or those of the publisher, the editors, and the reviewers. Any product that may be evaluated in this article, or claim that may be made by its manufacturer, is not guaranteed or endorsed by the publisher.
The Supplementary Material for this article can be found online at: https://www.frontiersin.org/articles/10.3389/fenrg.2023.1162122/full#supplementary-material
Bao, Y., Xinyuan, L., Huiping, Z., Zhi, C., Han, B., and Xiaojing, H. (2022). “Electricity spot market design considering accurate security check,” in 2022 4th international conference on power and energy technology (ICPET) (IEEE).
Cai, Z., Zhang, G., Wang, M., Zhang, C., Sun, Y., and Sun, Y. (2022). Collaborative security check and correction of regional and provincial power grids under the environment of power market[J]. Proc. CSEE, 1–11.
Chen, Y., Fan, X. U., Zhang, W., and Wang, C. (2022). Research on reserve allocation of novel power system facing energy security and the corresponding preservation criterion[J]. Proc. CSU-EPSA 34 (4), 32–40.
Duan, Q., Xie, X., Tang, X., and Zhu, C. (2022). Multi-stage robust clearing model considering renewable energy output uncertainty and unit effective reserve calculation in electricity market[J]. Front. Energy Res. 10, 1–2.
Fang, K., Ke, D., Sun, Y., Wu, H., Shen, Y., and Gong, L. (2022). Grid optimal dispatching model considering stability constraints of large-scale HVDC infeed[J]. South. Power Syst. Technol. 16 (7), 1–9.
Fang, X., Yang, Z., Yu, J., Zou, P., Zhao, W., and Lai, X. (2020). Theoretical analysis and extension of locational marginal price[J]. Proc. CSEE 40 (2), 379–390.
Fang, X., Yang, Z., Yu, J., Zou, P., Zhao, W., and Lai, X. (2020). Theoretical Analysis and Extension of Locational Marginal Price[J]. Proceedings of the CSEE 40 (2), 379–390.
Hou, Y., Ding, Y., Bao, M., Liang, Z., Song, Y., and Guo, C. (2022). Analysis of Texas blackout from the perspective of electricity-gas coupling and its enlightenment to the development of China's new power system[J]. Proc. CSEE.
Li, L., Lin, W., Yang, Z., Yu, J., Xia, S., and Wang, Y. (2020). Characterizing a tie-line transfer capacity region considering time coupling in day-ahead multi-period dispatch[J]. Power Syst. Prot. Control 48 (23), 64–72.
Liu, S., Yan, Y. A. N. G., Yang, Z., and Chen, Q. (2023). Reserve capacity determination and its cost allocation considering stochastic characteristics of renewable energy[J]. Automation Electr. Power Syst. 47 (4), 10–18.
Peng, C., Gu, H., Zhu, W., Xu, D., Zhao, W., Xia, Q., et al. (2020). Study on spot market clearing model of regional power grid considering AC/DC hybrid connection[J]. Power Syst. Technol. 44 (1), 323–331.
Ran, L. I., Wang, M., Yang, M., Wang, M., and Wang, W. (2022). Robust-stochastic reserve optimization considering uncertainties of failure probability and net load[J]. Automation Electr. Power Syst. 46 (6), 20–29.
Shen, J., Zhang, H., and Chen, Z. (2020). Optimization model of HVDC tie-line power considering reactive power control equipment action times[J]. South. Power Syst. Technol. 14 (12), 17–24.
Wang, J., Hao, L., Cai, Y., Shao, Y., and Song, Z. (2022). Day-ahead joint clearing model of electric energy and reserve auxiliary service considering flexible load[J]. Front. Energy Res. 10, 1–2.
Wenhuan, H. A. O., Chen, Yefu, Qiu, D., Meng, Z., Yu, Z., Dong, K., et al. (2022). Research on deduction algorithm for limited power system reserve capacity network[J]. Electr. Eng. (9), 12–14.
Wu, K., Wang, J., Wei, L. I., and Zhu, Y. (2019). Research on the operation mode of new generation electric power system for the future energy internet[J]. Proc. CSEE 39 (4), 966–979.
Xu, D., Huang, H., Cheng, Q., Hu, X., and Tang, J. (2023). Generation-reserve two-staged joint optimization model for interconnected power grid considering security risks[J]. Power Syst. Technol. 47 (2), 624–637.
Yang, X., Luo, J., Chen, Y. U., Xie, D., Ge, R., and Feng, C. (2020). Review of power system reserve configuration and optimization for large-scale renewable energy integration[J]. Electr. Power Eng. Technol. 39 (1), 63. 10-20.
Zhang, Q., Zhang, L., Xiao, Y., Dai, X., and Lai, X. (2020). Design of south China (starting from guangdong province) power reserve market[J]. Electr. Power 53 (9), 28–37.
Keywords: power market, safety checks, effective reserve, tie-line optimization, power grid congestion
Citation: Wu Y, Wanyan X, Su X, Zou W, Zhu X, Liu S and Shao Q (2023) A safety check method to maximize the effective reserve by optimizing the power of the tie-line in the power market. Front. Energy Res. 11:1162122. doi: 10.3389/fenrg.2023.1162122
Received: 09 February 2023; Accepted: 29 March 2023;
Published: 17 April 2023.
Edited by:
IMR Fattah, University of Technology Sydney, AustraliaReviewed by:
Dejian Yang, Northeast Electric Power University, ChinaCopyright © 2023 Wu, Wanyan, Su, Zou, Zhu, Liu and Shao. This is an open-access article distributed under the terms of the Creative Commons Attribution License (CC BY). The use, distribution or reproduction in other forums is permitted, provided the original author(s) and the copyright owner(s) are credited and that the original publication in this journal is cited, in accordance with accepted academic practice. No use, distribution or reproduction is permitted which does not comply with these terms.
*Correspondence: Xingxing Wanyan, d2FueWFuMTYzQGZveG1haWwuY29t; Shuangquan Liu, TGl1c2h1YW5ncXVhbkB5bi5jc2cuY24=
Disclaimer: All claims expressed in this article are solely those of the authors and do not necessarily represent those of their affiliated organizations, or those of the publisher, the editors and the reviewers. Any product that may be evaluated in this article or claim that may be made by its manufacturer is not guaranteed or endorsed by the publisher.
Research integrity at Frontiers
Learn more about the work of our research integrity team to safeguard the quality of each article we publish.