 Kun Sheng1
 Zhuo Zeng
 Yujie Wu
- 1State Grid Hunan Electric Power Company Limited, Changsha, China
- 2State Grid Hunan Electric Power Company Limited Economic and Technical Research Institute, Changsha, China
- 3College of Electrical and Information Engineering, Hunan University, Changsha, China
1 Introduction
Power grid infrastructure planning schemes are usually affected by various investment risks in the construction duration, such as financial risks (Ammar and Eling, 2015; Zhao et al., 2022), power demand changes (Li et al., 2022; Yang et al., 2022), and extreme climates (Cao et al., 2022). Due to these investment risks, the actual completion date of power grid infrastructure projects may be delayed, and thus the electricity demand for load growth and renewable energy integration cannot be well satisfied (Dang et al., 2019). A few investigations have been reported in the literatures (Pan et al., 2022; Wu et al., 2022) to accurately predict the infrastructure project durations. For example, various prediction models with neural networks and multiple linear regression methods based on historical infrastructure planning data were presented for project duration forecasting (Pan et al., 2022). However, the investment risks affecting the planned infrastructure projects are neglected, and these risks are important factors for the construction duration prediction problem. Therefore, this paper aims to offer insightful opinions and discussions on the power grid infrastructure planning and project duration prediction problems with investment risks.
The main contributions of this paper are twofold as listed: 1) a multi-factor risk evaluation model was formulated based on program evaluation and review technique (PERT) for power grid infrastructure planning under financial risk, extreme climates, and electricity demand changes. Various curve features are extracted from historical infrastructure project schedules using Tsfresh tool, and vital risk features are identified based on a feature filtering method; 2) a project duration prediction method is proposed based on Bayesian neural network (BNN) considering multi-factor investment risks to formulate the occurrence probability of infrastructure project delay, and hence the deferred duration of different infrastructure projects can be quantified for smart grid planning.
2 Risk factors affecting power grid infrastructure planning
In the implementation process of power grid infrastructure planning, there are various internal and external risk factors such as financial risks, electricity demand variations, and extreme weather events (Ammar and Eling, 2015). First, power grid infrastructure planning is greatly affected by financial risks, such as the movement of interest rates, exchange rates, and cash flows. Second, due to the grid integration of massive electric vehicles with charging behavior uncertainties, electricity demand variations are inevitable (Castillo et al., 2022). Third, there are various weather risks such as hurricanes, cold snaps, rainstorms, heat waves, and thunderstorms battered power grid infrastructure planning (Cao et al., 2022). The occurrence of significant infrastructure project delay may lead to severe financial losses even if the infrastructure project itself does not sustain physical damage. As a result, based on the PERT, to quantify investment risk factors, the impact of each risk factor can be determined through Monte Carlo simulation (Quah and Quek, 2007; Cheng et al., 2021). In summary, the triangular distribution can be given for a multi-factor risk evaluation model to formulate the occurrence probability of financial risks, electricity demand variations, and extreme climates in this paper.
3 Feature extraction of infrastructure project schedules
Infrastructure project schedules can be characterized by investment and construction completion rate curves. Hence, Tsfresh and feature filtering methods are used to identify vital sequential features affecting power grid infrastructure planning from investment and construction completion rate curves (Ehya et al., 2022). Based on hypothesis testing, the feature filtering method is applied to evaluate the correlation between the project duration
where
Hence, more than 200 vital sequential features consisting of dynamic time-warping (DTW) distance, linear least-squares regression, time lagged cross correlation (TLCC), Spearman correlation coefficient, and enclosed area between investment and construction completion rate curves can be identified based on the feature filtering method for the project duration prediction method. Furthermore, in order to investigate the coordination degree of investment and construction completion schedules, the curve coordination degree of sequential features is proposed as follows:
where
Meanwhile, it can be found that infrastructure projects with critical features, including higher voltage levels, larger planning capacities, location in backcountry areas, and hysteretic investment, tend to result in higher delay risks.
4 Deep learning-driven project duration prediction with investment risks
Due to various investment risk factors affecting the power grid infrastructure planning, the project duration prediction problem can be transformed into a probabilistic forecasting model. Consequently, a deep learning-driven Bayesian method (Jia et al., 2021) is proposed to formulate the occurrence probability distribution of infrastructure project delay and quantify the deferred duration of different projects under diverse investment risks. The BNN algorithm can learn from the historical data of project duration and respond to changes in future variables with credibility. With conducting deep learning model training, the internal relationship between risk factors and infrastructure duration from historical data can be found efficiently.
The BNN structure is made up of input layer, hidden layer, and output layer. The hidden layer is a probability layer, while the weight
• implementing the tri-layer BNN structure to formulate a deep learning-driven project duration prediction model with identified sequential features and investment risk factors as input data.
• training the BNN prediction model for exploring the non-linear relationship between sequential feature input data and project duration to determine the posterior distribution of weights.
• using historical project delay data of power grid infrastructure planning to verify the validity of the proposed model and obtain the duration delay probability distribution results.
With the proposed project duration prediction model, the power grid infrastructure projects data
Variational inference is introduced into network training to obtain the posterior distribution
where
In this paper, historical power grid infrastructure projects in Hunan, China, are presented to validate the effectiveness of the proposed project duration prediction method with multi-factor investment risks. The posterior distribution of weights in the BNN-based duration prediction model varies with the probability of risk occurrence. Then, the occurrence probability distributions of project duration delay under different investment risks can be extracted from a large amount of sampling data from Monte Carlo analysis, and the resulting project delay probability distributions are shown in Figure 1.
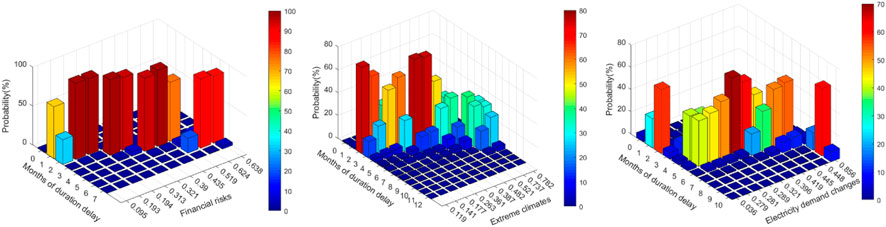
FIGURE 1. Occurrence probability distributions of infrastructure project delay under different risk factors.
In Figure 1, it can be found that number of delay months is increased with the growing investment risk. On the other hand, the delay months of infrastructure projects under financial risk usually have a small standard deviation, and the project delay probability under extreme climate is the highest. The results show that the number of delay months can reach 10 months, and this is because electricity demand changes will lead to variation in design processes and technologies.
5 Discussion and conclusion
Based on the statistical analysis of practical infrastructure projects data in Hunan, China, the following are the key findings of this study: 1) the project delay is more likely to occur in backcountry, and the delay rate can be up to 43%; 2) risk of infrastructure project delay rises as the voltage level increases. The delay rates with voltage levels 35 kV, 110 kV and 220 kV are 26%, 29%, and 35%, respectively; 3) timely investment will accelerate the construction rate of infrastructure projects, thereby reducing the probability of delay; 4) the larger the planning capacity is, the lower the degree of timely investment will be. Risk of infrastructure project delay decreases as the curve coordination degree increases; and 5) further research will focus on the diversity of investment risk factors and combined effects of multiple risk factors on power grid infrastructure planning.
Author contributions
Conceptualization, KS and CX; data curation, JS and YL; formal analysis, ZZ; methodology, YW; visualization, CL and LC; writing—original draft, JS and ZZ; writing—review and editing, KS.
Funding
This work is supported by the State Grid Science and Technology Project (no. 5100-202123009A).
Conflict of interest
Authors KS and CX were employed by State Grid Hunan Electric Power Company Limited. Authors JS, YL, CL, and LC were employed by State Grid Hunan Electric Power Company Limited Economic and Technical Research Institute.
The remaining authors declare that the research was conducted in the absence of any commercial or financial relationships that could be construed as a potential conflict of interest.
Publisher’s note
All claims expressed in this article are solely those of the authors and do not necessarily represent those of their affiliated organizations, or those of the publisher, the editors, and the reviewers. Any product that may be evaluated in this article, or claim that may be made by its manufacturer, is not guaranteed or endorsed by the publisher.
References
Ammar, S. B., and Eling, M. (2015). Common risk factors of infrastructure investments. Energy Econ. 49, 257–273. doi:10.1016/j.eneco.2015.01.021
Cao, Y., Zhou, B., Chung, C. Y., Shuai, Z., Hua, Z., and Sun, Y. (2022). Dynamic modelling and mutual coordination of electricity and watershed networks for spatio-temporal operational flexibility enhancement under rainy climates. IEEE Trans. Smart Grid, 1. doi:10.1109/TSG.2022.3223877
Castillo, Z. V., de Boer, H.-S., Muñoz, R. M., Gernaat, D. E. H. J., Benders, R., and van Vuuren, D. (2022). Future global electricity demand load curves. Energy 258, 124741. doi:10.1016/j.energy.2022.124741
Chen, J., Yang, M., Gong, W., and Yu, Y. (2022). Multi-neighborhood guided kendall rank correlation coefficient for feature matching. IEEE Trans. Multimedia, 1–15. doi:10.1109/TMM.2022.3217410
Cheng, F., Lin, M., Yüksel, S., Dinçer, H., and Kalkavan, H. (2021). A hybrid hesitant 2-tuple IVSF decision making approach to analyze PERT-based critical paths of new service development process for renewable energy investment projects. IEEE Access 9, 3947–3969. doi:10.1109/ACCESS.2020.3048016
Dang, C., Wang, X., Shao, C., and Wang, X. (2019). Distributed generation planning for diversified participants in demand response to promote renewable energy integration. Prot. Control Mod. Power Syst. 7, 1559–1572. doi:10.1007/s40565-019-0506-9
Ehya, H., Skreien, T. N., and Nysveen, A. (2022). Intelligent data-driven diagnosis of incipient interturn short circuit fault in field winding of salient Pole synchronous generators. IEEE Trans. Industrial Inf. 18 (5), 3286–3294. doi:10.1109/TII.2021.3054674
Jia, X., Yang, J., Liu, R., Wang, X., Cotofana, S. D., and Zhao, W. (2021). Efficient computation reduction in bayesian neural networks through feature decomposition and memorization. IEEE Trans. Neural Netw. Learn. Syst. 32 (4), 1703–1712. doi:10.1109/TNNLS.2020.2987760
Li, X., Liu, C., Sheng, K., Wen, B., Xie, H., Zhao, W., et al. (2022). A multi-level investment demand assessment model for renewable-dominated power system planning. Front. Energy Res. 9. doi:10.3389/fenrg.2021.807590
Pan, Y., Chen, S., Ma, T., Gao, J., Wang, C., Liu, X., et al. “Research on project duration prediction based on multiple linear regression,” in 2022 IEEE 5th International Electrical and Energy Conference (CIEEC), Nanjing, China, May, 2022, 1606–1612. doi:10.1109/CIEEC54735.2022.9846374
Quah, K. H., and Quek, C. (2007). Mces: A novel Monte Carlo evaluative selection approach for objective feature selections. IEEE Trans. Neural Netw. 18 (2), 431–448. doi:10.1109/TNN.2006.887555
Thiagarajan, P., Khairnar, P., and Ghosh, S. (2022). Explanation and use of uncertainty quantified by bayesian neural network classifiers for breast histopathology images. IEEE Trans. Med. Imaging 41 (4), 815–825. doi:10.1109/TMI.2021.3123300
Wu, Y., Li, X., Zhang, L., Liu, C., Zhao, W., and Zhang, T. (2022). Machine learning-driven deduction prediction methodology for power grid infrastructure investment and planning. Front. Energy Res. 10. doi:10.3389/fenrg.2022.893492
Yang, Q., Li, Z., Chen, Y., Zhu, Y., and Dou, Q. (2022). An investment efficiency evaluation model for distribution network with distributed renewable energy resources. Front. Energy Res. 10. doi:10.3389/fenrg.2022.931486
Zhang, C., Bütepage, J., Kjellström, H., and Mandt, S. (2019). Advances in variational inference. IEEE Trans. Pattern Analysis Mach. Intell. 41 (8), 2008–2026. doi:10.1109/TPAMI.2018.2889774
Keywords: deep learning, duration prediction, feature extraction, investment risk, power grid planning
Citation: Sheng K, Xie C, Sha J, Zeng Z, Liu Y, Lei C, Chen L and Wu Y (2023) Opinions on power grid infrastructure planning with investment risks. Front. Energy Res. 11:1162068. doi: 10.3389/fenrg.2023.1162068
Received: 09 February 2023; Accepted: 30 March 2023;
Published: 18 April 2023.
Edited by:
Liansong Xiong, Xi’an Jiaotong University, ChinaReviewed by:
Xiaokang Liu, Polytechnic University of Milan, ItalyZiqing Zhu, Hong Kong Polytechnic University, Hong Kong SAR, China
Copyright © 2023 Sheng, Xie, Sha, Zeng, Liu, Lei, Chen and Wu. This is an open-access article distributed under the terms of the Creative Commons Attribution License (CC BY). The use, distribution or reproduction in other forums is permitted, provided the original author(s) and the copyright owner(s) are credited and that the original publication in this journal is cited, in accordance with accepted academic practice. No use, distribution or reproduction is permitted which does not comply with these terms.
*Correspondence: Jian Sha, NTQ0NzY1NzcxQHFxLmNvbQ==