 Cheng Chen
 Long Wang
 Muhua Niu3
94% of researchers rate our articles as excellent or good
Learn more about the work of our research integrity team to safeguard the quality of each article we publish.
Find out more
ORIGINAL RESEARCH article
Front. Energy Res., 17 March 2023
Sec. Wind Energy
Volume 11 - 2023 | https://doi.org/10.3389/fenrg.2023.1160423
This article is part of the Research TopicAdvances in Wind Turbine Rotor DesignView all 8 articles
Introduction: The blade is one of the most important parts of a wind turbine. Blade design is a complicated process involving many design links and mutual couplings. To efficiently obtain the Pareto Front and optimal blade, a novel methodology combined the improved NSGA-II with Thin-Walled Beam Theory and Classic Laminated Theory has been developed.
Methods: In the optimization study, the design parameters are the thickness distribution of the spar cap and a parametric model based on blade production process is developed. The objective function is on the minimization of mass and the maximization of flap-wise stiffness. As a practical engineering application research, a 15 MW wind turbine IEA-15-240-RWT developed by NREL is used as a reference model.
Results: Laws on the number of variables, blade profiles, design loads and natural frequencies present in the design have been studied through Pareto fronts obtained from multi-objective optimization results.
Discussion: These laws have important implications for practical engineering design work. Meanwhile, the results show that the new methodology is effective for blade structure design, and that this approach can be easily extended to study the design of influence laws for more design parameters or more complex blade design problems.
With the depletion of fossil fuel reserves and global pollution, the need for wind power will increase further (Hu et al., 2012; OZkan et al., 2020). Wind turbine blade length has increased dramatically in recent years in an effort to reduce the cost of energy (COE), increase the efficiency of wind energy, and benefit from the availability of better materials. Increasing the size of the wind turbine blade is inevitably accompanied by an increase in its load, weight, and cost. The optimal blade design has become the goal pursued by more and more wind power enterprises. The design of the wind turbine blades, however, has become one of the most difficult parts of the design. The complexity and difficulty is mainly reflected in the fact that wind turbine blade design is a multi-objective, multi-parameter, strongly coupled design process. See Figure 1.
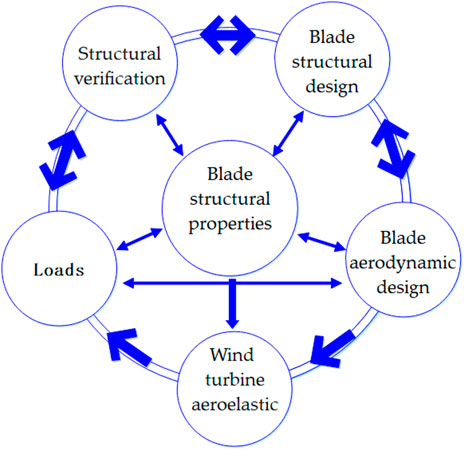
FIGURE 1. Schematic diagram of coupling relation in structural design.
With regard to the characteristics of wind turbine blade design, many scholars and researchers have proposed to apply genetic algorithm (GA) to blade design and obtained rich research results. In the application of genetic algorithm to wind turbine blade design research, in 2011, Wang (Wang et al., 2011) improved non-dominated sorting genetic algorithm (NSGA-II) by dynamic crowding distance and used this algorithm to optimize the blades of a 1.5 MW wind turbine by two-objective, three-objective and four-objective design. The feasibility and universality of this algorithm in multi-objective optimization of wind turbine blades are verified. Tenguria et al. (2013) evaluated a blade 38.95 m long designed for a horizontal wind turbine V82-1.65 MW. ANSYS software was used to evaluate the finite element of the designed blade. ANSYS results are compared to experimental work. In 2015, Based on multi-objective genetic algorithm NSGA-II and Finite Element Method (FEM), Gao et al. (2015) carried out aerodynamic and structural coupling optimization design for 1.5 MW wind turbine blades and used fuzzy evaluation method to select the best design scheme under the specific working conditions. The parameters of blade structure design took into account the thickness of a few areas of the spar cap. In 2017, Wang et al. (2017) used the improved NSGA-II for the optimal design of 5 MW wind turbine blades with the maximum power coefficient and minimum blade mass as the optimization objectives, and compared the results with multi-objective differential evolution algorithm to verify the reliability and adaptability of the improved algorithm. The parametric model of structure expressed by polynomial is adopted in this study.
In the multi-objective optimization of wind turbine blade comprehensive re-search, Lee et al. (2018) performed fluid-structure interaction (FSI) analyses to achieve structural reactions of a blade on National Renewable Energy Laboratory (NREL) Phase VI wind turbine using ANSYS. In 2018, Albanesi et al. (Albanesi et al., 2018) combined GA with the Inverse FEM (IFEM) to redesign a medium-power 40-kWwind turbine blade to re-duce its weight and the optimal ply-order, ply-number and ply-drop configuration of laminate wind turbine blades was determined by this methodology. In 2019, With Annual Energy Production (AEP) and blade mass as objective functions, and aerodynamic parameters and structural parameters as design variables, Meng and Xie (2019) established a multi-objective optimization model of wind turbine blades based on the para-metric finite element model of blades and carried out optimization design using genetic algorithm, in which structural parameters took the thickness of spar cap as the main optimization variables. Later in 2021, Zkan and Gen (2021) applied the study of multi-objective structural optimization to the production of Phase II wind turbine blades in the NREL to obtain more efficient small wind turbines. In the optimization study, the objective function is the minimization of blade mass and cost, the design parameters are the composite material type and the number of spar cap layers, and the flow and structure analysis of the blade is performed using the fluid-structure coupling model in ANSYS.
As it can be seen, NSGA-II having excellent performance in wind turbine blade optimization studies was also used for the structural optimization problem and the structural analysis method used in the research of blade optimization design is mainly FEM. The FEM consumes a lot of computing resources in the multi-objective optimization design of structure, and the computing efficiency is affected by the configuration of hardware and software, so it has no obvious advantage in the application of optimization design in practical engineering.
In this study, in order to make the optimization results more instructive to blade design, a parametric model based on blade production process is developed. The NSGA-II is improved with elite strategy to improve the global convergence of complex problems. A novel methodology combined the improved NSGA-II with Thin-Walled Beam Theory (TWBT) and Classic Laminated Theory (CLT) is presented. To reveal the significance and value of the method for wind turbine blade design, the IEA-15-240-RWT wind turbine and blade developed by NREL are taken as the reference model, the spar cap of the blade is taken as the research object, the minimum mass and maximum stiffness of the blade are taken as the design objectives. Pareto Front (PF) (Samui et al., 2017) was obtained by multi-objective optimization results. The influence law of design variables and design conditions on the design of the blade spar cap is revealed by PF, as the multi-objective design boundaries are clearly shown. The influence law obtained in this study has practical guiding significance for blade design engineering; on the other hand, this method can be easily extended to the design study of the influence law study of more design parameters or more complex blade design problems.
The structure design of wind turbine blade is one of the important parts of wind turbine design. Design load is an important input to blade design and is statistically obtained around the operating environment and working condition of wind turbine. The design load in this study is derived from the aero-elastic simulation of the reference model IEA-15-240-RWT. The setting of wind turbine parameters and working conditions is detailed in the literature (Gaertner et al., 2020).
The simulation model of the whole wind turbine system is established in OpenFAST (NREL, 2023) developed by NREL. Wind model and wind file generation is done in Turbsim (Jonkman and Buhl, 2006). The control strategy of wind turbine operation is to complete the tuning and generate DLL files in ROSCO (Abbas et al., 2021). After debugging the whole system, the aero-elastic simulation of wind turbine is carried out with OpenFAST as the driver. The resulting ultimate design load is shown in Figure 2 below.
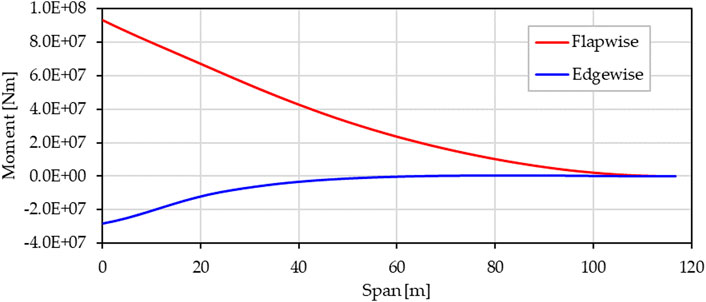
FIGURE 2. The resulting ultimate design load.
In the following subsections, the parametric model of blade structure, the structural analysis method and the improved NSGA-II method are introduced respectively.
In this study, the original model parameters are derived from the ANSYS model of IEA-15-240-RWT. The blade is 117 m long and profile of the blade is designed based on DTU FFA-W3 series of airfoils. Similar to the structure of the traditional wind turbine blade, the blade is made of two shells and two webs. The components in the shell include skin, root reinforcing layers, spar caps, trailing edge UD, filler core material, etc. See Table 1 and Figure 3 for details. It can be seen from the thickness distribution that the spar cap is the thickest, and the spar cap design plays an important role in blade structure design.
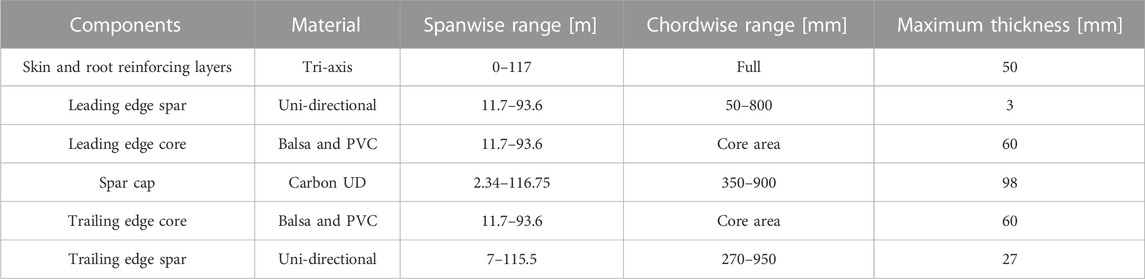
TABLE 1. The data of components in the shell.
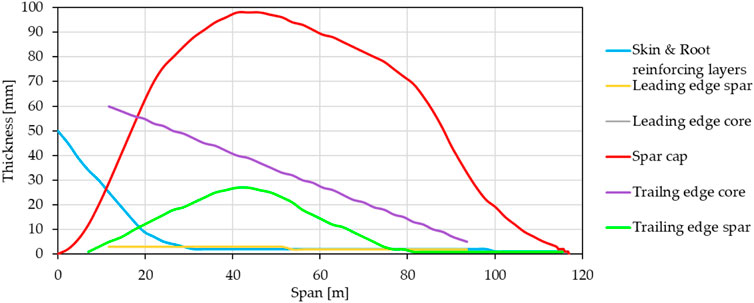
FIGURE 3. Thickness distribution of each component.
To perform multi-objective optimization of wind turbine blade structure design, a parametric model of span-thickness based on the production process has been developed. The spar cap is made of a unidirectional fiberglass of equal width, laid on top of each other, with the longest fiberglass at the bottom and the shortest at the top. This makes the spar cap thin at the root and tip and thick in the middle. The lay-up characteristics of the spar cap are as follows:
• A minimum thickness of 1 mm is required for it to be fixed at the starting position of the blade root (Lr) and the ending position of the blade tip (Lt);
• There is a region with equal thickness in the middle of spar cap, with the thickest thickness;
• The thickness of the blade root region decreases monotonically toward the blade root, while the thickness of the blade tip region decreases monotonically toward the blade tip.
On the basis of the above assumptions, a parameterized model has been developed, in which the spar cap is determined by a finite number of control points in the span-thickness coordinate system. As required, parametric models with different numbers of parameters can be generated. The parameterized model of the spar cap is illustrated in Figure 4 with 3, 5, 7, 11 variables and the constraints of the variables, respectively.
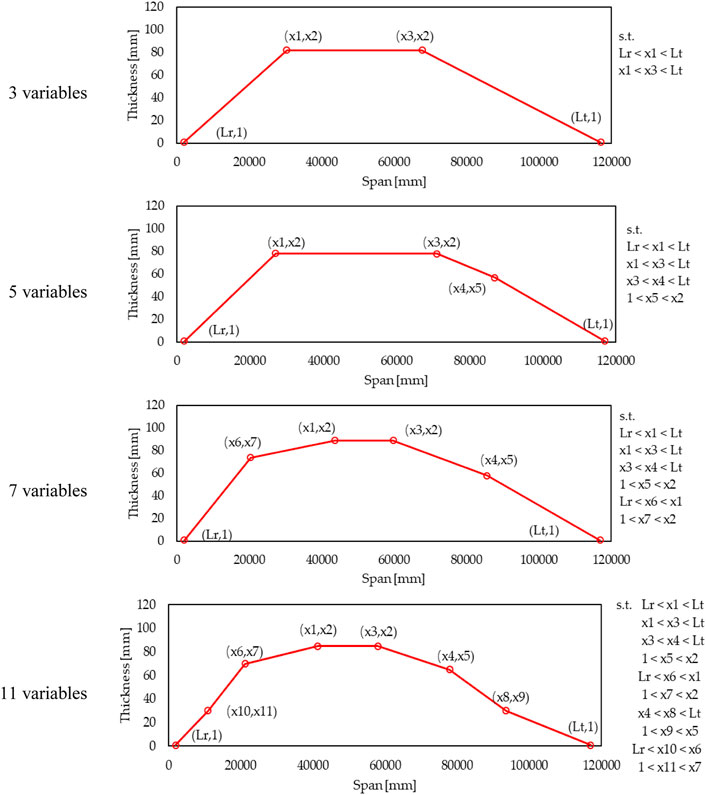
FIGURE 4. Parameterized models of spar cap and constraint of variables.
This parametric model has many advantages when used for research. Since this model is based on the production process, the results can be used for bladed design directly. Furthermore, since the number of variables can be adjusted according to needs, it is possible to study parameter setting rules in different design problems.
The structural properties of the blade and its structural response under load are calculated using the Thin-Walled Beam Theory (TWBT) and Classic Laminated Theory (CLT) (Librescu and Song, 2006), which are effective for thin wall composite beam structure. Based on this theory, several design tools have been developed, such as Precomp (Bir and Migliore, 2001), Farob (Lekou and Philippidis, 2009) and CROSTAB (Lindenburg, 2008), among others. The schematic diagram of the theories is shown in Figure 5. The element of the beam reference surface loaded with membrane stress resultants is shown by the blue symbols and the loads acting on two ends of the beam element are shown by the red symbols. The axial displacement, rotation angles and curvatures of the element of the beam are represented by symbols
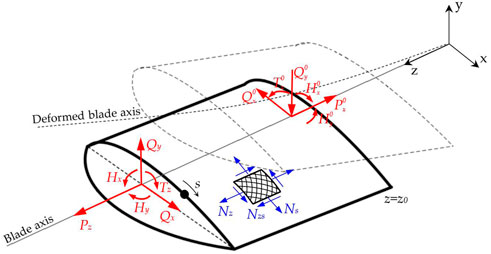
FIGURE 5. Schematic diagram of thin-walled beam theory and classic laminated plate theory.
The stiffness coefficients
where the stress and strain resultants be expressed as a function of the load at the beam end using the constitutive equations, the geometric equations and the equilibrium equations of beam and laminates.
In accordance with Castigliano’s theorem
the relation between loads and deformations of the beam elements can be expressed in the following explicit form (Vasiliev and Morozov, 2018).
In-plane displacements of the beam cross-section can be expressed as
Natural frequency of the blade is also the focus of this study, as they play an important role in aero-elastic response of the wind turbine. The Extended Galerkin Method (EGM) is used to solve the eigenvalue problem of blades. Take the twist, flap-wise bending, transverse shear coupled free vibration as an example. The eigenvalue problem is discretized by representing
where
Here
Expressing
We get from Eq. 8 the eigenvalue problem
where
and
Figure 6 shows the procedure of the improved NSGA-II algorithm and strategy. Different from the classical NSGA-II algorithm, the elite strategy and dynamic crowding distance are used to generate a new parent population for the next-generation.
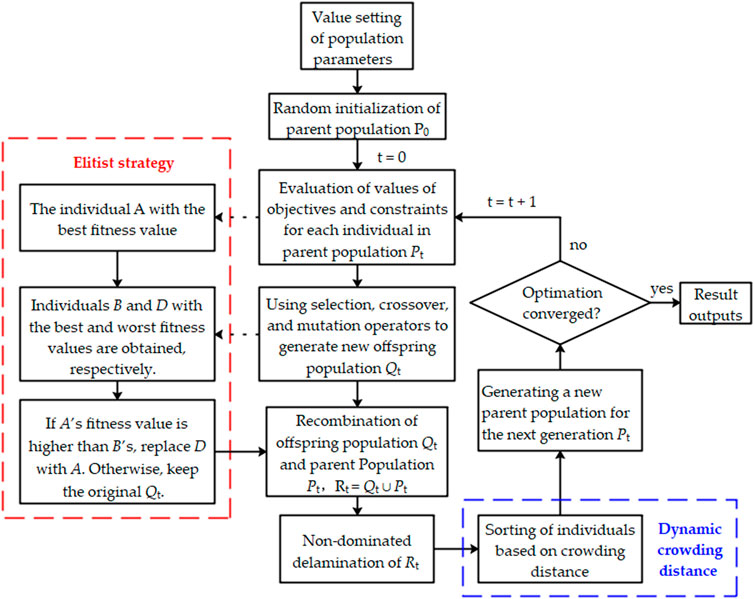
FIGURE 6. Procedure of the improved NSGA-II algorithm and strategy.
The basic idea of elitist strategy is to take the best individuals that have emerged in the evolutionary process of the group and copy them directly into the next-generation without mating. The elite individual is the one with the highest fitness value found by the genetic algorithm so far in the evolution of the population. It has the best genetic structure and excellent properties. Crossover and mutation operators may disrupt the implicit high-order, long-distance and high-average fitness schema in individuals, which may lead to the loss of optimal individuals in the current population in the next-generation, and this loss of optimal individuals will occur repeatedly during evolution. In order to prevent the loss of the elite of the current population in the next-generation and the failure of the genetic algorithm to converge to the global optimal solution, it is necessary to ensure that the elites will not be lost or disrupted by selection, crossover and mutation operations during the evolution of the genetic algorithm. The elite strategy plays an important role in improving the global convergence ability of the genetic algorithm. Rudolph (Rudolph, 1994) has proved theoretically that the classical genetic algorithm with elitist strategy is globally convergent.
The specific operation process of elite strategy is to reserve an optimal individual A from the parent generation, then select, cross and mutate to generate a new population. Then, find out the best individual B and the worst individual D in the new population. If the fitness value of the best individual B is higher than that of A, it means that the population has evolved. Otherwise, the worst individual D will be replaced by A and a new offspring will be produced.
Maintaining population diversity requires not only a certain spatial distance between individuals, but also a good consistency of non-dominant sets. In the classical NSGA-II, the crowding distance DCi is used to evaluate the distribution between individuals, and it is shown as follows:
where
To improve the uniformity of the individual distributions, a Dynamic Crowding Distance (DCD) approach proposed by Luo (Luo et al., 2008) is used here. The DDCi is calculated as follows:
where
is the variance of crowding distances of the individuals that are the neighbors of the ith individual.
Hyper volume indicator IHV (Bader and Zitzler, 2011), which is defined as the volume of hyper cubes in the objective space included in optimal solution sets S and reference points r* = (r1*, r2*,…, rm*), is introduced to quantify optimal solutions, as shown below:
where VOL (•) represents the Lebesgue measure. IHV is a key indicator for the convergence and distribution of optimal solutions.
DTLZ (Deb, 2005) and WFG (Huband et al., 2006) test functions are used to verify the performance of the multi-objective optimization algorithm. The comparison between the optimization PF and the true PF shows that the improved optimization algorithm has good convergence. See Figure 7.
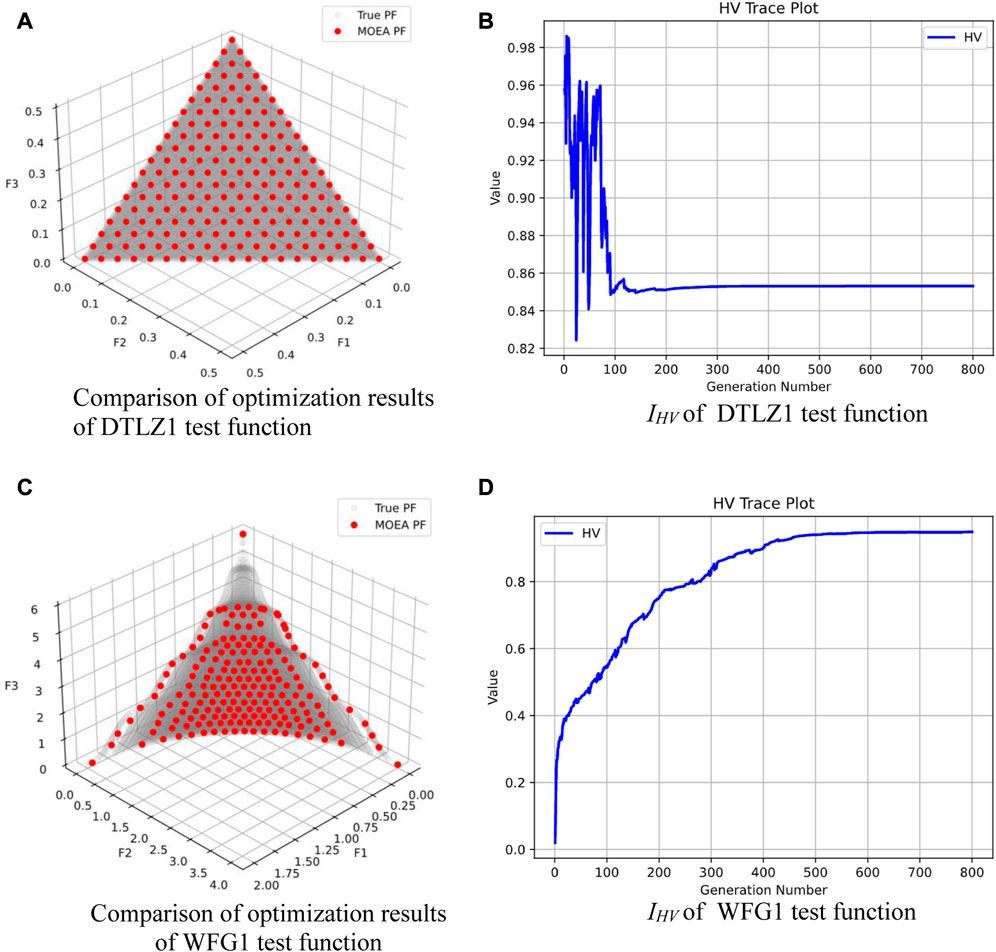
FIGURE 7. Comparison of optimization results of test functions. (A) Comparison of optimization results of DTLZ1 test function. (B) IHV of DTLZ1 test function. (C) Comparison of optimization results of WFG1 test function. (D) IHV of WFG1 test function.
In this paper, the minimum tip deformation at fixed load and the minimum blade mass, between which distinct conflicts exist, are chosen as two optimization objectives to validate the developed optimization algorithm and study the design law of blade structure, while the computational overhead is kept minimal.
The mass of a blade reflects the amount of material used, and to a certain extent, it can also reflect the material cost of the blade. Meanwhile, in the aerodynamic response of a wind turbine, the inertial load is closely related to the mass of the blade. In blade design, it is always desirable to keep the blade mass as small as possible. The linear mass mj of the jth element of blade can be easily obtained, so minimizing the blade mass is shown as the first optimization objective as follows:
Wind turbine blade is a typical slender composite material structure. Due to the irregular geometry and the irregular laminated structure of the blade, the stiffness of each section of the blade is not uniformly distributed, but the overall stiffness of the blade can be shown to a certain extent by the deformation of the blade. Blade deformation is calculated according to the method in Section 2.2. Blade stiffness is always expected to be maximized in blade design. Therefore, the minimum blade deformation is set as the second optimization objective here, as shown below:
The optimization design method and parametric model presented in Section 2 are used to perform 2-objective optimization on the basis of the reference blade. Other common optimization parameters are set to: the mutation probability is 0.6, and the crossover probability is 0.7. Optimize 20 generations with 100 individuals per generation. The mass and deformation of each individual blade are calculated using the structural analysis method described in Section 2.2. We obtained the optimization results of all parametric models and showed the results of the parametric models with seven variables in Figure 8. The horizontal coordinate represents the mass of the blade and the vertical coordinate represents the displacement of the blade tip section in the flap-wise direction.
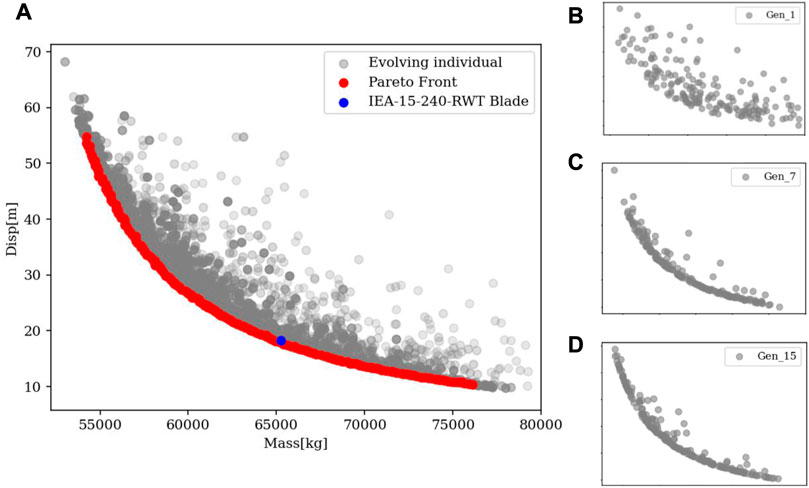
FIGURE 8. The results of the parametric models with seven variables. (A) The Pareto Front is compared with the reference blade. (B) The 1st-gen population. (C) The 7th-gen population. (D) The 15th-gen population.
The gray dots in Figure 8 represent individuals in the optimization process, which can be clearly observed in Figures 8B–D. The results in Figures 8B–D represents the population distribution of the 1st, 7th and 15th generations, respectively, and reflects the dynamical evolution process. PF is obtained from the non-dominated solutions in all optimization results and is represented by red dots. Under the action of ultimate load, the blade tip deformation of reference blade developed by NREL is 18.3 m and the mass is 65250 kg. It is shown in a blue dot in Figure 8A.
It can be seen from Figure 8A that PF of spar cap presents a smooth curve without obvious inflection point and the spatial distribution is homogeneous, that is, there are no distinct clusters and vacancies. The results show that the improved NSGA-II has suitable global convergence in the spar cap optimization. Meanwhile, the layup design of the reference blade is near to PF, indicating that the spar cap structure of the reference blade is very close to the optimal design under the same mass requirement. PF is very instructive for wind turbine blade design. Firstly, PF can give the optimal solution set under fixed design conditions, from which the appropriate blade design can be selected. Secondly, reasonable design requirements can be formulated based on the optimal solution set of PF.
Figure 9A shows the PF obtained by optimizing all parameterized models described in Section 2.1. It can be seen from the figure that the PF of parameterized models with different quantity of parameters almost overlaps. The subtle differences can probably be found in Figure 9B, which shows how IHV changes over the course of evolution. IHV is calculated from Eq. 17. The parameterized model of 3, 5, 7 and 11 variables when iterated to the 20th generation, the IHV values are 0.235, 0.231, 0.227 and 0.205 respectively. As described earlier, IHV is a key indicator for the convergence and distribution of optimal solutions and a large IHV indicates good approximation of the optimal solutions to PF and an excellent distribution of optimal solutions. The results show that the fewer the number of variables, the earlier convergence is achieved and the higher the value of IHV; conversely, the more the number of variables, the more the number of evolutionary iterations required for convergence, and the lower the value of IHV at the current given number of evolutionary iterations. But fewer parameters are not always better when it comes to blade design. It is still necessary to determine the appropriate number of parameters through quantitative analysis according to the design objectives, design constraints and design complexity.
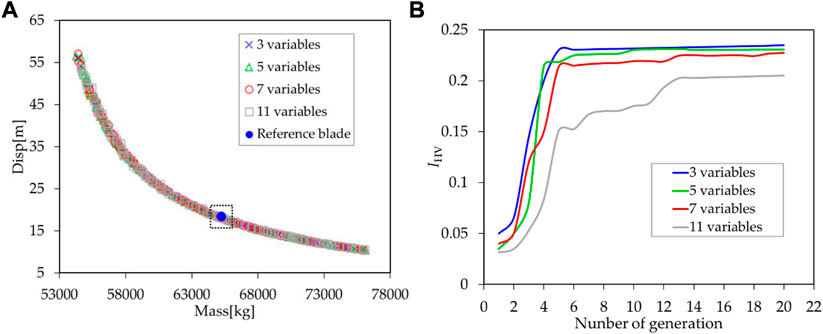
FIGURE 9. The Pareto Front and IHV of all parameterized models. (A) The PF results of various parameters are compared. (B) The hyper volume indicator of various parameters are compared.
Figure 10 shows the optimization results compared with the reference blade. Figure 10A is a partial enlargement of the area in the dotted box in Figure 9A. From the enlarged figure, it can be seen that the spar cap laying up of the reference blade does not reach the optimal solution. There is no significant advantage or disadvantage between the optimization results of different quantity variables. By comparison, the deformation of the reference blade can be reduced by 0.3 m with the same mass, accounting for 1.67% of the deformation of the reference blade. With constant deformation, the mass can be reduced by 190 kg, which is 0.3% of the reference blade mass. Figure 10B shows the comparison of spar cap layup thickness distributions between the optimized blade and the reference blade. It can be seen from the figure that the maximum thickness of the spar cap of the optimized blade is less than that of the reference blade. In addition, the more variables, the more continuous the thickness transition results can be obtained. And the transition of the spar cap thickness of the reference blade is the smoothest. However, In this optimization research, there is no direct correlation between the continuous and smooth thickness transition of spar cap and the quality of optimization results.
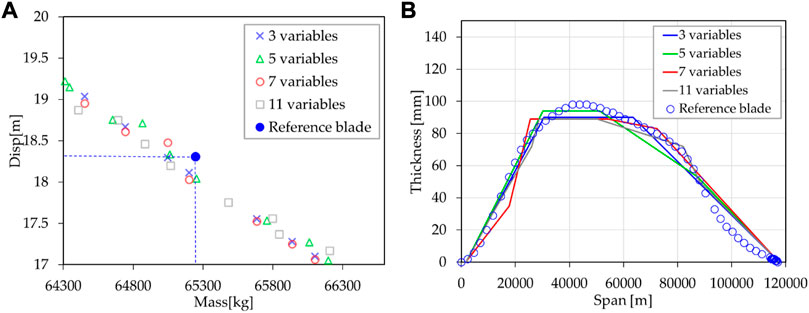
FIGURE 10. Comparison of optimization results with reference blade. (A) A larger view of the box in Figure 9A. (B) Comparison of thickness distribution of spar caps.
In the process of blade design, the requirement to reduce flap-wise deformations is often encountered. In addition to improving the flap-wise stiffness from the structure design itself, this can also be achieved by adjusting the shape and reducing the load. Figure 11 shows the effect of shape variation on PF. One way to change the shape is to scale the shape to the same scale as the chord length changes. As shown in Figure 11A, when the shape changes, the thickness and positioning of the layup remain unchanged, and only the thickness of the spar cap is taken as the optimization variable. PF obtained by optimization is shown in Figure 11B. When the blade mass is small, the influence is great, and with the increase of blade mass, the influence gradually decreases. The reference blade is used as the benchmark model, see Table 2 for specific data. This phenomenon is entirely explainable. It is well known that the moment of inertia of a beam section is proportional to the square of the distance. When the chord length increases, the absolute thickness of the section will be proportionally enlarged, so the stiffness of the section will naturally increase. Meanwhile, the expansion of the shape will increase the material consumption, and the smaller the initial mass, the larger the proportion of the increment of the same mass, resulting in upward PF rise. Conversely, a similar pattern occurs when the chord length decreases.
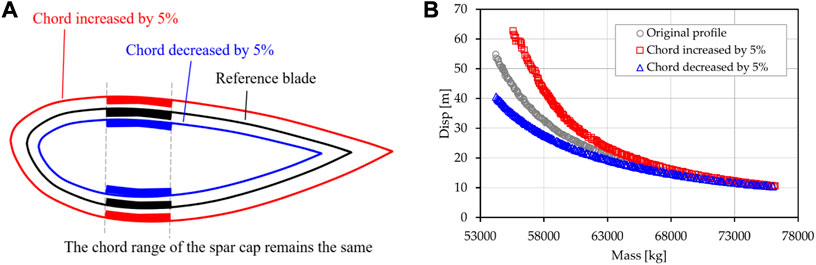
FIGURE 11. The effect of chord length variation on optimization results. (A) Diagram of a change in chord length. (B) The comparison of optimization results after the change of chord length.
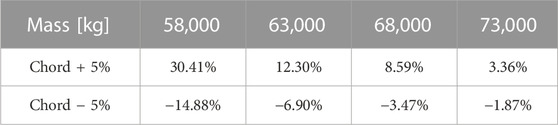
TABLE 2. The effect of chord length on stiffness under different masses.
The blade is divided into three regions on average: the root region, the middle region and the tip region, and the chord length of each region is increased independently. The effect of chord length on stiffness in different regions is shown in Figure 12. Figure 12A shows a comparison of PF in different situations. Based on the PF of the original shape, the result obtained after normalization of other PF is shown in Figure 12B. A positive ratio indicates a decrease in the efficiency of the structure.
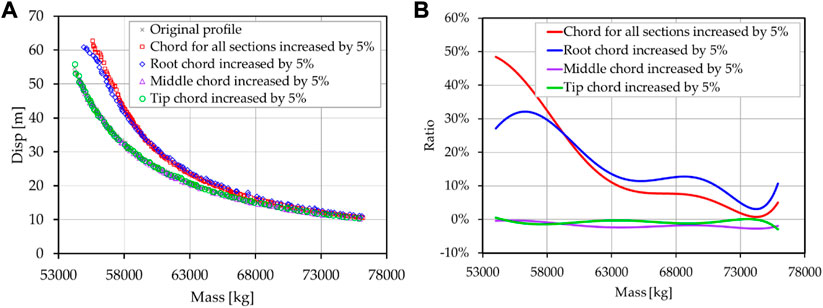
FIGURE 12. The effect of chord length on stiffness in different regions. (A) The comparison of PF results after changing chord length in three regions. (B) The comparison of normalized results.
It can be seen from the figure that the chord length of the blade root region has the most obvious influence on the PF of the blade, which reduces the efficiency of the blade structure. Increasing the chord length in the middle region can slightly increase the efficiency of the entire structure. Tip chord length change has little effect on the efficiency of the structure.
The influence of load on PF is also discussed. The design limit load is expanded by 5%, 10% and 5% respectively, with 10% as the external input of the design. The optimization results are shown in the Figure 13A. The PF curves shown in the figure appear to be parallel to each other. The PF curve of the reference blade is taken as the benchmark for normalization, as shown in Figure 13B. The results show that the effect of load on PF is linear.
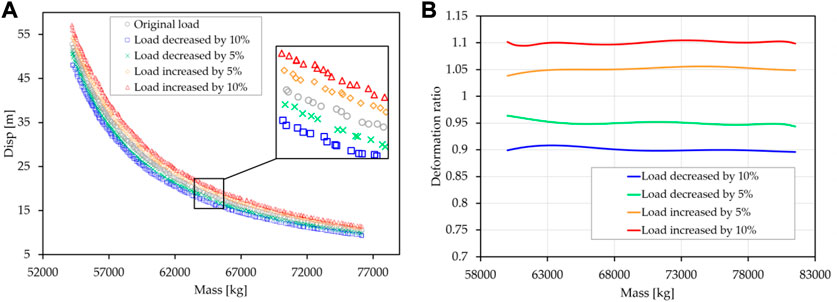
FIGURE 13. The effect of load on PF curves. (A) The comparison of PF results. (B) The comparison of normalized results.
In the analysis of aero-elastic response of wind turbines, blade frequency is an important design index in terms of aero-elastic stability and avoiding resonance. The 1st flap-wise frequency was calculated in the optimization process using the method in Section 2, and added into the displacement-mass coordinate system as the third axis. The results are shown in Figure 14D. In order to show the law of the result more clearly, the results were converted into the displacement-mass system, and the frequency values were displayed with color bar, as shown in Figure 14E. As can be seen from the figure, frequency is closely related to blade mass and stiffness, which can be expressed by the formula
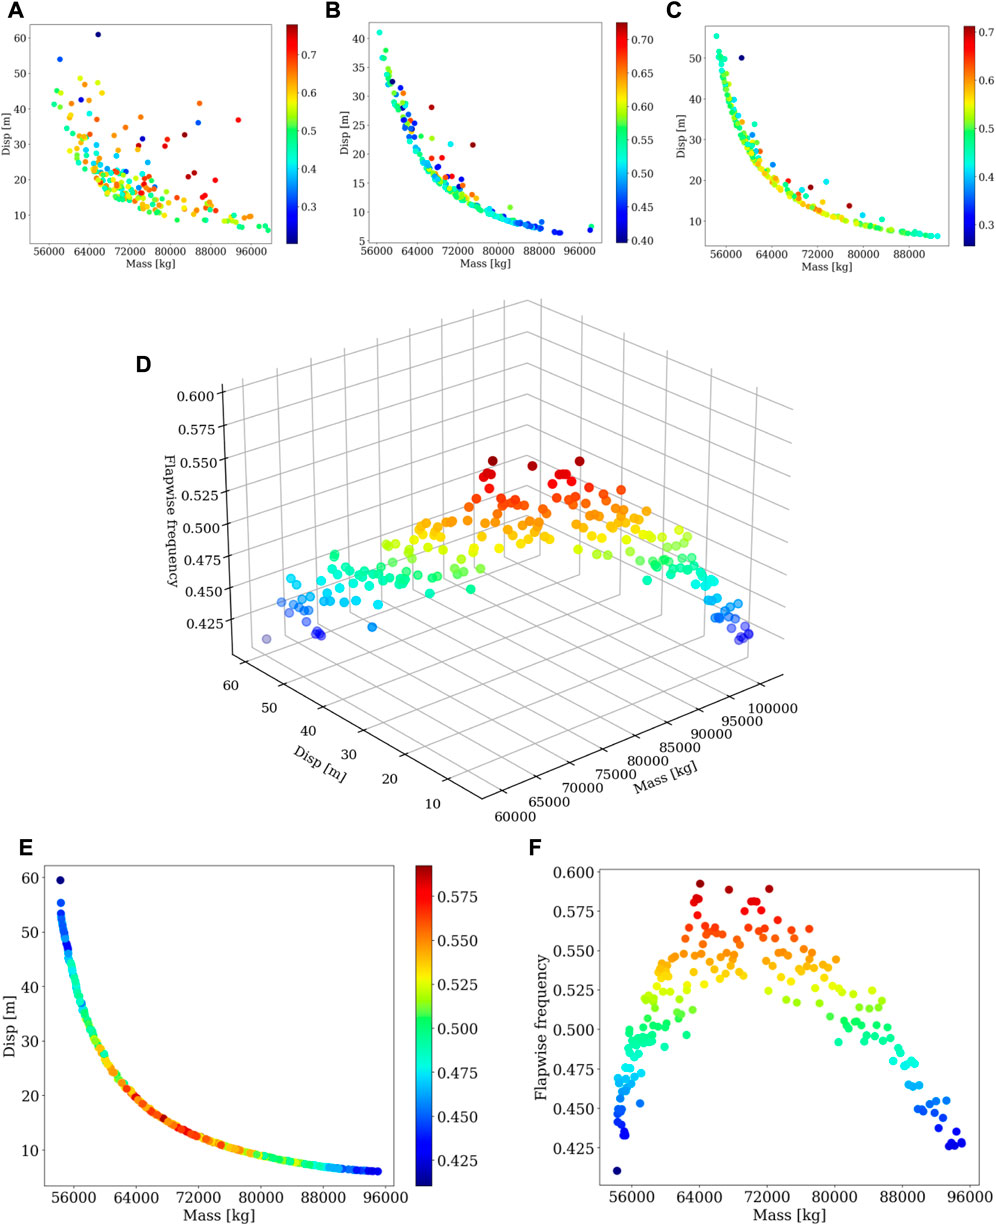
FIGURE 14. Optimization process and PF results with flap-wise frequency. (A) The 1st-gen population. (B) The 7th gen population. (C) The 15th gen population. (D) The results displayed in the 3D coordinate system. (E) The PF results with flap-wise frequency. (F) The optimization results in frequency-mass coordinate system.
Blade structure design is a complicated process. To assist in obtaining optimal blade design, a novel methodology combined the improved NSGA-II with TWBT and CLT has been developed the IEA-15-240-RWT wind turbine and blade developed by NREL are taken as the reference model, the spar cap of the blade is taken as the research object. Through the Pareto Front obtained from the multi-objective optimization results with the minimum mass and maximum stiffness as the design objectives, the law of the quantity of variables, shape, load and natural frequency presented in the design is studied. The results can be summarized as follows from the study:
• The new methodology combined the improved NSGA-II with TWBT and CLT is effective for blade structure design;
• The parametric models of spar cap based on the production process have been successfully applied in this study. The concept is clear and intuitive, the use is easy, can be easily extended to other wind turbine blade components, such as trailing edge spar, blade root reinforcement layer, core, and so on.
• For the design of wind turbine blade spar cap structure, the quantity of optimization variables is not the more the better. In this study, structural optimization with 3-variable parametric model has higher convergence efficiency and can obtain relatively better Pareto Front. More variables would make the thickness transition smoother, but there is no direct correlation between the continuous and smooth thickness transition of spar cap and the quality of optimization results. In the process of blade design, design variables should be as few as possible according to specific requirements;
• The variation of chord length is non-linear to the result of optimization design. If nothing else is changed, reducing the chord length will result in lighter, stiffer brandishing blades and The effect of load on Pareto Front is linear;
• It is a very useful attempt to add natural frequency information into the optimization results with mass and stiffness as optimization objectives. It not only verifies the relationship between natural frequency of blades and mass and stiffness again, but also helps design engineers to find the desired blade as quickly as possible in numerous data.
The original contributions presented in the study are included in the article/Supplementary Material, further inquiries can be directed to the corresponding author.
CC performed the calculations and tests and wrote the manuscript. LW checked the calculation results, and MN helped analyse the results. All authors have read and agreed to the published version of the manuscript.
This study was funded by the National Key Research and Development Program of China (Grant No. 2019YFB1503701 and 2022YFB4201201).
The authors declare that the research was conducted in the absence of any commercial or financial relationships that could be construed as a potential conflict of interest.
All claims expressed in this article are solely those of the authors and do not necessarily represent those of their affiliated organizations, or those of the publisher, the editors and the reviewers. Any product that may be evaluated in this article, or claim that may be made by its manufacturer, is not guaranteed or endorsed by the publisher.
Abbas, N., Zalkind, D., Pao, L., and Wright, A. (2021). A reference open-source controller for fixed and floating offshore wind turbines. Wind Energy Sci. 7 (1), 53–73. doi:10.5194/wes-2021-19
Albanesi, A., Bre, F., Fachinotti, V., and Gebhardt, C. G. (2018). Simultaneous ply-order, ply-number and ply-drop optimization of laminate wind turbine blades using the inverse finite element method. Compos. Struct. 184, 894–903. doi:10.1016/j.compstruct.2017.10.051
Bader, J., and Zitzler, E. (2011). Hype: An algorithm for fast hypervolume-based many-objective optimization. Evolutionary Computation, 19, 1, 45-76. doi:10.1162/EVCO_a_00009
Bir, G., and Migliore, P. (2001). Computerized method for preliminary structural design of composite wind turbine blades, Journal of Solar Energy Engineering, 123, 4, 372-381. doi:10.1115/1.1413217
Deb, K. (2005), Scalable test problems for evolutionary multiobejctive optimization, Springer, Berlin, Germany.
Gaertner, E., Rinker, J., and Sethuraman, L. (2020). Definition of the IEA 15-megawatt offshore reference wind turbine. National Renewable Energy Laboratory. Golden, CO, USA.
Gao, Q., Cai, X., Zhu, J., and Guo, X. (2015). Multi-objective optimization and fuzzy evaluation of a horizontal axis wind turbine composite blade. J. Renew. Sustain. Energy 7 (6), 63109. doi:10.1063/1.4936296
Hu, W., Han, I., Park, S. C., and Choi, D. H. (2012). Multi-objective structural optimization of a HAWT composite blade based on ultimate limit state analysis. J. Mech. Sci. Technol. 26 (1), 129–135. doi:10.1007/s12206-011-1018-3
Huband, S., Hingston, P., Barone, L., and While, L. (2006). A review of multiobjective test problems and a scalable test problem toolkit. IEEE Trans. Evol. Comput. 10 (5), 477–506. doi:10.1109/tevc.2005.861417
Jonkman, B. J., and Buhl, M. L. (2006). TurbSim user's guide. Golden, CO, USA: National Renewable Energy Laboratory.
Lee, K., Huque, Z., Kommalapati, R., and Han, S. E. (2018). Fluid-structure interaction analysis of NREL phase VI wind turbine: Aerodynamic force evaluation and structural analysis using FSI analysis. Renew. Energy 113, 512–531. doi:10.1016/j.renene.2017.02.071
Lekou, D. J., and Philippidis, T. P. (2009). PRE-and POST-THIN: A tool for the probabilistic design and analysis of composite rotor blade strength. Wind Energy 12 (7), 676–691. doi:10.1002/we.322
Lindenburg, C. (2008). STABLAD-stability analysis tool for anisotropic rotor blade panels. Energy. 590.
Luo, B., Zheng, J., Xie, J., and Wu, J. (2008). Dynamic crowding distance?A new diversity maintenance strategy for MOEAs, Proceedings of the 2008 4th International conference on natural computation, October 2008, Jinan, China.
Meng, R., and Xie, N. G. (2019). A competitive-cooperative game method for multi-objective optimization design of a horizontal Axis wind turbine blade. IEEE Access 7, 155748–155758. doi:10.1109/ACCESS.2019.2949336
Nrel, (2023), OpenFAST, https://github.com/openfast/openfast, (Accessed January 03, 2023).
Ozkan, R., Sen, F., and Ball, S. (2020). Evaluation of wind loads and the potential of Turkey's south west region by using log-normal and gamma distributions. Wind Struct. Int. J. 31 (4), 299–309. doi:10.12989/was.2020.31.4.299
Rudolph, G. (1994). Convergence analysis of canonical genetic algorithms. IEEE Trans. Neural Netw. 5 (1), 96–101. doi:10.1109/72.265964
Samui, P., Sekhar, S., and Balas, V. E. (2017). Handbook of neural computation. Cambridge, MA, USA: Academic Press.
Tenguria, N., Mittal, N. D., and Ahmed, S. (2013). Structural analysis of horizontal axis wind turbine blade. Wind Struct. 16, 241–248. doi:10.12989/was.2013.16.3.241
Vasiliev, V. V., and Morozov, E. V. (2018). Advanced mechanics of composite materials. Amsterdam, Netherlands: Elsevier.
Wang, L., Wang, T., and Luo, Y. (2011). Improved non-dominated sorting genetic algorithm (NSGA)-II in multi-objective optimization studies of wind turbine blades. Appl. Math. Mech., 32 (6), 739–748. doi:10.1007/s10483-011-1453-x
Wang, L., Wang, T., Wu, J., and Chen, G. (2017). Multi-objective differential evolution optimization based on uniform decomposition for wind turbine blade design. Energy 120 (1), 346–361. doi:10.1016/j.energy.2016.11.087
Keywords: wind turbine blade, multi-objective optimization, composite materials, NSGA-II, Thin-Walled Beam Theory, Classic Laminated Theory
Citation: Chen C, Wang L and Niu M (2023) Research on the application of improved NSGA-II in the structure design of wind turbine blade spar cap. Front. Energy Res. 11:1160423. doi: 10.3389/fenrg.2023.1160423
Received: 07 February 2023; Accepted: 08 March 2023;
Published: 17 March 2023.
Edited by:
Ahmad Fazlizan, National University of Malaysia, MalaysiaReviewed by:
Radi Bouchaib, Hassan Premier University, MoroccoCopyright © 2023 Chen, Wang and Niu. This is an open-access article distributed under the terms of the Creative Commons Attribution License (CC BY). The use, distribution or reproduction in other forums is permitted, provided the original author(s) and the copyright owner(s) are credited and that the original publication in this journal is cited, in accordance with accepted academic practice. No use, distribution or reproduction is permitted which does not comply with these terms.
*Correspondence: Cheng Chen, a2VyY2NAbnVhYS5lZHUuY24=
Disclaimer: All claims expressed in this article are solely those of the authors and do not necessarily represent those of their affiliated organizations, or those of the publisher, the editors and the reviewers. Any product that may be evaluated in this article or claim that may be made by its manufacturer is not guaranteed or endorsed by the publisher.
Research integrity at Frontiers
Learn more about the work of our research integrity team to safeguard the quality of each article we publish.