 M. Ravinder
 Vikram Kulkarni
- Department of Information Technology, SVKM’s NMIMS Mukesh Patel School of Technology Management and Engineering, SVKM’s NMIMS University, Mumbai, India
The intrusion detection in network traffic for crucial smart metering applications based on radio sensor networks is becoming very important in the Smart Grid area. The network’s structure for smart meters under investigation should consider important security factors. The potential of both passive and active cyber-attacks affecting the functioning of advanced metering infrastructure is studied and a novel method is proposed in this article. The proposed method for anomaly identification is efficient and rapid. In the beginning, Cook’s distance was employed to recognize and eliminate outlier observations. After observations are made three statistical models Brown’s, Holt’s, and winter’s models were used for exponential smoothing and were estimated using the provided data. Bollinger Bands with the appropriate parameters were employed to estimate potential changes in the forecasts produced by the models that were put into operation. The estimated traffic model’s statistical relationships with its actual variations were then investigated to spot any unusual behaviour that would point to a cyber-attack effort. Additionally, a method for updating common models in the event of substantial fluctuations in real network traffic was suggested. The findings confirmed the effectiveness of the proposed method and the precision of the selection of the appropriate statistical model for the under-study time series. The outcomes validated the effectiveness of the proposed approach and the precision in choosing a suitable statistical model for the time series under investigation.
1 Introduction
The most essential components of the Smart Grid System are the Smart Metering Communications Networks (SMCN). The reading process can be carried out at an exceptionally high frequency, such as once every 1 s to 15 min for each meter based on the requirement. The Smart Metering Communications Network is made up of three different types of networks: the backbone network, access networks, and last-mile networks (Gao et al., 2022). There are potentially a lot of other creative alternatives, such as meters that are detailed in (Liu et al., 2021). Networks for last-mile smart meters may employ RF, Power Line Communications (PLC), or a combination of the two technologies, which is designed exclusively for the automatic reading of electricity meters (Ravinder and Kulkarni, 2021).
Considering that smart metering systems are a component of the Smart Grid, it is essential to consider the performance of individual infrastructure, they are required to satisfy stringent security requirements. The identification of anomalies in last-mile networks is one such issue (Ji et al., 2015). There are approximately 250 smart metres inside one last-mile network, and it takes a few seconds to read energy consumption data for every 15 min (usually from 1 to 4 s). The aforementioned consumption data, from smart meter will reach a local data-concentrator where the anomaly detection can be done using machine learning algorithms (Wang and Yi, 2011). The data concentrator is mostly constructed using single-board computers, which have a speedy processor, lots of RAM, and ROM memory. Both access and last-mile networks are connected to the data traffic concentrator.
The technique that was described before utilised a way of detecting anomalies that consisted of two stages. The first part of it was primarily concerned with locating and eliminating any abnormalities in the advanced metering infrastructure (AMI) in (Xie et al., 2011) traffic characteristics. This stage was based on Cook’s distance, which is an approach that is both straightforward and effective.
A wireless sensor network is used to actualize an AMI network, which is what makes up a last-mile network (WSN) (Liu et al., 2015). Wireless sensors that function in the industrial, scientific, and medical (ISM) frequency bands are included with power meters (Finster and Baumgart, 2015). Lines implemented by technologies such IP networks, General Packet Radio Service (GPRS), or Long-Term Evolution (LTE), receives the traffic from the power meter in (Garcia-Font et al., 2016), which stands in for a link that is realised by a packet communication network (Andrysiak et al., 2017).
In this research, we implement statistical methods for smoothing the data and three machine learning algorithms for detecting abnormal daily power consumption. Based on consumption patterns, which are relatively consistent for a consumer, such as on weekdays or weekends, anomalies in power consumption pattern are detected. To directly identify abnormalities, the proposed methodology may be connected with smart meters. We make the following contributions to this article.
• We create a model to detect anomalies.
• Microservice that receives, processes, stores and exposes meter data.
• Display meter data and anomalies.
• Three machine learning algorithms are implemented for Clustering approach and detecting anomalies based on the means and standard of the readings during the day.
• The proposed system is considered using a cluster environment based on realistic data set. The Monte Carlo model shows the high efficiency for outlier’s detection.
The following describes how the article is structured: Section 2 follows the introduction and explains the final mile test-bed network’s communication protocol. Section 3 discusses the proposed model. Section 4 presented the Result discussion and Section 5 presented the conclusion of this article followed by references.
2 Literature review
Wireless networking options like ZigBee are cited by Visvakumar et al. in (Aravinthan et al., 2011) as the ideal medium for Smart meter communication. Omid Ardakanian et al. (2014), provide a straightforward, understandable, and useful paradigm for residential consumer profiling that takes temperature and time of day fluctuations into consideration.
In, Robin Berthier et al. (2015) investigated four different strategies for balancing the dual objectives of confidentiality and monitoring by examining their usefulness on a set of real-world packet-level traces obtained at an operational AMI network incongruous with the purpose of intrusion detection systems (IDSes).
Bilal Erman Bilgin et al. (2016) In, developed a plan that makes use of automotive adhoc networks to gather data from smart metres. They are considers average end-end latency and delivery ratio using NS-2 and several routing protocols.
A machine learning-based anomaly detection (MLAD) approach is created by Mingjian Cui et al. (2019) in to efficiently and precisely identify these assaults. Giuseppe Fenza et al. (2019) in, concentrated on the requirement to create anomaly detection methods capable of dealing with idea drift, such as changes in family structure, the conversion of a home into a second dwelling, and other examples. Real power flow on the chosen line in a transmission network is monitored and communicated through a SCADA network to the system operator, according to a suggested method by Annarita Garcia et al. (2015).
The Distributed Denial of Services (DDoS) attack is a possible cyber threat in AMI communication networks, according to Yonghe Guo et al. (2015) in. When using the Markovian decision process framework to examine probable anomalies of malware foot printing, Yonghe Guo et al. (2016) offer an ideal frequency of on-site inquiry and the number of monitoring verification. The greedy quasi-flooding protocol is a novel communication protocol presented by Piotr Kiedrowski et al. (2011).
The smart grid’s privacy and cyber security risks are described in general by Jing Liu et al. (2012) in. In (Marnerides et al., 2015), Angelos K, Marne rides, et al. address the problem of finding and attributing anomalies that appear in the sub-meter power consumption data of a smart grid and may be indicative of malicious behavior. A generative model for anomaly detection that takes into consideration the network’s hierarchical structure and the information gathered from the SMs was proposed by Ramin Moghaddass et al. in (Moghaddass and Wang, 2018). Amir-Hamed et al. In (Mohsenian-Rad and Leon-Garcia, 2011), list some real-world loads that might be subject to load-altering assaults over the internet. With the help of identity-based signature and encryption schemes, Jia-lun Tsai et al. in (Tsai and Lo, 2016) developed a novel anonymous key distribution system for smart grid scenarios.
3 Proposed model
This proposed model contains Exploratory Data Analysis (EDA) for training the data. Based on the above trained data anomaly detection is estimated using three Machine learning (ML) algorithms discussed in detail in this section below. The dataset consists of time-series forecasting from a single smart meter that is based on the following two models proposed this research.
1. Based on the mean and standard deviation of the day’s measurements, a clustering approach for identifying abnormal days has been used.
2. Monte Carlo Algorithm (MCA) for detecting single-meter anomalous readings.
The proposed model is based on, user behavior, mistakes made by humans, poor equipment, energy consumption in buildings and industries that is frequently wasted. In this situation, recognizing anomalous power consumption patterns can be a key step in reducing peak energy use and altering undesired user behavior. Due to the widespread adoption of smart meters, it is now possible to recognize, or flag, anomalous usage by gradually learning what constitutes typical operational consumption. With the use of such information, users may be alerted when their equipment is not functioning as it should, which may modify their behavior. It may even be possible to identify the problematic appliances and make long-term modifications to their behavior. The architecture of proposed system in this paper is shown in Figure 1. The raw data r(k) is given as input to the control model and u(k) is trained data obtained based on EDA. The past data (reference data) d(k) and trained data u(k) are given as input to the MCA the output y(k) is given as input to the Event detection module where the anomaly detection A is identified.
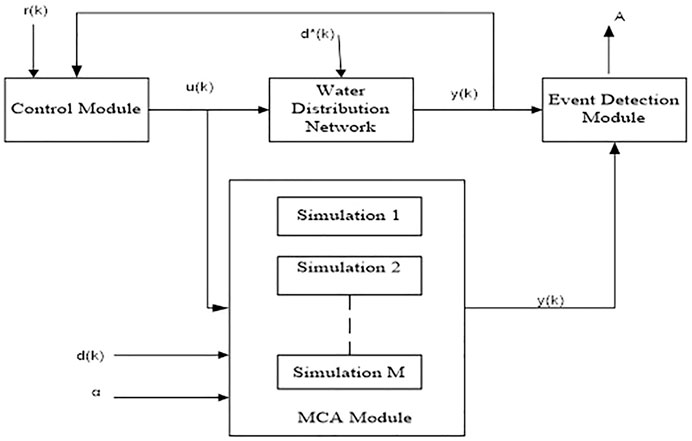
FIGURE 1. Architecture of the proposed system.
The main purpose of EDA is to analyze the data before making any assumptions. EDA also heps in.
i. Identifying noticeable errors,
ii. Understanding patterns within the data,
iii. Detecting outliers or anomalous events,
iv. Find interesting relations among the variables.
Specific statistical functions and techniques along with EDA tools including clustering and dimension reduction techniques, helps to create graphical displays of high-dimensional data containing many variables.
The algorithm, Density-Based Spatial Clustering of Applications with Noise (DBSCAN) Algorithm (DBSCAN) is utilized to differentiate between clusters with high and low density. DBSCAN performs an excellent job of identifying regions of the data that are highly dense with observations compared to those that are not. DBSCAN also has the capability to group data into clusters of various shapes, which is a significant advantage.
The unsupervised learning method Means shift clustering is non-parametric and does not call for a predetermined shape of the clusters in the feature space, it is frequently utilized in real-world data analysis.
Monte Carlo simulations (MCA) help to clarify how risk and uncertainty impact forecasting and prediction models. An unknown variable must be provided with multiple values in a Monte Carlo simulation to obtain a range of results that must then be averaged to produce an estimate.
3.1 Anomaly detector model
Utilities must identify customers with highly variable consumption and provide them with incentives to smooth out their demand in order to ensure the readiness of the electrical infrastructure for peak demand. An hourly consumption histogram is generated from the algorithms proposed in this research paper, to analyze the data before applying the model to better comprehend its variability.
Next, create a new data frame aggregated from the data generated during weekdays on hourly basis, it is observed that the readings are around 2.75 KWh during weekends with a pick around 5:15 a.m. as shown in Figure 2 in the results section. This might indicate that something is being turned-on automatically at this time. Lastly, find anomalous days that aggregate the readings for each day in the mean and standard values. The plot below as shown in Figure 3 each day represents with blue standing for Monday to Friday and Green for Saturday to Sunday. As can be seen, there are two big clusters (Blue and Green). However, some blue points fall into the green cluster, and the guess is that these are the non-working Monday to Fridays. To find anomalies, cluster algorithms like DBSCAN, Mean shift and Monte Carlo algorithms are used in this paper.
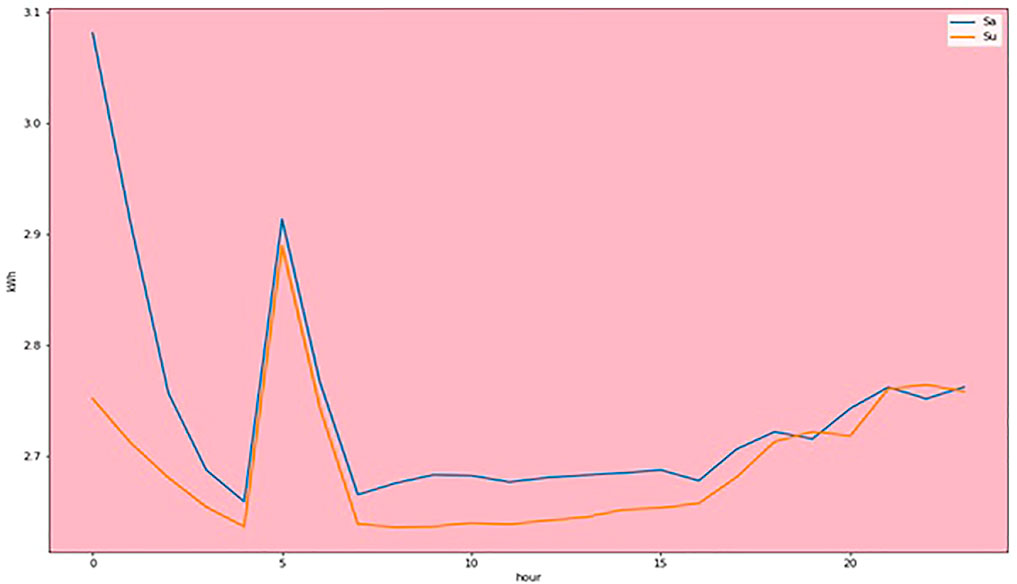
FIGURE 2. Energy consumption in KWh during weekends.
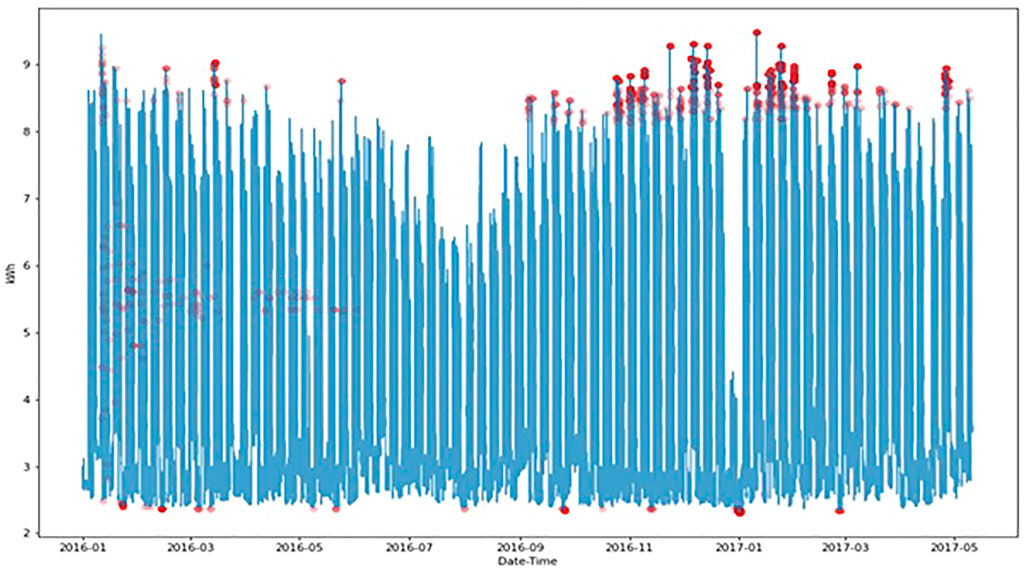
FIGURE 3. Detected outliers.
To find abnormalities, our algorithm includes statistical models and expert knowledge. Furthermore, anomalies should be labelled based on a predefined set of attributes to help us determine whether our model has generated relevant outputs. To locate unique patterns that are difficult to identify by static rules and may not be simple for specialists to quantify, the proposed ML-based models are adapted.
3.2 Density-based spatial clustering of applications with noise (DBSCAN) algorithm
Every data point is encircled by an epsilon (eps) radius circle in DBSCAN before being divided into three categories: Core point, Border point, and Noise. A data point is considered for a core point if a minimum number of points (‘min-Points’) are present in the circle around it. It is categorized as a Border point if there are less than “minPoints”, and as Noise, if there are no other data points within an epsilon radius of any data point.
The values of eps and “minPoints” have a significant impact on DBSCAN. Because of this, it's crucial to know how to choose the values for eps and “minPoints.” The DBSCAN algorithm’s output can be considerably altered by even a little modification in these numbers. Eq. 1 provides the “min Point” value,
Considering “minPoints” as “1”would result in each point becoming its own cluster, which is incorrect. Therefore, it must be at least “3”. However, its effectiveness is also determined by domain knowledge. The K-distance graph may be used to determine the value of eps. The graph’s elbow, or point of greatest curvature, provides information on the magnitude of eps. More clusters will form and more data points will be viewed as Noise if the value of the specified eps is too small. The details will be lost if the size is too large since several little clusters will combine into one large cluster.
Algorithm 1. DBSCAN Algorithm
1 DBSCAN (dataset, eps, MinPts){
2 # cluster index
3 C = 1
4 for each unvisited point p in dataset {
5 mark p as visited
6 # find neighbors
7 Neighbors N = find the neighboring points of p
8 if |N|>=MinPts:
9 N = N U N′
10 if p’ is not a member of any cluster:
11 add p’ to cluster C
12 }
The DBSCAN pseudo code mentioned above is explained as follows, Finding every neighbor point within an eps and identifying the focal areas or locations that have received visits from neighbors whose number is more than MinPts constitutes step one. For each essential element that hasn't been allocated to a cluster yet in step 2, a new cluster must be created. Recursively finding all of its density-connected points and clustering them with the core point is required in the third stage. A point pair is said to be density connected when “a” and “c” has a sufficient number of points in its neighbors and both “a” and “b” are situated within the eps distance it involves chaining. In consideration of the above, it can be concluded that statement holds true if “b” is a neighbor of “c”, “c” is a neighbor of “d”, “d” is a neighbor of “e”. The fourth step includes repeatedly iterating over the unexplored spots in the dataset. Noise is defined as the points that cannot be grouped into a cluster.
3.3 Mean shift algorithm
The “mean point” of the EDA dataset can be obtained by calculating the mean of feature_1 and the mean of feature_2. To note, the “mean point” here is defined by the arithmetic mean of feature_1 and that of feature_2, respectively, because it is calculated based on the equal weights of all points.
Where M represents the mean, n is the sample size, and x_i is one feature (feature_1 or feature_2) of the data points.
The most widely used weight function in the mean shift algorithm is a flat one,
Where d is the distance between any data point to the currently investigated one, and R is the radius of the circle centered at the investigated point. It’s kind of like that we are standing on one local point (center point O) and cannot see the entire picture but are restricted to a local area to calculate the mean. The weighted mean of the investigated area found tends to locate in a region with a high density of points.
Algorithm 2. Mean Shift Algorithm
1 Initialize k means with random values
2 -->For a given number of iterations:
3 -->Iterate through items:
4 -->Find the mean closest to the item by calculating The Euclidean distance of the item with each of the means.
5 -->Assign item to mean
6 -->Update mean by shifting it to the average of the items in that cluster
3.4 Monte Carlo model
Monte Carlo Simulation, is a multiple probability simulation, which is used to estimate the possible outcomes of an uncertain event. Monte Carlo Algorithm (MCA) based classification is used to estimate every smart meter reading, we calculate the frequency of specific readings in the past and write to the ‘freq’ column of the data frame. For missing readings, we define the frequency to be −1. A reading is declared anomalous if its frequency is below a set threshold. The threshold value can also be used for estimating the severity of the anomaly.
The Monte Carlo model approach is.
• Easy and Fast
• Tunable
• Adaptive: if the user behavior changes, the algorithm eventually adapts to the new behavior.
This can also be achieved by resetting the clock, i.e., resetting the application dictionary and the count variable after the count reaches a certain threshold, or by setting time-to-live for each reading in the past.
4 Results discussion
The research proposed in this article is implemented on Google Co-lab. The workstation used for the research runs on Intel(R) Core(TM) i3-4005U CPU @ 1.70GHz, 64-bit operating system, the x64-based processor with 8.00 GB RAM. For evaluating algorithms and statistical models proposed in this paper considers open-source data from (kaggle, 2023). Table 1 illustrates the sensitivity of DBSCAN, Mean shift, and Monte Carlo algorithms on anomaly detection. Based on the observation from Table 1 the Monte-Carlo algorithm outperforms the DBSCAN and Mean shift algorithms.
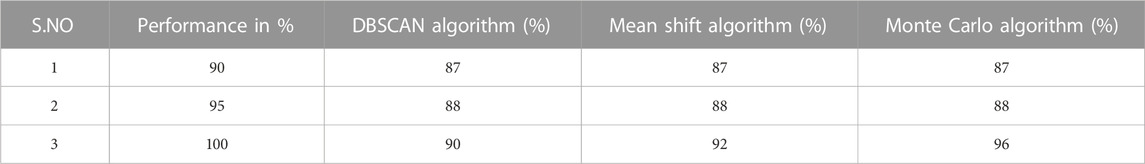
TABLE 1. Comparison of DBSCAN, mean shift and Monte Carlo algorithms.
Figure 2 shows the readings of the electrical energy consumption of an office building. The power consumption on weekend (Saturday and Sunday) is observed to be around 2.75 KWh with a pick at 5:15 a.m. This reading during weekend days is observed to be suspicious.
The location of the detected anomaly is shown in Figure 3. The outliers that were discovered are shown by the red spots on this graph, and the degree of the abnormality is indicated by how transparent the spots are. Brighter red denotes greater severity. This can also be done by setting time-to-live for each reading in the past or by restarting the clock, which involves restarting the application dictionary and the count variable after count reaches a particular threshold.
The observation regarding EDA, DBSCAN, Mean Shift, and Monte Carlo algorithms can be made from the results.
• Observation 1: Implemented three machine learning algorithms to find abnormalities and allow access to a micro-service that collects, modifies, saves, and displays meter data.
• Observation 2: Every data point is encircled by an epsilon-radius circle in DBSCAN before being divided into three categories: Core point, Border point, and Noise. The K-distance graph may be used to determine epsilon’s value. The DBSCAN algorithm is a clustering algorithm.
• Observation 3: Mean shift is an unsupervised learning approach that outperforms the DBSCAN algorithm and is mostly used for clustering.
• Observation 4: Monte Carlo classification focuses on individual smart meter measurements. The Monte Carlo model technique is simple, quick, tunable, and adaptable, and it improves results by 15% compared to similar work (Andrysiak et al., 2017).
5 Conclusion
In this paper, a new data-driven approach to identify distribution system abnormalities using time series analysis is proposed. With a high degree of confidence, the developed anomaly detector identified every pre-designed abnormality. The proposed anomaly detector operates unsupervised, which overcomes the issue of data imbalance brought on by a lack of anomalous data. A realistic distribution grid has been successfully used to test the results that correspond to the proposed framework. In the future, this research can analyse and forecast multivariate data from smart grid using a machine learning algorithm.
Data availability statement
The original contributions presented in the study are included in the article/supplementary material, further inquiries can be directed to the corresponding author.
Author contributions
MR is a research scholar and has done the research work. VK is a supervisor and has monitored the work.
Conflict of interest
The authors declare that the research was conducted in the absence of any commercial or financial relationships that could be construed as a potential conflict of interest.
Publisher’s note
All claims expressed in this article are solely those of the authors and do not necessarily represent those of their affiliated organizations, or those of the publisher, the editors and the reviewers. Any product that may be evaluated in this article, or claim that may be made by its manufacturer, is not guaranteed or endorsed by the publisher.
References
Andrysiak, T., Saganowski, Ł., and Kiedrowski, P. (2017). Anomaly detection in smart metering infrastructure with the use of time series analysis. J. Sensors 2017, 1–15. Article ID 8782131, 15 pages. doi:10.1155/2017/8782131
Aravinthan, V., Namboodiri, V., Sunku, S., and Jewell, W. (2011). “Wireless AMI application and security for controlled home area networks,” in IEEE Power Energy Soc. Gen. Meet, Detroit, MI, USA, 24-28 July 2011, 1–8. doi:10.1109/PES.2011.6038996
Ardakanian, O., Koochakzadeh, N., Singh, R. P., Golab, L., and Keshav, S. (2014). Computing electricity consumption profiles from household smart meter data. CEUR Workshop Proc. 1133, 140–147.
Berthier, R., Urbina, D. I., Cardenas, A. A., Guerrero, M., Herberg, U., Jetcheva, J. G., et al. (2015). “On the practicality of detecting anomalies with encrypted traffic in AMI,”in 2014 IEEE Int. Conf. Smart Grid Commun. SmartGridComm, Venice, Italy, 03-06 November 2014, 890–895. doi:10.1109/SmartGridComm.2014.7007761
Bilgin, B. E., Baktir, S., and Gungor, V. C. (2016). Collecting smart meter data via public transportation buses. IET Intell. Transp. Syst. 10 (8), 515–523. doi:10.1049/iet-its.2015.0058
Cui, M., Wang, J., and Yue, M. (2019). Machine learning-based anomaly detection for load forecasting under cyberattacks. IEEE Trans. Smart Grid 10 (5), 5724–5734. doi:10.1109/tsg.2018.2890809
Fenza, G., Gallo, M., and Loia, V. (2019). Drift-aware methodology for anomaly detection in smart grid. IEEE Access 7, 9645–9657. doi:10.1109/ACCESS.2019.2891315
Finster, S., and Baumgart, I. (2015). Privacy-aware smart metering: A survey. IEEE Commun. Surv. Tutorials 17 (2), 1088–1101. doi:10.1109/COMST.2015.2425958
Gao, H.-X., Kuenzel, S., and Zhang, X.-Y. (2022). A hybrid ConvLSTM-based anomaly detection approach for combating energy theft. IEEE Trans. Instrum. Meas. 71 (1), 1–10. doi:10.1109/tim.2022.3201569
Garcia, M., Giani, A., and Baldick, R. (2015). Smart grid data integrity attacks: Observable islands. IEEE Power Energy Soc. Gen. Meet. 2015 (3), 1244–1253. doi:10.1109/PESGM.2015.7286300
Garcia-Font, V., Garrigues, C., and Rifà-Pous, H. (2016). A comparative study of anomaly detection techniques for smart city wireless sensor networks. Sensors Switz. 16, 868–876. doi:10.3390/s16060868
Guo, Y., Ten, C. W., Hu, S., and Weaver, W. W. (2015). Modeling distributed denial of service attack in advanced metering infrastructure. 2015 IEEE Power Energy Soc. Innov. Smart Grid Technol. Conf. ISGT 2015, 1–5. doi:10.1109/ISGT.2015.7131828
Guo, Y., Ten, C. W., Hu, S., and Weaver, W. W. (2016). Preventive maintenance for advanced metering infrastructure against malware propagation. IEEE Trans. Smart Grid 7 (3), 1314–1328. doi:10.1109/TSG.2015.2453342
Ji, S., Chen, T., and Zhong, S. (2015). Wormhole attack detection algorithms in wireless network coding systems. Wormhole Attack Detect. algorithm Wirel. Netw. Coding Syst. 14 (3), 660–674. doi:10.1109/tmc.2014.2324572
kaggle (2023). kagle. Available at: https://www.kaggle.com/datasets/portiamurray/anomaly-detection-smart-meter-data-sample (Accessed on 18-Jan 2023).
Kiedrowski, P., Dubalski, B., Marciniak, T., Riaz, T., and Gutierrez, J. (2011). Energy greedy protocol suite for smart grid communication systems based on short range devices. Adv. Intell. Soft Comput. 102, 493–502. doi:10.1007/978-3-642-23154-4_54
Liu, J., Xiao, Y., Li, S., Liang, W., and Chen, C. L. P. (2012). Cyber security and privacy issues in smart grids. IEEE Commun. Surv. Tutorials 14 (4), 981–997. doi:10.1109/SURV.2011.122111.00145
Liu, Q., Hagenmeyer, V., and Keller, H. B. (2021). A review of rule learning-based intrusion detection systems and their prospects in smart grids. IEEE Access 9, 57542–57564. doi:10.1109/ACCESS.2021.3071263
Liu, X., Golab, L., and Ilyas, I. F. (2015). Smas: A smart meter data analytics system. Proc. - Int. Conf. Data Eng. 2015, 1476–1479. doi:10.1109/ICDE.2015.7113405
Marnerides, A. K., Smith, P., Schaeffer-Filho, A., and Mauthe, A. (2015). Power consumption profiling using energy time-frequency distributions in smart grids. IEEE Commun. Lett. 19 (1), 46–49. doi:10.1109/LCOMM.2014.2371035
Moghaddass, R., and Wang, J. (2018). A hierarchical framework for smart grid anomaly detection using large-scale smart meter data. IEEE Trans. Smart Grid 9 (6), 5820–5830. doi:10.1109/TSG.2017.2697440
Mohsenian-Rad, A. H., and Leon-Garcia, A. (2011). Distributed internet-based load altering attacks against smart power grids. IEEE Trans. Smart Grid 2 (4), 667–674. doi:10.1109/TSG.2011.2160297
Ravinder, M., and Kulkarni, V. (2021). “Review on energy efficient wireless sensor network protocols,” in 21st IEEE Int. Conf. Environ. Electr. Eng. 2021 5th IEEE Ind. Commer. Power Syst. Eur. EEEIC/I CPS Eur. 2021 - Proc., Bari, Italy, 07-10 September 2021, 7. doi:10.1109/EEEIC/ICPSEurope51590.2021.9584696
Tsai, J. L., and Lo, N. W. (2016). Secure anonymous key distribution scheme for smart grid. IEEE Trans. Smart Grid 7 (2), 1–914. doi:10.1109/TSG.2015.2440658
Wang, X., and Yi, P. (2011). Security framework for wireless communications in smart distribution grid. IEEE Trans. Smart Grid 2 (4), 809–818. doi:10.1109/tsg.2011.2167354
Keywords: smart meter, WSN, AMI, machine learning, intrusion detection, smart grid
Citation: Ravinder M and Kulkarni V (2023) Intrusion detection in smart meters data using machine learning algorithms: A research report. Front. Energy Res. 11:1147431. doi: 10.3389/fenrg.2023.1147431
Received: 18 January 2023; Accepted: 06 February 2023;
Published: 16 February 2023.
Edited by:
Sudhakar Babu Thanikanti, Chaitanya Bharathi Institute of Technology, IndiaReviewed by:
Damodhar Reddy, Sasi Institute Technology & Engineering, IndiaSrikanth Velpula, S. R University, India
Gaddam Sridhar, Jawaharlal Nehru Technological University, Hyderabad, India
Rajendhar Puppala, Smt. Indira Gandhi College of Engineering, India
Copyright © 2023 Ravinder and Kulkarni. This is an open-access article distributed under the terms of the Creative Commons Attribution License (CC BY). The use, distribution or reproduction in other forums is permitted, provided the original author(s) and the copyright owner(s) are credited and that the original publication in this journal is cited, in accordance with accepted academic practice. No use, distribution or reproduction is permitted which does not comply with these terms.
*Correspondence: Vikram Kulkarni, dmlrcmFtLmt1bGthcm5pQG5taW1zLmVkdQ==