 Yi Liu1
 Jie Cai
94% of researchers rate our articles as excellent or good
Learn more about the work of our research integrity team to safeguard the quality of each article we publish.
Find out more
METHODS article
Front. Energy Res., 09 March 2023
Sec. Process and Energy Systems Engineering
Volume 11 - 2023 | https://doi.org/10.3389/fenrg.2023.1147069
This article is part of the Research TopicOptimal Design and Efficiency Improvement of Fluid Machinery and SystemsView all 18 articles
In this paper, a two-phase flow model and the improved thermal cavitation model are used to study the flow characteristics and the evolution of vorticity force for liquid nitrogen cavitation flow. The results are validated against the experimental data from NASA, which shows that the flow re-attachment occurs in the area where the boundary vorticity flux begins to decrease from its positive value. Alternatively, the flow separation occurs near the area with low boundary vorticity fluxes. Besides, the boundary vorticity flux changes typically from negative to positive around the cavity. The development of the cavity affects the surrounding vortex structure, which leads to the evolution of vorticity force and the fluctuations of lateral force and drag force. The results show that the drag force is magnified by the cavitation, and it first decreases and then increases in a typical cycle of cavity evolution. The negative resistance unit is mainly produced in the front of the cavity, and the positive resistance unit is also made in the rear of the cavity. When the attached cavity is shed, the positive drag elements decrease, and the drag force drops to its minimum. When the attached cavity is growing, the positive resistance elements behind the cavity increase, making the resistance force gradually increase. For the lateral force, the existence of the cavity produces lift elements pointing out of the surface outside the cavity, and the unsymmetrical distribution of the cavity leads to the fluctuation of the lateral force.
Cavitation is a sudden phenomenon. When the local static pressure is lower than the saturated vapor pressure, the liquid evaporates and produces bubbles (Li et al., 2018). Cavitation involves complex flow phenomena, such as phase transition, multi-scale turbulence and compressibility, which may lead to vibration, noise and performance degradation in the fluid (Joseph, 1995; Li X et al., 2021). Cavitation flow is usually predicted as a phenomenon without considering the changes in liquid temperature and physical properties (Xu et al.,2022; Chen et al., 2023). However, the physical and thermodynamic properties of thermo-sensitive fluids would significantly change when cavitation occurs, affecting the cavitation characteristics and invalidating the constant temperature assumption. In recent decades, due to the wide application of thermal fluids in industrial applications, this phenomenon has attracted extensive research attention (Merouani et al., 2016; Abderrezzak and Huang, 2016; Li et al.,2023). For example, liquid hydrogen and oxygen are commonly used to fuel space launch vehicles. However, these fuels are prone to cavitation in the turbopump of space engines (Smirnov et al., 2014; Zhao et al., 2016), which directly affects the thrust level of the rocket engine and the success of the rocket launch. Since the cavitation of thermo-sensitive fluids is often accompanied by strong energy conversion and mass transfer (Long et al., 2017; Zhang BC et al., 2020), it is necessary to understand the flow characteristics and potential mechanisms.
A series of experiments on cryogenic cavitation were performed to explore its characteristics. For instance, Kikuta et al. (2008) studied the thermodynamic effects of cavitation performance and cavitation instability in the inducer by comparing the cavitation flow of thermal fluid and cold water. Franc et al. (2001) experimentally studied the cavitation flow of freon R114 in the inducer at three temperatures. They found that the length of the cavity near the inlet blade of the inducer decreased with the increase of the reference temperature. Kelly and Segal (2015) studied the cavitation flow of fluorone around the NACA 0015 hydrofoil under different free flow conditions, and observed the transition from classical cavitation to thermal cavitation at 318 k. Cervone et al. (2006) found that the length of the water chamber in the NACA 0015 hydrofoil is positively correlated with temperature. Šarc et al. (2017) found that the cavity size of water becomes larger at 313 k than at 273 K and 343 K. Zhang et al. (2018), Zhang et al. (2019) optimized and used the Zwart-Gerber-Belamri (ZGB) model to simulate the thermal cavitation flow on 2D and 3D hydrofoils. They found that when the temperature in the cavity decreased by 1 K–3 K, the thermal effect inhibited the growth of the cavity. Therefore, temperature fluctuation should be considered in thermal cavitation flow. Visualization experiments on cryogenic cavitation were also performed. For instance, Gopalan and Katz (2000) focused on the cavity structure of lamellar cavitation at different free flow temperatures. They found that a slight increase in temperature would slightly increase the size of the lamellar cavitation, which in turn significantly affects turbulence and kinetic energy in the closed region.
Liquid nitrogen is one of the most commonly applied thermo-sensitive fluids whose cavitation has been widely investigated. Holl et al. (1975) studied the variation of temperature and pressure in the cavitation region around ogive bodies with different diameters and established a connection between cavitation number and thermodynamic effects. Chen et al. (2017), Chen et al. (2019a), Chen et al. (2019b) studied the unsteady dynamic evolution of cavitating flow of liquid nitrogen at different temperatures and free flow rates, revealing the transient characteristics in the flow. De Giorgi et al. (2020) investigated cavitating flows of water, liquid hydrogen, and nitrogen on hydrofoils numerically using Eulerian homogeneous mixture approach. Thermal effects have been introduced by means of the activation of energy equation and latent heat source terms plus convective heat source term. Ohira et al. (2012) studied the instability of supercooled fluid nitrogen cavitation flow at different temperatures. They found that when the liquid temperature decreased, the cavitation model changed from a continuous model to an intermittent model. In addition, the oscillation pressure of the continuous model is much smaller than that of intermittent model. Shi and Wang (2020) used the improved Merkle cavitation model and the filter-based turbulence model to numerically analyze the influencing factors of the thermal effect produced by the cavitation flow of liquid nitrogen and hydrogen. Niiyama et al. (2012) studied the thermal effect of liquid nitrogen hollow flow and confirmed that such product inhibited the development of cavitation. However, the cavitation characteristics in thermosensitive fluids deserve further study.
The whole cavity evolution is accompanied by the change of eddy current, especially for thermal fluid. The purpose of this study is to establish the relationship between force evolution, flow separation, cavity growth, shedding and collapse (including corresponding connections through vortices).The flow separation in the cavitating flow field is influenced by cavity development and exacerbates flow instability. In addition, the flow separation due to cavitation is significantly influenced by vortices. Chen J et al. (2017) found that the cavity oscillates under the influence of the surrounding vortex flow field. Wang et al. (2019) theoretically studied the instability of non-Newtonian liquid jets with cavitating bubbles and found that the compressibility of the liquid led to flow instability. Li LM et al. (2021) studied the tip leakage cavitation flow and found that the cavitation characteristics were affected by the tip leakage vortex and the tip separation vortex. Kumar et al. (2018) simulated the separated flow in the laminar boundary layer, studied the flow separation mechanism, and proposed a separation model of steady-state flow.
Cavitation would cause force fluctuations in devices. Hsu and Chen, (2020) found that the amplitude of lift and drag increased along the standard slit in the cylinder. Zhu et al. (2015b) studied the cavitation flow of liquid hydrogen on ogive using the compressible Schnerr-Sauer cavitation model. In addition, they calculated the unsteady evolution of steam content, temperature and pressure fields in the cavity, and extended the schnerr Sauer model to simulate cavitation in cryogenic fluids (Zhu et al., 2015a). Keller (2001) experimentally studied the lift and drag coefficients under different cavitation numbers by testing other objects. Their experimental results show that lift is closely related to cavitation. Liu et al. (2020) studied the lift and drag fluctuations caused by the vortex structure caused by the evolution of the cavity on the hydrofoil. Seif et al. (2009) proposed a non-constant algorithm to simulate the cavitation problem in practical engineering applications, and determined the time-varying characteristics of the resistance coefficient during cavitation. They found that a certain degree of cavitation changed the mechanical properties and energy distribution, so the lift and resistance of the rotating body head fluctuated within a specific range. Ehara et al. (2019) conducted experimental research on lift and drag, and found that lift and drag move reasonably with the development of cavitation. Jafari and Rad, (2009) simulated the cavitation flow on the cylinder surface and observed the relationship between the cavitation number and lift and drag. De Giorgi et al. (2019) studied the relationship between lift and drag and three cavitation States, namely, cavitation, cloud cavitation and super cavitation. Shen et al. (2020) studied the relationship between hydrofoil surface lift resistance and cavity development. They found that with the increased cavitation number, the time average lift and drag coefficients first increased and then decreased. In addition, the downward trend of the drag coefficient is greater than that of the lift coefficient.
In thermal cavitation flow, the evolution of the cavity leads to the change of flow state. Flow separation and reattachment also occur frequently. At the same time, the development of cavity is inseparable from the evolution of the force. In the current work, we focus on analyzing of flow separation and detail change to reveal the detailed interaction between cavitation and flow characteristics. The improved ZGB cavitation model is realized and combined with the uniform mixing model to simulate the cavitation flow of liquid nitrogen around the oval structure. This paper first introduces the numerical model and its verification, then analyzes the transient flow field caused by cavitation, the influence of cavitation on flow separation, and the evolution of force with the development of cavitation. Finally, some conclusions are given. The conclusions obtained can provide theoretical support for the internal flow of cryogenic cavitation.
Base on the ZGB cavitation model, the thermodynamic benefits are considered for correction.
Both the gas and liquid phases are considered homogeneous mixtures during the simulation, and the governing equations are formulated as
where u and p are the velocity and pressure, x and the subscripts, i, ϳ, and k represent the axes, μm and μt are the dynamic and turbulent viscosities of the mixture, λm and λt denote thermal conductivity and turbulent thermal conductivity, Τ denotes temperature, Cpm and L denote specific and latent heat,
where RB = 1 × 10⁻⁶ m is the bubble diameter, αnuc = 5 × 10⁻⁴ is the volume fraction of the nucleation point, Kl is the thermal conductivity of the liquid, Cl is the specific heat capacity, hb is the convective heat transfer coefficient, C0 is the empirical coefficient, and C0hb is the recommended as 1 W/(m2K).
Since the saturation vapor pressure of liquid nitrogen pv (T) varies with temperature, a polynomial fit is used to represent the saturation vapor pressure:
where
The temperature field in cavitating flows, usually has thermal effects, is mainly determined by the heat transfer between the gas and liquid phases. Therefore, the results of compressibility and viscous dissipation in the energy equation are not considered for the time being. The density, dynamic viscosity, and enthalpy are calculated as
where Τ is the temperature of the liquid nitrogen, Cl and Cv represent the liquid and vapor heat capacities.
The turbulence model SST k- ω is used in this paper. Numerical results are obtained by simulating the cavitating flow of liquid nitrogen in an axisymmetric body with a radius of 0.357 inches. The experimental values were obtained from Hord (1973), who performed sub-scale experiments on the cavitating flow of thermo-sensitive liquids with funding from NASA. The main body consists of a cylinder with a quarter-circular radius bend and is placed inside a transparent plastic tube. Five pressure and temperature sensors are arranged on the upper and lower surfaces of the ogive. Strictly follow the experimental conditions to confirm the accuracy of the numerical method.
Figure 1 shows the structure used in the numerical simulation. The boundary condition without a sliding wall is imposed on the oval surface (Liu et al. (2021)). The conditions of numerical simulation are set according to the experiment to ensure the reliability of the simulation results.
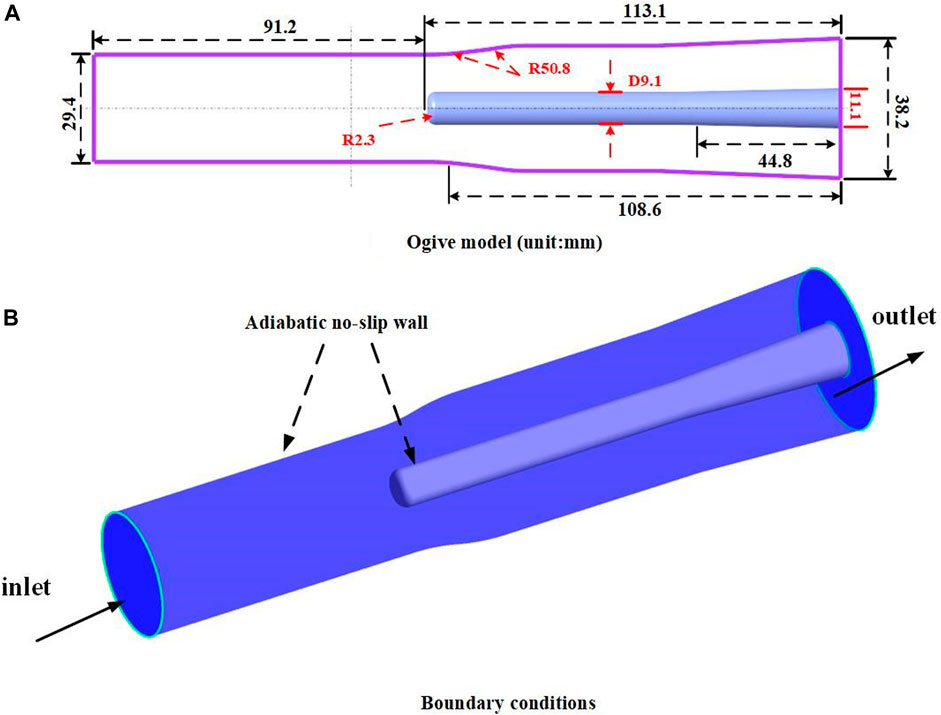
FIGURE 1. Computational domain and boundary conditions.
In the present study, The RMS residual is reduced to 10–4, and 20 iterations are selected in each time step to balance computing resources and accuracy. The simulation of unsteady thermal cavitation flow begins with the results of steady-state cavitation flow. In the simulation process, the time-dependent governing equations are discretized in the space and time domains. The diffusion term is solved by the second-order central difference scheme. The time-dependent second-order implicit algorithm is used for the transient term.
The computational domain of numerical simulation is discretized by structural hexahedral mesh. The mesh close to the wall is refined to improve the quality of the whole mesh and ensure the simulation accuracy. The conditions for the numerical simulation are obtained from Hord’s experiments (Hord, 1973), and the details are given in Table 1. The mesh independence analysis is performed in Figure 2, and it can be seen that the calculation results are relatively consistent for all three meshes. Therefore, mesh 2 (4403880 nodes and 4505476 elements) is adopted in the following calculations due to the limitation of computational resources. Figure 3 shows some details of mesh 2. The mesh is refined near the head and wall to ensure the accuracy of the calculation.
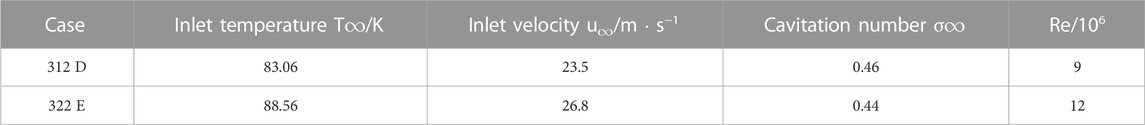
TABLE 1. Conditions for simulation.

FIGURE 2. Mesh independence verification.
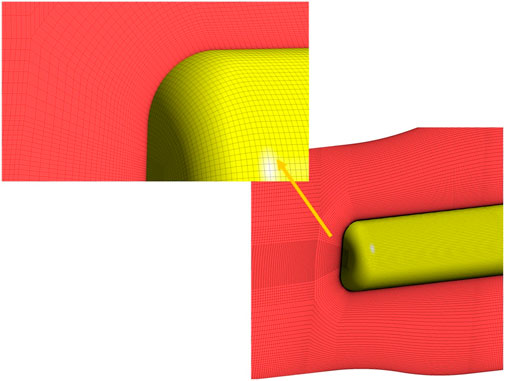
FIGURE 3. Mesh details of the computational domain.
The accuracy of numerical simulation is validated using the pressure and temperature distributions for the two conditions. Figure 4 shows the comparison between simulation and experimental data (hord, 1973), which agrees well with experimental data. Therefore, the simulation is reliable. In addition, there are temperature and pressure drop at the large curvature of the head. Then it gradually stabilized with the flow of liquid nitrogen and the development of the cavity.
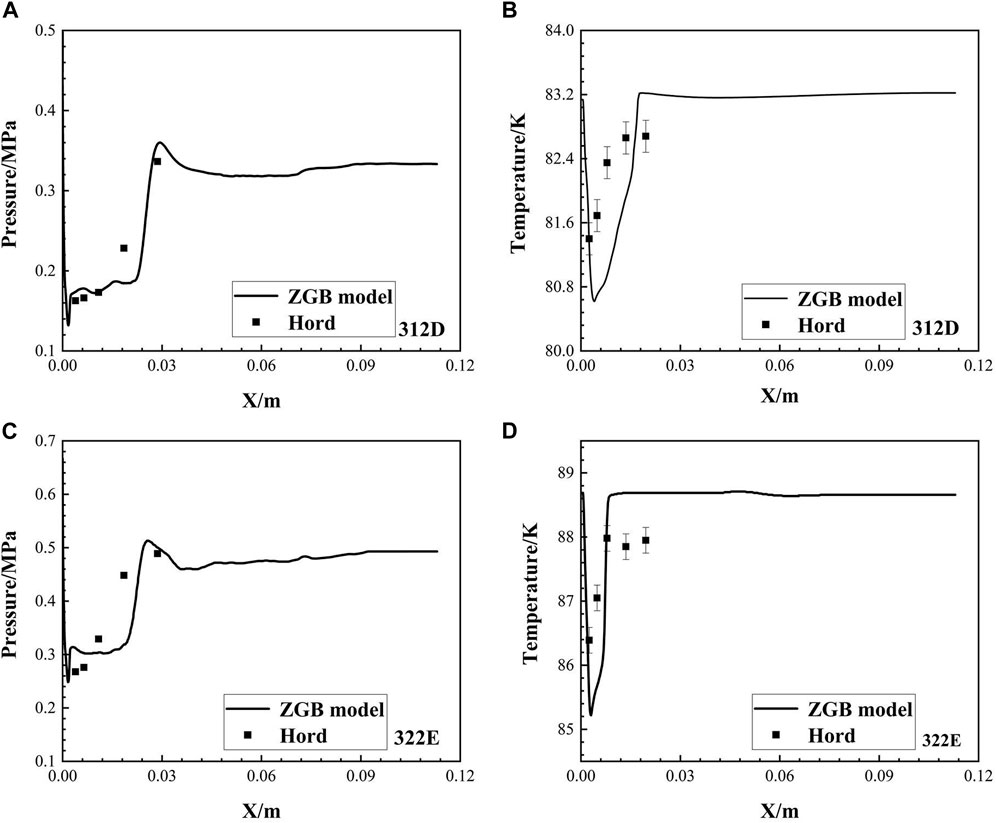
FIGURE 4. Comparison of pressure and temperature results between experiment and simulation.
In Figure 4, we can see that the low temperature and pressure areas are located around the cavitation area near the head, which is due to the sudden change of the leading edge of the oval structure, resulting in a large amount of vaporization. Meanwhile, the development of the cavity will also change the flow field. Once cavitation occurs, reentrant jets, flow separation and reattachment will frequently occur around the cavity. Such complex and variable flow phenomena will in turn affect the growth and shedding of cavities. Therefore, the following sections will analyze the interaction between cavitation development and flow field, as well as the impact on the temperature field and pressure field. By comparing between the two conditions, the cavitation number of condition 322 E is a bit smaller, indicating stronger cavitation, and thus the temperature drop is more significant.
To further analyze the flow field characteristics in the process of cavity development, the cavitation shedding cycle under 312 days condition is used to explain. The temperature and pressure distribution during the different periods of cavitation are shown in Figure 5. At the beginning of cavitation, the generation of cavitation will lead to changes in temperature and pressure. The low temperature and low-pressure area are mainly in the cavity. As the cavities gradually cover the surface, a few shedding cavities appear in the flow channel. It is caused by the unstable shedding of cavities. The low temperature and pressure areas are mainly in the head, which is consistent with Figure 4.
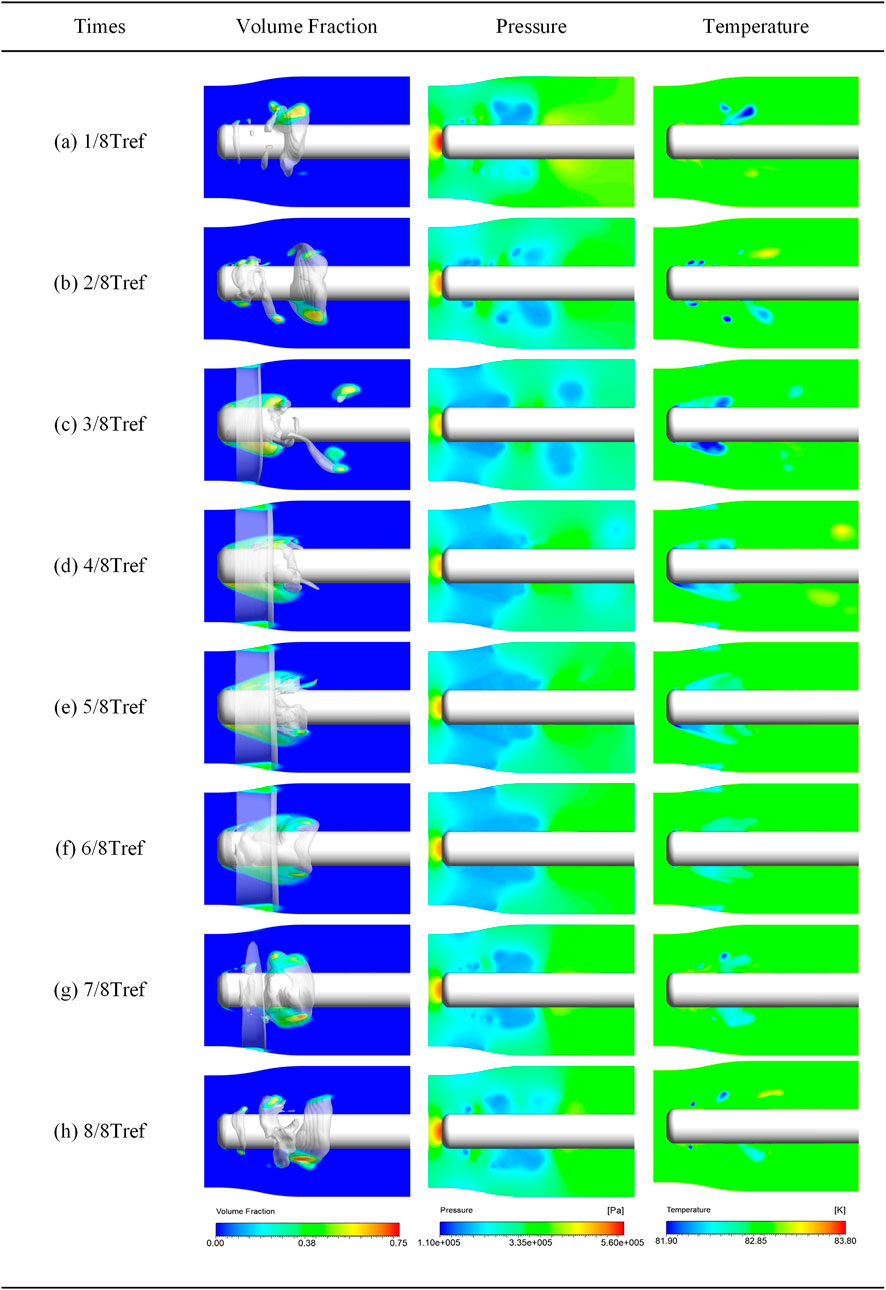
FIGURE 5. Changes in cavity, temperature and pressure in a cavitation shedding cycle.
In temperature-sensitive cavitating flow, the pressure and temperature in the cavity are lower than those in other regions, resulting in a more severe cavitation phase transition. When the cavity is steadily covered by the surface, the re-entrant jet caused by the cavity development will have a better chance to enter the interior of the cavity. The free fluid flowed easily into the cavity as described by (Sun et al., 2019), because the liquid/vapor density ratio of liquid nitrogen under low temperatures would generate large cavity bubbles according to the conservation of mass (
In Figure 6, four moments in a cavitation shedding cycle are shown at the 312 D operating condition. In the figure, the growth and shedding of cavities severely disturb the flow state. In Figure 6A, the flow state at A is disturbed. Around the shedding cavity, the flow state is constantly being altered. At the rear, significant re-attachment can be seen where the cavities are shedding. In Figures 6A, B, flow separation and re-attachment around the cavity frequently occur. In Figure 6B, the re-entrant jet, flow separation and re-attachment phenomena occur frequently around the cavity. Such complex and variable flow phenomena will in turn affect the growth and shedding of cavities. Thus the development of the cavity leads to a change in the flow state, which in turn destabilizes the cavity and accelerates the cavity shedding Figure 6D.
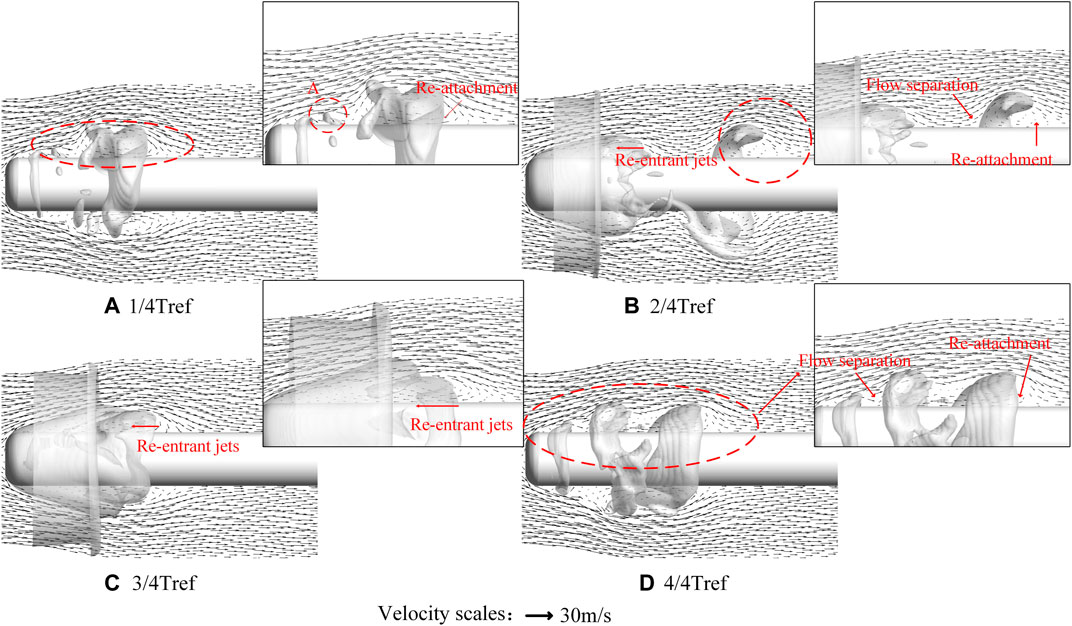
FIGURE 6. Cavity development and velocity streamlines.
The development of the cavity will affect the flow state, and then affect the falling off and growth of the cavity. The BVF can be used to describe the flow state, so the BVF needs to be introduced to investigate the interaction between flow and cavity. This section uses the 312 D operating condition as an example. Without considering compressibility, the root of all vortex generation and diffusion is boundary vorticity flux (BVF), which is the core theory of boundary vorticity dynamics. The BVF proposed by Lighthill, (1963) consists of the following components:
where σα, σP, and στ represent the BVF induced by wall acceleration a, the normal stress
Besides BVF, vorticity lines are also used to study flow separation from cavitation effects (Liu et al., 2021). According to the boundary vortex dynamics theory, the flow separation is manifested by the formation of a shear layer and the separation of fluid from the wall. The vortex dynamics is particularly critical in the separation zone, which connects the attached boundary layer and the separated shear layer, and exhibits the same properties as both layers. Generally, in the flow separation region, the vorticity line has a highly pronounced bend and high curvature. The peak of the BVF is usually found in this region.
In temperature-sensitive cavitation flow, the evolution of cavitation is closely related to the change of flow state. Figures 7, 8 illustrate the vortex structure around the cavity and the variation of BVF during a cavitation shedding cycle. Figure 9 shows the change in the vorticity line.
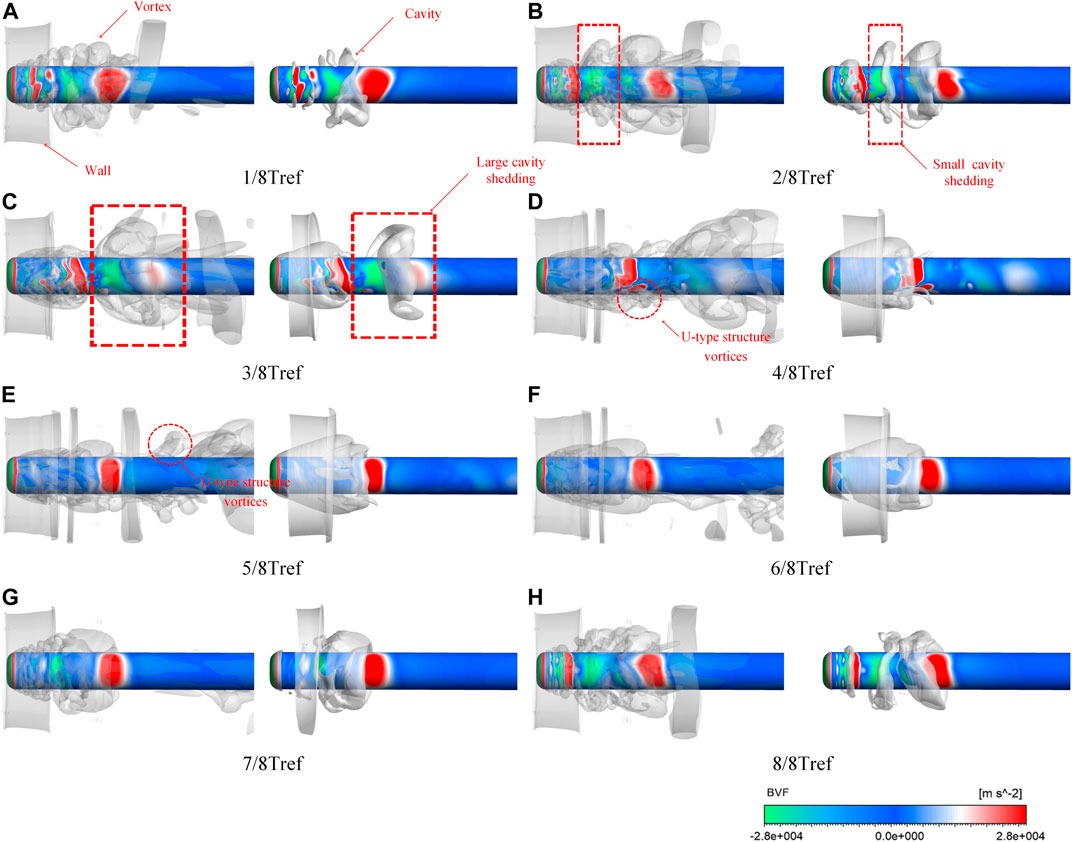
FIGURE 7. Vortices, cavities and BVF distributions.
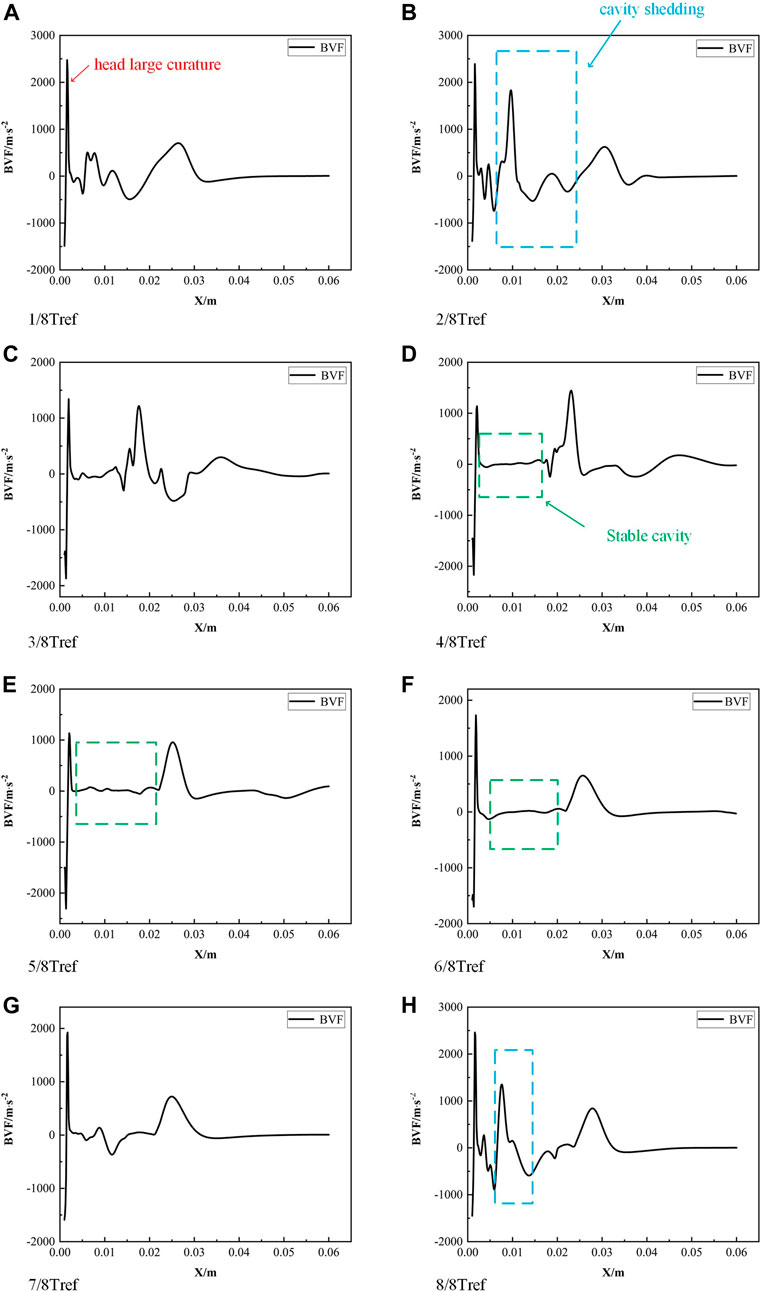
FIGURE 8. Changes in BVF.
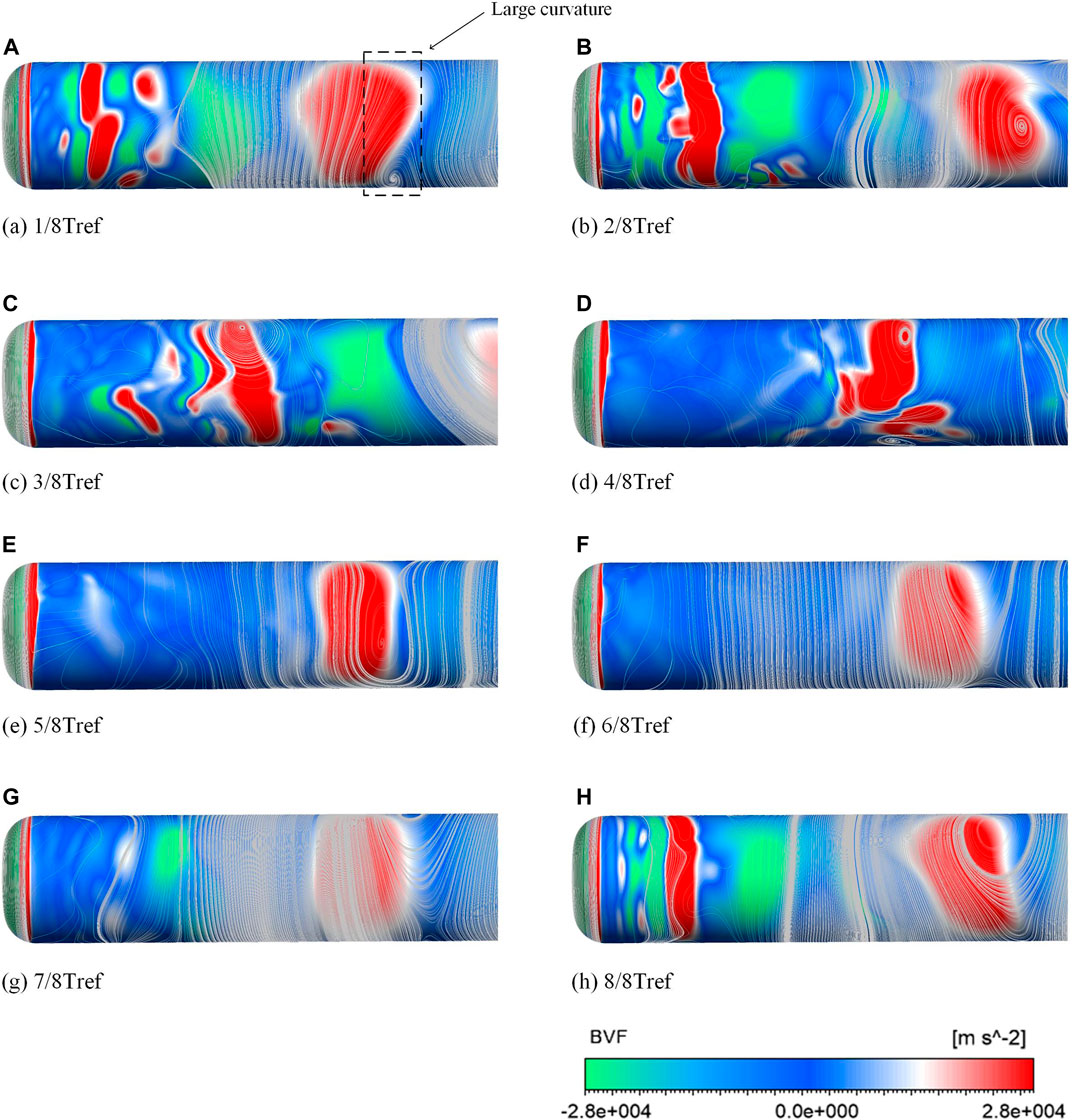
FIGURE 9. Vorticity line and BVF on the ogive surface.
In Figures 7, 8, it can be seen that the BVF varies significantly at the large curvature of the head. A rapid increase in BVF indicates that the flow state has changed dramatically. Then, at 1/8 T the shed cavities are randomly distributed on the surface. Therefore, the flow state becomes irregular and the BVF fluctuates (Figure 8A). It shows that the change in flow state at this point is mainly influenced by the shedding cavity. As the cavity shed, a stable area of peak BVF is created around it and the BVF changes significantly at this point (Figure 8B). A negative peak in the BVF and a significant bend in the vorticity line (Figure 9B) indicate that flow separation occurs at this point (Figure 6A). Also, when the cavity is shedding, the values of BVF increase rapidly from negative to positive. It shows that the flow separation and re-attachment around the cavity occur at the same time. In Figure 9, it can be noticed that the large curvature vorticity lines often appear with large values of the BVF. Combined with Figure 7, it can be seen that the changes in vortex structure caused by the shedding cavity can also lead to the appearance of large curvature vorticity lines. Therefore, the difference in fluid state is mainly influenced by the cavity in the cavitating flow.
When the attached cavity appears at the head of the structure, a reentrant jet will be generated and enter the cavity, as shown in Figures 6B, C. Colliding with the incident flow, the flow state inside the cavity will be changed. However, as shown in Figure 8, the change in BVF is not significant at this time (Figures 8C–F). This is because the change in internal flow state being suppressed by the attached cavity. It can be seen in Figure 9 that in the area with an additional cavity, there is only a tiny curvature vorticity line. This indicates that the flow in the cavity is relatively stable. At the same time, in the tail of the cavity, with the development of the additional cavity and the emergence of the falling cavity, the vortex structure will change. At this time, the BVF value rapidly increases from negative to positive. At 4/8Tref, a typical U-shaped vortex structure is formed. This shows that the reentrant jet is not only produced at the end of the cavity, but also the flow state becomes turbulent with the change of the flow direction. So reentry, flow separation and reattachment phenomena will occur frequently around the cavity. And this complex and variable flow phenomenon will in turn affect the growth and shedding of cavities.
When the shedding of the attached cavity starts, the flow state gradually changes around the head of the structure. In Figures 7G, H, the values of BVF change rapidly around the shedding cavity. We can find that the BVF around the shedding cavity decreases quickly from positive to negative values, while large curvature vorticity lines appear (Figure 9H). This indicates that significant flow separation occurs at the front of the opening and flow the reattachment occurs at the rear. Therefore, the combination of BVF and vorticity line can well reveal and predict the flow state.
In summary, the development of the cavity seriously affects the flow state. The production of the reentrant jets is the main reason for the complexity of the flow state in the additional cavity. The production of the reentry jet also accelerates the falling off of the cavity. Cavity shedding causes the BVF value to increase from negative to positive. Combined with the changes in BVF and vorticity line, they can predict the phenomena of flow separation and reattachment.
This section will analyze the variation of lateral force and drag during cavity development. Lee et al. (2012) examined the fluid to finite wing up lateral force and drag, and found that the forces applied on the wing surface can be classified into surface and volume forces. The equations for lateral force and drag forces are
where
The forces and the moments on the arbitrarily shaped objects can be expressed as integrals of the BVF, for arbitrary wall surface
The x is the position vector and establishes the relationship between BVF and force.
In the case of large Reynolds numbers,
Because the oval surface changes little in the X direction, the influence of BVF in the force element can be concentrated on the resistance. This can better explain the changes of force elements in the process of cavity development.
Figure 10 is selected from one cycle of the 322 E operating condition and describes the detailed vortex structures. In Figure 10A, it can be seen that in the middle stage of the cavity development, more U-type structures appear on the surface, which means that at this time, there is more cavity shedding to create disturbances. During the cavity development, cavity shedding and a fracture of structures are observed on the cloud cavities attached to the cylinder surface, enhancing vorticity and the 3D nature of velocity gradients in the corresponding regions. In the instantaneous 2/8Tref, 4/8Tref, 6/8Tref, and 8/8Tref moments, the multiscale nature of vorticity and its three-dimensional structure become more obvious with the significant enhancement of its intensity. The unstable vortex extends further into the wake, and a small-scale cylindrical vortex appears in the spanwise vortex. At this point, the wake becomes more complex. Therefore, in this paper, we will focus on the cavity development caused by the change of resistance and lateral force.
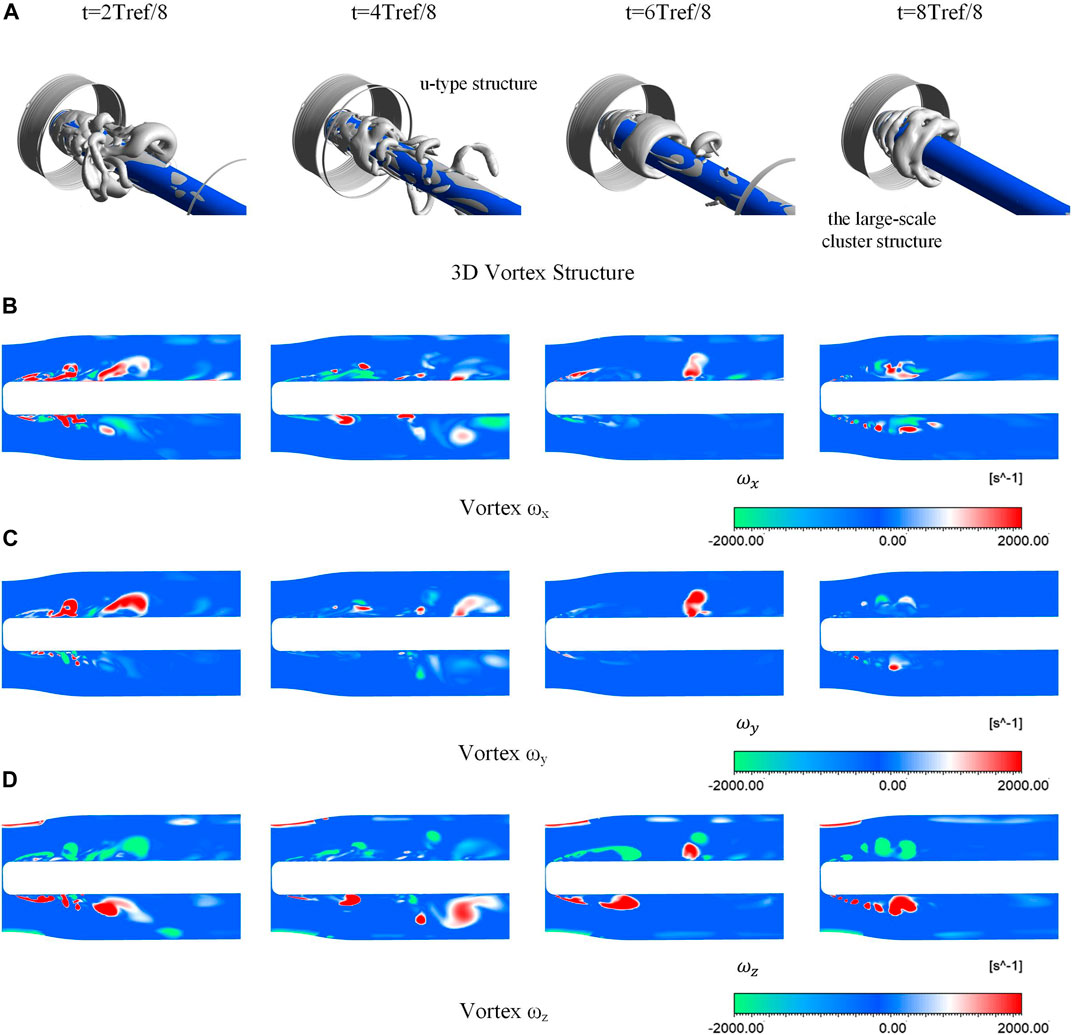
FIGURE 10. Distribution of vorticity.
Figure 11 shows the variation of lateral forces on the ogive surface for the two operating conditions. The points a - h are the moments for further investigation in the following words in a cavitation shedding cycle for a better understanding. In Figure 11, the fluctuation of 322 E is higher compared to 312 D conditions. Figure 12 shows the change in drag for the two states. The shift in drag can be seen to be cyclical, with the drag first decreasing and then increasing during a cavitation shedding cycle. The 322 E condition shows a larger drag value, and this is due to the more significant cavity generated by the increased temperature.
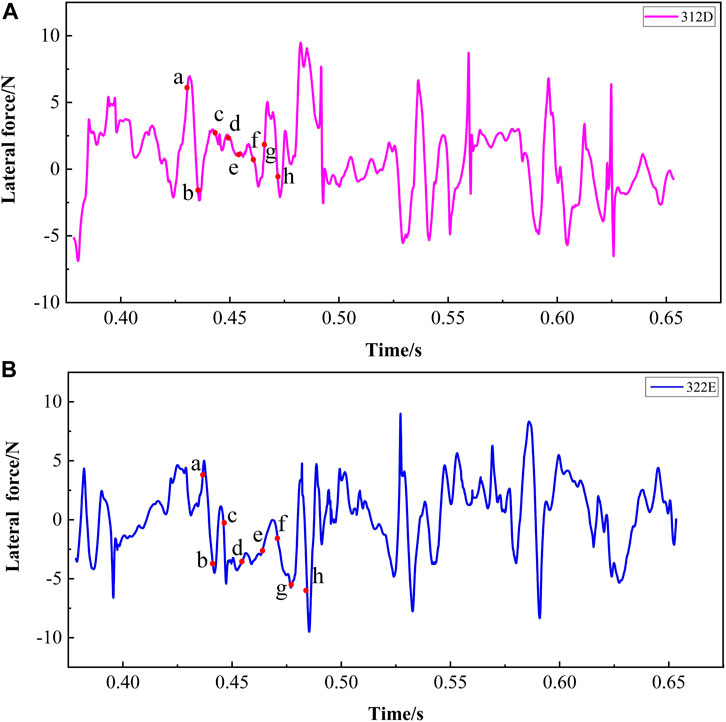
FIGURE 11. Periodic variation of ogive surface lateral force under two conditions.
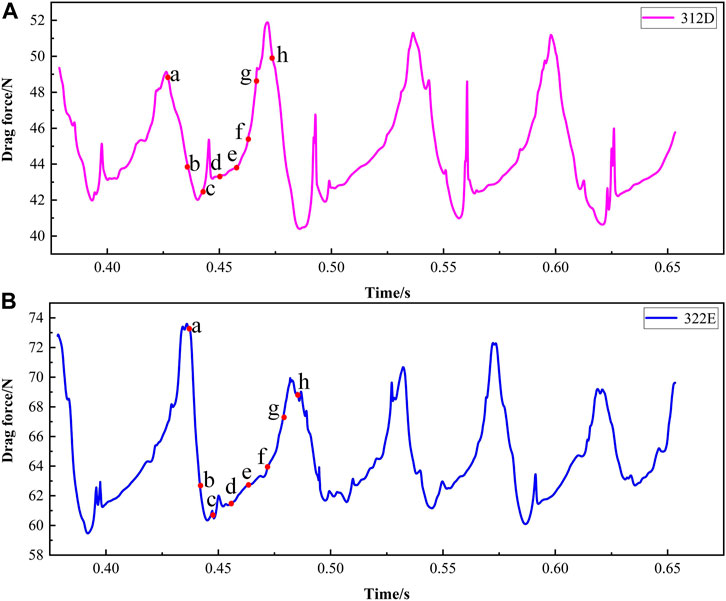
FIGURE 12. Periodic variation in ogive surface drag under the two conditions.
According to the above, the flow state on the ogive surface is influenced by the development of the cavity. Combined with the changes of lateral force and resistance operating conditions in Figures 11, 12, it can be seen that under a series of conditions, the lateral force changes less with the increase of temperature. In contrast, the resistance increases with the rise in temperature. Also, the asymmetry of cavity development can lead to oscillations in the variation of lateral forces and drags. Therefore it is necessary to analyze the changes in lateral force and drags in connection with the cavitation shedding cycle.
The change in vorticity force is explained by selecting a cycle in the 322 E condition. In Figure 13A, the drag decreases and increases as the cavity develops. The reason for this change can be explained as follows: at the beginning of the stage, the falling cavity leads to a reduction in resistance. With the progress of cavitation, the falling cavity gradually collapses, and the generation of the attached cavity leads to the increase of resistance. In the later stages of cavitation, the attached cavity begins to shed, and the drag decreases again as many negative drag elements are generated. The lateral forces, on the other hand, fluctuate in the development of the cavity due to the asymmetrical characteristics of the growth and shedding of the cavity. In the next section, the cavity development is divided into eight moments according to Figure 13 to explain the detailed effects of cavity development on drag and lateral forces.
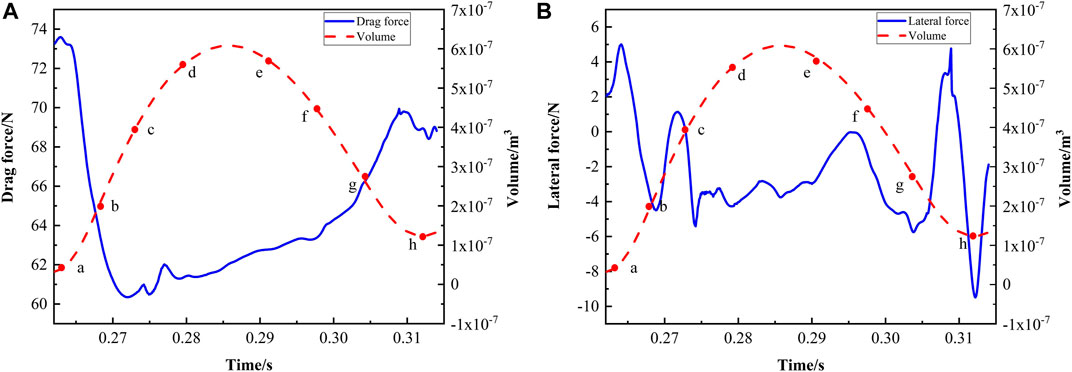
FIGURE 13. Lateral force-drag variation in cavity development and streamlines in the flow field.
Figures 14, 15 show the vorticity forces and the corresponding BVF distributions at eight moments in a typical cycle. In Figure 14, the positive lateral force elements point to the y direction, and the negative lateral force elements point to the reverse y direction, which means that the cavitation makes the force elements point out of the surface around the cavity. As the cavity and vapor cloud distributions are unsymmetrical, the numbers of positive and negative lateral force elements are different, which makes the lateral force fluctuate. As seen from Figures 14G, H, the negative lateral force elements are more than the positive lateral force elements, which makes the total lateral force negative.
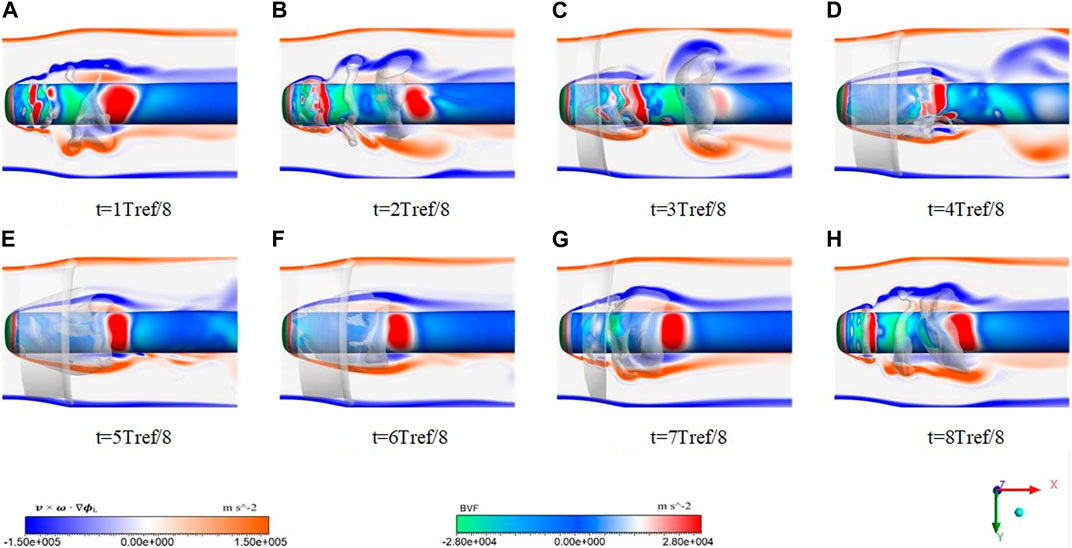
FIGURE 14. Evolution of lateral force element and BVF in a cavitation shedding cycle.
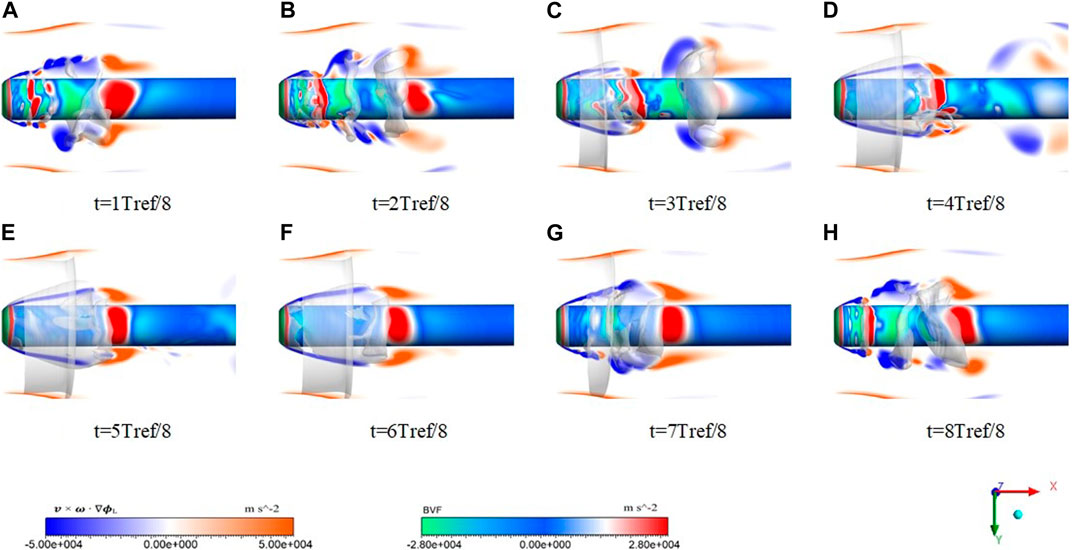
FIGURE 15. Evolution of drag force element and BVF in a cavitation shedding cycle.
In Figure 15, negative resistance elements are generated in front of the open cavity and around the additional cavity. In contrast, positive resistance elements are concentrated behind the cavity pointing in the y direction. Cavity development can be divided into three stages: cavity falling off stage, different cavity generation stage and additional cavity falling off stage. The cavity falling off stage is shown in Figures 15A, B, in which the cavity falls off. The negative resistance element appears in front of the falling off cavity, which is significantly larger than the positive resistance element, so the resistance decreases at this stage. Then, the shed cavity collapses and the attached cavity grows (Figure 15C). At the back of Figure 15C, the negative resistance element decreases with the collapse of the falling cavity. In contrast, around the attached cavity, the positive resistance element gradually increases, and the resistance begins to increase. Then, in Figures 15D–F, the negative resistance elements decrease with the development of the other cavity, and more positive resistance elements appear at the end of the additional cavity. It can be seen that the positive resistance elements are more than the negative resistance elements, so the resistance increases at this stage. In Figure 15C, since there is still a falling cavity, the resistance rises slowly at this stage. In Figure 15F, when only an attached cavity exists, the resistance increases rapidly. In Figure 15H, the attached cavity begins to fall off, producing negative resistance elements. At this time, the negative resistance elements are more than the positive ones, and the resistance starts to decrease.
In summary, the lateral force element points out of the surface around the cavity under the effect of cavitation. As the distribution of cavities and vapor clouds is asymmetrical, the amount of positive and negative lateral forces are different, which leads to fluctuations in lateral forces. The resistance decreases first and then increases with the development of cavitation. Negative resistance units are distributed in front of the open cavity and around the additional cavity, while positive resistance units are distributed behind the cavity.
The thermal cavitation model based on the ZGB model is used to simulate the thermal cavitation flow of liquid nitrogen on the oval surface. The BVF is used to study the flow separation under the influence of cavitation, and force element analysis is used to reveal the force evolution mechanism caused by cavitation shedding. Through cavitation flow and mechanical analysis, the internal flow mechanism of fluid machinery can be revealed, which can provide theoretical guidance for the design of fluid machinery. The main research results are summarized as follows.
(1) The reentrant jet generated by cavity growth will enter the cavity and collide with the incident flow to produce flow separation. At this time, the reentrant jet in the cavity is the main reason for flow separation. However, a stable cavity will inhibit the change of flow state, and the change of flow state in the cavity will accelerate the cavity falling off.
(2) The re-attachment usually occurs in the region where BVF decreases rapidly from positive values to negative values, while flow separation usually occurs where there are negative values. And in vorticity force studies, it has been shown that the distribution of drag usually shows the same trends as the value of BVF.
(3) The force element method can provide the distribution of force elements in the process of cavitation development, and can well reveal the evolution mechanism of force in cavitation flow. For lateral forces, the existence of cavities makes lift force elements point out of the surface. The random cavity shedding induced by the turbulence makes the distribution of the vapor cloud asymmetrical, which leads to fluctuations in the lateral force.
(4) In the process of cavitation development, negative resistance units are produced at the front of the cavity, while positive resistance units are made at the end of the cavity. In the early stage of cavitation, the falling off of the attached cavity and the appearance of a large number of negative resistance elements lead to reduced resistance. With the gradual formation of the attached cavity and the gradual increase of positive resistance elements, the resistance will increase.
The raw data supporting the conclusion of this article will be made available by the authors, without undue reservation.
YL proposed the overall idea and experimental framework of this study, JZ, LS, and LA designed and implemented specific implementation methods of the research, the other authors carried out the specific steps of numerical simulation research and reviewed the results.
The authors are grateful to the support by the National Natural Science Foundation of China (Grant Nos. 52006197, 52076196), the Natural Science Foundation of Zhejiang Province (Grant Nos. LGG21E060002, LR20E090001), the Key Research and Development Program of Zhejiang Province (Grant Nos. 2021C05006, 2021C01156).
Authors YL, JZ, LS, and LA was employed by the company Hangzhou New-Asia Cryogenic Science and Technology Co., Ltd.
The remaining authors declare that the research was conducted in the absence of any commercial or financial relationships that could be construed as a potential conflict of interest.
All claims expressed in this article are solely those of the authors and do not necessarily represent those of their affiliated organizations, or those of the publisher, the editors and the reviewers. Any product that may be evaluated in this article, or claim that may be made by its manufacturer, is not guaranteed or endorsed by the publisher.
Abderrezzak, B., and Huang, Y. (2016). A contribution to the understanding of cavitation effects on droplet formation through a quantitative observation on breakup of liquid jet. Int. J. Hydrogen Energy 41 (35), 15821–15828. doi:10.1016/j.ijhydene.2016.04.209
Cervone, A., Bramanti, C., Rapposelli, E., and d’Agostino, L. (2006). Thermal cavitation experiments on a NACA 0015 hydrofoil. J. Fluids Eng. 128, 326–331. doi:10.1115/1.2169808
Chen, J., Lin, F. Y., and Zou, J. (2017). Experimental investigation of vortex-ring cavitation. J. Zhejiang University-SCIENCE A 18 (7), 545–552. doi:10.1631/jzus.a1600537
Chen, T. R., Chen, H., Liang, W. D., Huang, B., and Xiang, L. (2019a). Experimental investigation of liquid nitrogen cavitating flows in converging-diverging nozzle with special emphasis on thermal transition. Int. J. Heat Mass Transf. 132, 618–630. doi:10.1016/j.ijheatmasstransfer.2018.11.157
Chen, T. R., Chen, H., Liu, W., Huang, B., and Wang, G. (2019b). Unsteady characteristics of liquid nitrogen cavitating flows in different thermal cavitation mode. Appl. Therm. Eng. 156, 63–76. doi:10.1016/j.applthermaleng.2019.04.024
Chen, T. R., Huang, B., Wang, G., Zhang, H., and Wang, Y. (2017). Numerical investigation of thermo-sensitive cavitating flows in a wide range of free-stream temperatures and velocities in fluoroketone. Int. J. Heat Mass Transf. 112, 125–136. doi:10.1016/j.ijheatmasstransfer.2017.04.023
Chen, Z. D., Yang, S. D., Li, X. J., Li, Y., and Li, L. (2023). Investigation on leakage vortex cavitation and corresponding enstrophy characteristics in a liquid nitrogen inducer. Cryogenics 129, 103606. doi:10.1016/j.cryogenics.2022.103606
De Giorgi, M. G., Fontanarosa, D., and Ficarella, A. (2019). Characterization of unsteady cavitating flow regimes around a hydrofoil, based on an extended Schnerr–Sauer model coupled with a nucleation model. Int. J. Multiph. Flow 115, 158–180. doi:10.1016/j.ijmultiphaseflow.2019.03.025
De Giorgi, M. G., Ficarella, A., and Fontanarosa, D. (2020). Numerical investigation of nonisothermal cavitating flows on hydrofoils by means of an extended schnerr–sauer model coupled with a nucleation model. ASME. J. Eng. Gas. Turbines Power 142 (4), 041003. doi:10.1115/1.4044352
Ehara, Y., Kitamura, S., Tsuru, W., Watanabe, S., and Tsuda, S. I. (2019). Unsteady forces and moments acting on a cantilevered rectangular hydrofoil with tip clearance in cavitating conditions. IOP Conf. Ser. Earth Environ. Sci. 240 (6), 062054. doi:10.1088/1755-1315/240/6/062054
Franc, J. P., Janson, E., and Morel, P. (2001). Visualizations of leading edge cavitation in an Inducer at different temperatures. Fourth International Symposium on Cavitation. Canada: 124-130. Available at: https://resolver.caltech.edu/CAV2001:sessionB7.002.
Gopalan, S., and Katz, J. (2000). Flow structure and modeling issues in the closure region of attached cavitation. Phys. fluids 12 (4), 895–911. doi:10.1063/1.870344
Holl, J. W., Billet, M. L., and Weir, D. S. (1975). Thermodynamic effects on developed cavitation. J. Fluids Eng. 97 (4), 507–513. doi:10.1115/1.3448095
Hord, J. (1973). Cavitation in liquid cryogens. 3: Ogives. Washington, D. C: National Aeronautics And Space Administration.
Hsu, L. C., and Chen, C. L. (2020). The drag and lift characteristics of flow around a circular cylinder with a slit. Eur. J. Mech. - B/Fluids 82, 135–155. doi:10.1016/j.euromechflu.2020.02.009
Jafari, G. I., and Rad, M. (2009). Experimental analysis of cavitation effects on drag force and back pressure of circular cylinder with free turbulence. Sci. Iran. 16 (4), 221–225.
Joseph, D. D. (1995). Cavitation in a flowing liquid. Phys. Rev. E 51 (3), R1649–R1650. doi:10.1103/PhysRevE.51.R1649
Keller, A. P. (2001). Cavitation scale effects - empirically found relations and the correlation of cavitation number and hydrodynamic coefficients. Fourth International Symposium on Cavitation. Available at: https://resolver.caltech.edu/CAV2001:lecture.001.
Kelly, S., and Segal, C. (2015). Characteristics of thermal cavitation on a two-dimensional hydrofoil. J. Propuls. Power 29 (2), 410–416. doi:10.2514/1.B34707
Kikuta, K., Yoshida, Y., Watanabe, M., Hashimoto, T., Nagaura, K., and Ohira, K. (2008). Thermodynamic effect on cavitation performances and cavitation instabilities in an inducer. J. Fluids Eng. 130 (11), 111302. doi:10.1115/1.2969426
Kumar, D., Sourav, K., Sen, S., and Yadav, P. K. (2018). Steady separation of flow from an inclined square cylinder with sharp and rounded base. Comput. Fluids 171, 29–40. doi:10.1016/j.compfluid.2018.05.020
Lee, J. J., Hsieh, C. T., Chang, C. C., and Chu, C. C. (2012). Vorticity forces on an impulsively started finite plate. J. Fluid Mech. 694, 464–492. doi:10.1017/jfm.2011.563
Li, D., Liu, S., Wei, Y., Ren, T., and Tang, Y. (2018). A turbulent two-phase model for predicting cavitating flow based on homogenous nucleation theory. Int. Commun. Heat Mass Transf. 97, 17–29. doi:10.1016/j.icheatmasstransfer.2018.06.001
Li, L. M., Wang, Z. D., Li, X. J., and Zhu, Z. (2021). Multiscale modeling of tip-leakage cavitating flows by a combined volume of fluid and discrete bubble model. Phys. Fluids 33, 062104. doi:10.1063/5.0054795
Li, W. G., Yu, Z. B., and Kadam, S. (2023). An improved cavitation model with thermodynamic effect and multiple cavitation regimes. Int. J. Heat Mass Transf. 205, 123854. doi:10.1016/j.ijheatmasstransfer.2023.123854
Li, X. J., Liu, Y. Y., Zhu, Z. C., Lin, P., and Li, P. (2021). Boundary vorticity analysis and shedding dynamics of transient cavitation flow around a twisted hydrofoil. J. Fluids Eng. 143 (7), 071501. doi:10.1115/1.4050135
Liu, Y. Y., Li, X. J., Lin, Z., Li, L., and Zhu, Z. (2021). Numerical analysis of thermo-sensitive cavitating flows with special emphasises on flow separation and enstrophy conversion. Int. Commun. Heat Mass Transf. 125, 105336. doi:10.1016/j.icheatmasstransfer.2021.105336
Liu, Y. Y., Li, X. J., Wang, W. J., Li, L., and Huo, Y. (2020). Numerical investigation on the evolution of forces and energy features in thermo-sensitive cavitating flow. Eur. J. Mech. - B/Fluids 84, 233–249. doi:10.1016/j.euromechflu.2020.06.011
Long, X. P., Liu, Q., Ji, B., and Lu, Y. (2017). Numerical investigation of two typical cavitation shedding dynamics flow in liquid hydrogen with thermodynamic effects. Int. J. Heat Mass Transf. 109, 879–893. doi:10.1016/j.ijheatmasstransfer.2017.02.063
Merouani, S., Hamdaoui, O., Rezgui, Y., and Guemini, M. (2016). Computational engineering study of hydrogen production via ultrasonic cavitation in water. Int. J. Hydrogen Energy 41 (2), 832–844. doi:10.1016/j.ijhydene.2015.11.058
Niiyama, K., Yoshida, Y., Hasegawa, S., Watanabe, M., and Oike, M. (2012). “Experimental investigation of thermodynamic effect on cavitation in liquid nitrogen,” in Proceeding of the Eighth International Symposium on Cavitation, Singapore, 153–157.
Ohira, K., Nakayama, T., and Nagai, T. (2012). Cavitation flow instability of subcooled liquid nitrogen in converging-diverging nozzles. Cryogenics 51 (1), 35–44. doi:10.1016/j.cryogenics.2011.11.001
Šarc, A., Stepinik-Perdih, T., Petkovek, M., and Dular, M. (2017). The issue of cavitation number value in studies of water treatment by hydrodynamic cavitation. Ultrason. Sonochemistry 34, 51–59. doi:10.1016/j.ultsonch.2016.05.020
Seif, M., Asnaghi, A., and Jahanbakhsh, E. (2009). Drag force on a flat plate in cavitating flows. Pol. Marit. Res. 16 (3), 18–25. doi:10.2478/v10012-008-0028-2
Shen, T. J., Li, X. J., Li, L. M., Wang, Z., and Liu, Y. (2020). Evaluation of vorticity forces in thermo-sensitive cavitating flow considering the local compressibility. Int. Commun. Heat Mass Transf. 120, 105008. doi:10.1016/j.icheatmasstransfer.2020.105008
Shi, S. G., and Wang, G. Y. (2020). Numerical analysis of factors influencing thermal effects generated by cavitation flow of cryogenic fluids. Mod. Phys. Lett. B 34 (17), 2050184. doi:10.1142/S0217984920501845
Smirnov, N. N., Betelin, V. B., Shagaliev, R. M., Nikitin, V., Belyakov, I., Deryuguin, Y., et al. (2014). Hydrogen fuel rocket engines simulation using LOGOS code. Int. J. Hydrogen Energy 39 (20), 10748–10756. doi:10.1016/j.ijhydene.2014.04.150
Sun, T. Z., Wei, Y. J., Zou, L., Jiang, Y., Xu, C., and Zong, Z. (2019). Numerical investigation on the unsteady cavitation shedding dynamics over a hydrofoil in thermo-sensitive fluid. Int. J. Multiph. Flow 111, 82–100. doi:10.1016/j.ijmultiphaseflow.2018.11.014
Wang, X. T., Ning, Z., and Lü, M. (2019). Linear temporal instability analysis of a non-Newtonian liquid jet containing cavitation bubbles. Eur. J. Mech. - B/Fluids 77, 118–124. doi:10.1016/j.euromechflu.2019.04.014
Xu, B., Yang, K., Chen, Q. X., and Wang, H. (2022). Influence of thermal effects on the cavitation of orifices in nuclear power plants. Nucl. Eng. Des. 398 (2022), 111942. ISSN 0029-5493. doi:10.1016/j.nucengdes.2022.111942
Zhang, B. C., Li, Q. L., Wang, Y., Zhang, J. q., Song, J., and Zhuang, F. c. (2020). Experimental investigation of nitrogen flow boiling heat transfer in a single mini-channel. J. Zhejiang University-SCIENCE A 21 (2), 147–166. doi:10.1631/jzus.a1900468
Zhang, K., Hayostek, S., Amitay, M., He, W., and Theofilis, V. (2020). On the formation of three-dimensional separated flows over wings under tip effects. J. Fluid Mech. 895, A9. doi:10.1017/jfm.2020.248
Zhang, S. F., Li, X. J., Hu, B., Liu, Y., and Zhu, Z. (2019). Numerical investigation of attached cavitating flow in thermo-sensitive fluid with special emphasis on thermal effect and shedding dynamics. Int. J. Hydrogen Energy 44 (5), 3170–3184. doi:10.1016/j.ijhydene.2018.11.224
Zhang, S. F., Li, X. J., and Zhu, Z. C. (2018). Numerical simulation of cryogenic cavitating flow by an extended transport-based cavitation model with thermal effects. Cryogenics 92, 98–104. doi:10.1016/j.cryogenics.2018.04.008
Zhao, Y., Wang, G., Jiang, Y., and Huang, B. (2016). Numerical analysis of developed tip leakage cavitating flows using a new transport-based model. Int. Commun. Heat Mass Transf. 78, 39–47. doi:10.1016/j.icheatmasstransfer.2016.08.007
Zhu, J. K., Chen, Y., Zhao, D. F., and Zhang, X. (2015a). Extension of the Schnerr–Sauer model for cryogenic cavitation. Eur. J. Mech. B/fluids 52, 1–10. doi:10.1016/j.euromechflu.2015.01.008
Zhu, J. K., Zhao, D. F., Xu, L., and Zhang, X. (2015b). Interactions of vortices, thermal effects and cavitation in liquid hydrogen cavitating flows. Int. J. Hydrogen Energy 41 (1), 614–631. doi:10.1016/j.ijhydene.2015.10.042
C heat capacity
c velocity of sound
Cp pressure coefficient
hb convection heat transfer coefficient
k turbulent kinetic energy
K thermal conductivity
L latent heat
M mach number
p pressure
pv saturated vapor pressure
RB single spherical bubble radius
R constant
T temperature
V volume
u velocity
x subscripts
ρ density
μ dynamic viscosity
σ cavitation number
α volume fraction
ε turbulent eddy dissipation
λ thermal conductivity
∆T temperature drop
c empirical coefficient
i, j,k directions of the cartesian coordinates
l liquid phase
tur turbulence
v vapor phase
∞ reference
Keywords: thermo-sensitive cavitating flow, flow separation, boundary vorticity flux, vorticity force, force element
Citation: Liu Y, Zhang J, Sun L, An L, Wang X, Cai J, Zhang W and Chen F (2023) Numerical study on flow separation and force evolution in liquid nitrogen cavitating flow. Front. Energy Res. 11:1147069. doi: 10.3389/fenrg.2023.1147069
Received: 18 January 2023; Accepted: 27 February 2023;
Published: 09 March 2023.
Edited by:
Yang Yang, Yangzhou University, ChinaReviewed by:
Maria Grazia De Giorgi, University of Salento, ItalyCopyright © 2023 Liu, Zhang, Sun, An, Wang, Cai, Zhang and Chen. This is an open-access article distributed under the terms of the Creative Commons Attribution License (CC BY). The use, distribution or reproduction in other forums is permitted, provided the original author(s) and the copyright owner(s) are credited and that the original publication in this journal is cited, in accordance with accepted academic practice. No use, distribution or reproduction is permitted which does not comply with these terms.
*Correspondence: Wei Zhang, emhhbmd3ZWlAemltZS5lZHUuY24=
Disclaimer: All claims expressed in this article are solely those of the authors and do not necessarily represent those of their affiliated organizations, or those of the publisher, the editors and the reviewers. Any product that may be evaluated in this article or claim that may be made by its manufacturer is not guaranteed or endorsed by the publisher.
Research integrity at Frontiers
Learn more about the work of our research integrity team to safeguard the quality of each article we publish.