 Jiyang Wu
 Qiang Li
 Qian Chen1
95% of researchers rate our articles as excellent or good
Learn more about the work of our research integrity team to safeguard the quality of each article we publish.
Find out more
ORIGINAL RESEARCH article
Front. Energy Res. , 02 March 2023
Sec. Smart Grids
Volume 11 - 2023 | https://doi.org/10.3389/fenrg.2023.1144785
This article is part of the Research Topic Advances in Artificial Intelligence Application in Data Analysis and Control of Smart Grid View all 20 articles
In order to overcome the difficulty of fault diagnosis in the high-voltage direct current (HVDC) transmission system, a fault diagnosis method based on the categorical boosting (CatBoost) algorithm is proposed in this work. To make the research conform to the actual situation, three kinds of measured fault data in the HVDC system of the Southern Power Grid are selected as the original data set. First, the core role and significance of fault diagnosis in knowledge graphs (KGs) are given, and the characteristics and specific causes of the four fault types are explained in detail. Second, the fault dates are preprocessed and divided into the training data set and the test data set, and the CatBoost algorithm is employed to train and test fault data to realize fault diagnosis. Finally, to verify the progressiveness and effectiveness of the proposed method, the diagnostic results obtained by CatBoost are compared with those obtained by the BP neural network algorithm. The results show that the diagnostic accuracy of the CatBoost algorithm in the three test sets is always higher than that of the BP neural network algorithm; the accuracy rates in the three case studies of the CatBoost algorithm are 94.74%, 100.00%, and 98.21%, respectively, which fully proves that the CatBoost algorithm has a very good fault diagnosis effect on the HVDC system.
With the development of the human society, the issues of environmental pollution and resource shortage are becoming more and more serious (Mohamed et al., 2020; Tanmay et al., 2020). Energy conservation and emission reduction, and recycling of resources have widely attracted the attention of all countries in the world (Yang et al., 2017; Mehdi and Mehdi, 2020). The emergence of electric energy has greatly changed the way of energy consumption; using electric energy to replace bulk coal, fuel oil, and other energy sources can effectively alleviate the energy crisis and reduce environmental pollution (Yang et al., 2019). In particular, the development and utilization of renewable energy sources, such as wind and solar energy, have greatly improved the energy structure and promoted the development of contemporary new power systems (Yang et al., 2018; Li R. S et al., 2020; Wang et al., 2021; Wang et al., 2022). In recent years, in the process of social and economic development, many advanced technologies have been applied to further improve the quality and efficiency of power transmission, thus promoting the growth of social economy. At present, there are three main transmission methods in the power system: high-voltage direct current (HVDC), high-voltage alternating current (HVAC), and low-frequency alternating current (LFAC) transmissions (Reed et al., 2013; Zhang et al., 2013; Yao et al., 2015; Meng et al., 2021). Among them, the application of HVDC technology has not only effectively improved the quality of power resource transmission to meet the requirements of people’s daily life but also further optimized the operation performance of the power grid system (Li, 2010; Ma et al., 2022). In order to accelerate the transformation of the development mode of electric power and enhance the ability of the grid to optimize the allocation of resources on a large scale, the State Grid Corporation has proposed the strategic goal of building a strong smart grid with an ultra-high vacuum grid as the backbone.
HVDC has a large transmission capacity, fast and flexible power regulation, and is widely used in long-distance high-capacity transmission projects. However, with the increase in voltage levels, the problem of commutation failure in the transmission system is becoming increasingly prominent (Zeng et al., 2016; Li G et al., 2020). As shown in Figure 1, the HVDC system is composed of three parts, namely, the rectifier station, inverter station, and direct current (DC) line, which can convert three-phase AC power into DC power through rectification of the converter station and then send it to another converter station through the DC transmission line to reverse into three-phase AC power. Structurally, it is a power electronic rectifier circuit in the form of alternating current (AC)–DC–AC. In HVDC systems, AC-side faults, lightning faults, short-circuit faults, and inverter phase change failures bring great challenges to the normal operation of the transmission system.

FIGURE 1. Block diagram of the HVDC system.
The converter station is often compared to the heart of the DC system. As the most important component in the DC transmission system, its controllability and the characteristics of single conduction also constitute as important features of the fault behavior of the DC transmission system. These characteristics are mainly expressed in the triggering, conduction, and shutdown of the converter valve (Zheng and Peng, 2019; Li G et al., 2020). The converter failure can be divided into main circuit failure and control system failure. The converter main circuit failure is divided into the short circuit of the converter valve, DC-side outlet short circuit, DC-side ground short circuit, AC-side phase short circuit, and AC-side ground short circuit (Chen et al., 2022). The control system fault refers to whether the converter valve is opening or not opening (Zhou et al., 2022). Furthermore, commutation failure is the most common system fault in HVDC systems, which can lead to DC voltage drop and DC increase for a short period of time, and may lead to system shutdown in serious cases. Commutation failure is very similar to the transient process of DC and DC voltage during the DC line short circuit, and if the type of fault cannot be accurately distinguished, it will cause the protection device to operate incorrectly. Therefore, after a fault occurs on a high-voltage DC transmission line, it is critical to make a quick and accurate diagnosis of the fault, isolate the faulty element after the accident, and adopt an appropriate control and protection strategy (Torres-Olguin and Garces, 2017; Zhang et al., 2021).
At present, the main methods used for phase change failure fault diagnosis include the minimum voltage drop method and the phase comparison method. An improved morphological filter used to decompose the DC signal in different faults is proposed in the literature (Vidlak et al., 2021), which can extract accurately the morphological spectrum under each scale and calculate the energy entropy and singular entropy of the decomposed morphological spectrum. Meanwhile, wavelet scale energy statistics and wavelet scale energy entropy can be utilized to correctly identify the commutation failure of the HVDC system (Xiong et al., 2019). In the issue of current sharing/voltage regulation, Wang et al. (2022) proposed an adaptive dynamic programming approach based on the Bellman principle, which facilitates the analysis and treatment of AC and DC faults in the system. Furthermore, in order to overcome the small-signal instability problem in the power system, Wang et al. (2021) proposed a droop coefficient stability region analysis approach based on the generalized incidence matrix, which can help in information extraction from the fault diagnosis model in the system. Faced with the massive transmission system equipment alarm information, the maintenance personnel cannot expressly and accurately locate the cause of the fault that generates the alarm, which leads to the inefficiency of fault handling and, in turn, cannot meet the growing demand for intelligent management of the power grid. In the past, the main power system fault reasoning and diagnosis included expert systems (Xiao et al., 2021), configurable rules (Trondoli et al., 2022), fuzzy reasoning (Lokanadham and Subbaiah, 2021), and neural network (Giljum et al., 2021). The research ideas of fault diagnosis are mainly used to sort, train, classify, and identify the historical fault data, and the most important idea is to train the diagnosis model according to the data set so that it can use the data features as much as possible for classification. Górski (2022) proposed a smart contract testing pattern for the symmetric array, which can significantly limit the needed number of test cases and save the calculation cost. However, in the actual power system, most of the fault data are asymmetric, so the follow-up research work is mainly based on the fault data on the asymmetric array. Wang et al. (2023) proposed a robust diagnosis method of photovoltaic (PV) array faults considering label errors in training data, which can effectively improve the efficiency of fault diagnosis. Both of these methods can effectively train the original data set, which is highly important for regression testing. The difference is that the training data set used by Górski (2022) is symmetric, and research focused on reducing the calculation cost, while the data set used by Wang et al. (2023) simulated the actual PV array data and focused on improving the accuracy of fault diagnosis.
In this context, the development and utilization of the HVDC system knowledge graph (KG) (Li et al., 2021) enable data collection, data processing, problem analysis, application services, and data analysis functions for the entire HVDC system. With the rapid development of artificial intelligence, KG has become one of the core driving technologies to drive the development of cognitive intelligence, while the widespread application of deep learning techniques and distributed word vector representation of natural language words provide a new basis for the in-depth application of different artificial intelligence methods in natural language processing.
Almost all traditional intelligent fault identification methods use shallow learning models, which are difficult to represent the complex relationships that exist between transmission system faults and the signals to be detected, making it difficult to deal with complex pattern recognition problems. Therefore, there is an urgent need to develop new methods that can automatically extract features. In this work, a fault diagnosis of the HVDC system based on the categorical boosting (CatBoost) algorithm is proposed, which can effectively extract fault data features for accurate identification of various types of HVDC faults based on fault data knowledge mapping. Compared with the existing studies, the fault diagnosis model proposed in this paper combines the mechanism of the knowledge map, and the results can be visually designed. At the same time, the transmission network and data set are from the actual framework and fault data on the Southern Power Grid, which have certain authenticity and reliability. Moreover, this study uses the backpropagation (BP) neural network as a comparison method to diagnose HVDC system faults. The test results show that the proposed method shows good performance and high accuracy in fault diagnosis of the HVDC system. The main contributions and innovations of this work are listed as follows:
(1) According to the application of the knowledge atlas in the power system, based on the transmission system of a power grid in southwest China, a fault diagnosis model of the HVDC system based on the CatBoost algorithm is proposed, and the accuracy of fault diagnosis can be up to 94%.
(2) The fault types mainly include the AC fault, DC fault, converter valve fault, and commutation failure. The causes of these four types of faults are specifically analyzed in this paper. The fault data mainly come from the measured data on a power grid in southwest China, which has certain authenticity and reliability.
(3) In order to verify the progressiveness and effectiveness of the proposed method, BP is used as the comparison algorithm in the case of the same data set. The experimental results show that the CatBoost algorithm fault diagnosis accuracy is higher than BP in the three data sets.
(4) To improve the readability of this paper and the reference value of power system fault diagnosis, three constructive prospects for future research studies are presented.
The rest of this work is structured as follows: the HVDC system KG is established in Section 2. Section 3 introduces the four common faults of HVDC, namely, the AC fault, DC fault, converter valve fault, and commutation failure. The principle, framework, and execution process of CatBoost are provided in Section 4 and Section 5. In Section 6, case studies and statistical analysis are carried out. The main discussion and limitations to this study are discussed in Section 7. Finally, conclusions and future developments are given in Section 8.
Knowledge mapping relational reasoning is an effective means to solve knowledge verification, prediction, and inference. By combining KG with text, entities and relations can be mapped to a specific vector space to establish logical relationships between entities and relations, thus realizing knowledge reasoning and meeting the needs of intelligent diagnosis and decision-making for complex relational scenarios in grid fault diagnosis. The construction of the HVDC system KG mainly includes six steps, as shown in Figure 2. It mainly includes knowledge acquisition, knowledge analysis, knowledge base establishment, graph construction, knowledge service, and knowledge application. It mainly includes three parts, namely, the knowledge system construction layer, knowledge service layer, and knowledge application layer (Wu et al., 2022). In the face of massive data, including images, text, and electrical signals, it is necessary to establish a knowledge map of fault diagnosis of the HVDC transmission system. Through the sorting and classification of historical fault data sets, the type and time of fault occurrence can effectively be predicted, thus reducing the losses caused by faults in the power system.
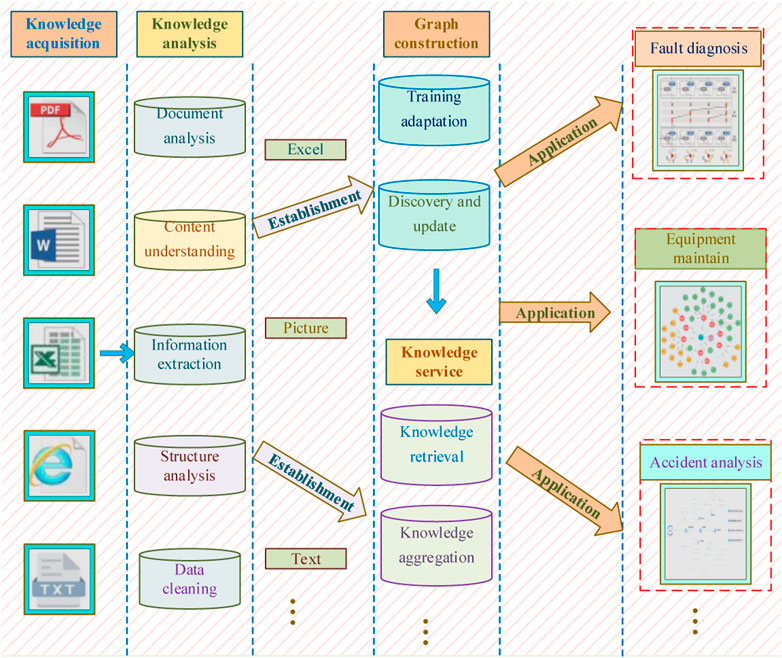
FIGURE 2. HVDC system KG construction diagram.
In the HVDC system, the knowledge sources are extremely complex. Some data included are the operation and maintenance data on the HVDC system, as well as some engineering data or technical breakthrough data. Due to the diversity of knowledge source paths, it is necessary to classify various knowledge sources in the process of building the graph. In addition, there are various ways to carry data. In the HVDC system, some data are in the text format (Chen et al., 2020), such as various technical research materials, while some data are in the excel format, such as the temperature and humidity of some equipment, and some data are in some picture types, such as the fault waveform obtained using the fault recorder. Due to the diverse ways of carrying data, it is necessary to establish a corresponding knowledge base for storage; this can improve the efficiency of the whole KG.
The inference of the KG mainly refers to relational inference, the core of which is to infer unknown entities or relations based on existing entities or relations and can help achieve the complementation of the KG and the prediction of entities and relations. The core idea of the KG relational inference is to find a mapping function that graphs symbolic representations to vector spaces for numerical representations, extracts implicit associations between entities and relations, and uses associative knowledge for inference. TransE is inspired by the translation invariance in word vectors and represents both entities and relations as vectors, and for a specific relation. The TransE model performs well for simple entity relationships but does not perform well for mappings of multiple relationships (Zeng et al., 2022).
The training process of the KG relies on a collection of triples derived from existing data, each of which is a training sample of the KG containing the relationships between the head and tail entities, to build a semantic network of the KG for high-voltage DC transmission systems using a translation-based model.
In order to realize the fault diagnosis of the HVDC system with limited fault feature data available, this paper proposes a method based on knowledge mapping CatBoost decision tree technology to construct fault diagnosis of the HVDC system, using theoretical analysis and experimental research to realize the safety state assessment and fault analysis and prediction of the HVDC system. By sending requests to the knowledge base of the HVDC system, fault record data are obtained; then, data are extracted from the key record segments, and the processed fault data are inputed into the risk analysis model of the HVDC system for fault classification. Figure 3 shows the fault handling and risk analysis framework of the KG-based HVDC system. Finally, the effectiveness and accuracy of the proposed method are verified by the real historical data set of an actual operation of a substation in the Southern Power Grid.
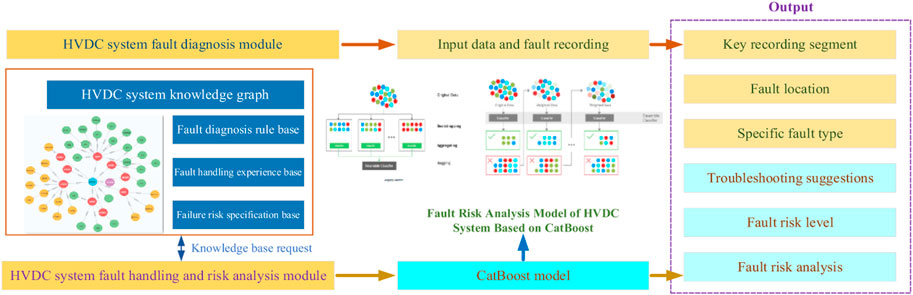
FIGURE 3. Flow chart of KG-based DC transmission system fault handling and the risk analysis module.
There are many common faults in the HVDC system, such as the AC fault, DC fault, inverter commutation fault (Nanayakkara et al., 2012), converter valve fault (Narendra et al., 1998), single-phase fault (Vidal et al., 2015), interphase fault, and lightning stroke fault (Pauli et al., 1988). According to the statistics of a substation in the Southwest China Power Grid, since the converter station was put into operation in 2010, the average number of annual occurrences of the AC fault, DC fault, converter valve fault, and commutation failure is 11.6, 16.2, 14.2, and 16.8, respectively, which caused a hidden danger to the safe and stable operation of the system. Therefore, this paper mainly studies these four types of faults, and the fault diagnosis model based on the CatBoost algorithm is constructed by taking the measured data on a substation in the Southwest China Power Grid as the original data set.
The power regulation of DC transmission is fast and flexible. It does not have the stability problem of synchronous operation. Therefore, it is considered an ideal ultra-high voltage and long-distance transmission mode (Li et al., 2007; Zheng et al., 2020). However, the failure rate of the DC system is relatively high, and AC and DC parallel operations also have the problem of interaction between AC and DC. In particular, the main grid of the power transmission from the west to the east of the China Southern Power Grid presents the characteristics of strong DC and weak AC: the proportion of DC transmission is large, while the AC system running in parallel with it is relatively weak. When DC system fails, the power angle may be stable due to a large range of power transfer voltage stability failure, which, to a certain extent, affects the safety and stability of the system and the performance of the transmission channel capacity (Guo et al., 2018). Similarly, for the multi-infeed DC system, if the AC fault cannot be removed in time, it may also lead to the simultaneous locking of multiple DC lines, resulting in system stability failure. The schematic diagram of the AC fault in the HVDC system is shown in Figure 4A.
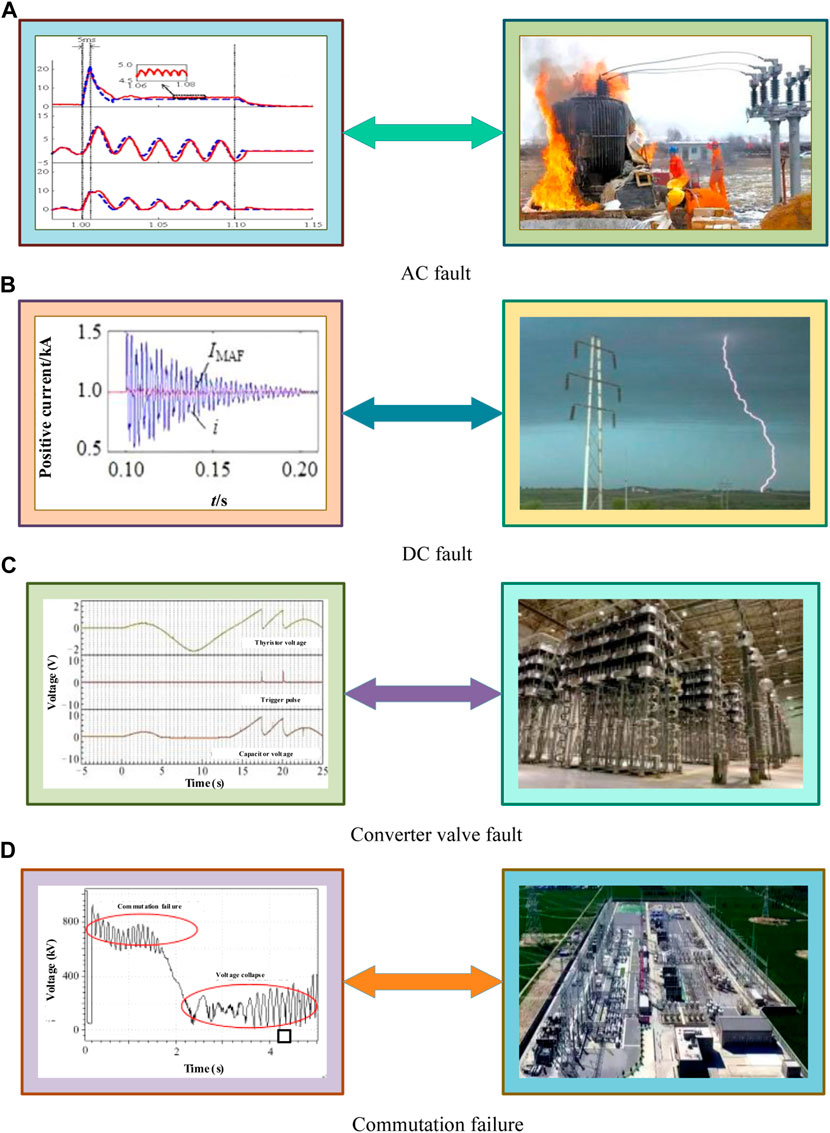
FIGURE 4. Four fault diagrams of the HVDC system. (A) AC fault. (B) DC fault. (C) Converter valve fault. (D) Commutation failure.
The HVDC transmission system is often considered in long-distance transmission projects, but long lines also bring many safety problems, and the probability of failure caused by long distance is high. The probability of short circuit to ground is the largest in the DC transmission system, accounting for more than 80% of the DC transmission system line faults, most of which is flashover discharge. Generally, the ground flashover of the DC transmission system is mainly caused by damage to the insulation between the transmission line and the ground. The common causes are the breakdown of the air caused by lightning, the reduction of the insulation level caused by pollution, and the ground flashover caused by the shortening of the insulation distance caused by tree branches. The schematic diagram of the DC fault in the HVDC system is shown in Figure 4B. The DC line fault includes the grounding fault on a single pole, broken wire fault, and short-circuit fault caused by an abnormal connection between two poles. The permanent fault of the DC transmission system is generally believed to exist for a long time. In practical engineering, the fault should be prevented from further expanding and endangering the power supply reliability of the system (Guo et al., 2018).
During the commutation of the inverter-side converter valve, the single valve of the converter valve appears to be turned off when the positive voltage is too high or has a certain positive voltage when the thyristor is not fully turned off, and the gate is applied with a trigger pulse; the thyristor will be turned on again, causing the converter valve that is turned on to fail to conduct, and the commutation of the converter valve fails (Liu et al., 2015). The turn-off time of the thyristor is usually slightly less than 1 ms. When the converter valve is in inverse operation, the forward voltage will appear after the thyristor bears approximately 1 ms of reverse voltage after the turn-off. When the AC system voltage disturbance or other factors make the thyristor in commutation again, commutation failure may occur. The schematic diagram of the converter valve fault in the HVDC system is shown in Figure 4C. When the converter valve operates at the rectifier side of the DC transmission project, the thyristor bears a continuous reverse voltage greater than 5 ms after it is turned off, and the thyristor can be turned off reliably. Therefore, the converter valve will not have a commutation failure fault when it operates at the rectifier side.
In the converter, the valve that is out of conduction fails to recover its blocking capacity within a period of time under the action of reverse voltage, or the commutation process is not completed during the reverse voltage, resulting in the valve voltage becoming positive; the commutation valve will reverse the phase of the valve that was originally scheduled to be out of conduction, which is called commutation failure. The schematic diagram of commutation failure in the HVDC system is shown in Figure 4D. The commutation failure is due to a short circuit on the DC side and the open circuit on the AC side of the converter valve that should be turned off but is not turned off, resulting in power fluctuations. In essence, commutation failure is caused by the characteristic that the thyristor is a semi-controlled device, which cannot be completely ignored under the existing technical conditions (Wei et al., 2006).
The commutation failure is essentially caused by external or internal factors that lead to the inverter turn-off angle to be γ. If the voltage is too small, the thyristor will be completely turned off when the online voltage changes from negative to positive, and there will be phase reversal.
The calculation formula of the turn-off angle
where
The handling of category features is a key feature of the CatBoost algorithm, hence its name. The CatBoost algorithm improves the regular target variable statistics method by adding priors to it. In addition, the CatBoost algorithm considers using different combinations of category features to expand the data set feature dimension.
In a set of samples
The gradient enhancement procedure iteratively builds an approximate sequence
The minimization problem is usually treated by Newton’s method using the quadratic approximation of
The CatBoost algorithm is a gradient-enhanced implementation that uses a binary decision tree as a basic predictor. The decision tree is based on the values of some split attribute a. The model is built by recursively dividing the feature space
where
Using target statistics as a new numerical feature seems to be the most efficient way to deal with class features with minimal information loss. Target statistics is widely used and plays a crucial role in classifying features.
One of the biggest purposes of the CatBoost algorithm design is to better handle the category features of GBDT features. The most direct approach of the conventional TS method is to replace the average value of the label corresponding to the category. In the process of GBDT constructing the decision tree, the average value of the replaced category labels is used as the standard for node splitting, which is also known as greedy target-based statistics (Greedy TS), and the calculation formula can be expressed as follows:
The aforementioned method has an obvious defect. If the average value of the label is used to represent the feature, the condition deviation problem will occur when the data structure and distribution of the training data set and the test data set are different.
One way to improve greedy target-based statistics is to add a prior distribution so as to reduce the impact of noise and low-frequency category data on data distribution. The formula is as follows:
where p is the added prior term and a is usually a weight coefficient greater than 0.
Another innovation in CatBoost’s treatment of category features is that any combination of any number of category features can be built into a new feature. The CatBoost algorithm considers combining these two classification features to form a new classification feature.
Therefore, the CatBoost algorithm uses a greedy strategy to consider the combination of features when building new split nodes. The CatBoost algorithm combines all combination and category-type features of the current tree with all category-type features in the data set and dynamically converts new category-combined features into numerical features.
The so-called prediction shift is the deviation between the distribution of training samples and the distribution of test samples.
CatBoost first reveals the problem of prediction deviation in the gradient lift. It is considered that the predicted deviation, like the TS treatment method, is caused by a special characteristic of target leakage and gradient deviation.
As in the case of TS, the prediction shift is caused by a particular kind of target leak. An ordered enhancement similar to the ordered TS approach is used to solve this problem. The following formula is used:
CatBoost adopted an ordered boosting method based on ordered TS to deal with predicted migration. The sorting promotion algorithm flow is shown in the following figure.
For the training data, ordered boosting first becomes a random arrangement and the random collocation column is used for the subsequent model training. However, the practice of training individual models will greatly increase memory consumption and time complexity; the operability is not strong. Therefore, CatBoost improves this sort of lifting algorithm based on the gradient lifting algorithm based on decision tree learning.
CatBoost offers two boosting modes, ordered and plain. The plain mode simply has to sort the TS operation built into the standard GBDT algorithm, while the ordered mode improved the sorting promotion algorithm.
The complete ordered mode is described as follows: CatBoost generates an independent random sequence of the training set to define and evaluate the splitting of the tree structure and to calculate the value of the leaf node, resulting from the splitting. CatBoost uses a symmetric tree as a base learner, meaning that the splitting criteria are the same at the same level of the tree. A symmetric tree is balanced, not easy to over-fit, and can greatly reduce the test time.
The pseudocode of the CatBoost algorithm is shown in Table 1. It is not difficult to see that when the original data set is input, CatBoost can output the trained data set after training. CatBoost has two enhancement modes, ordered and normal. The latter mode is a standard GBDT algorithm with built-in ordered TS, and the former mode is an effective improvement of Table 1.
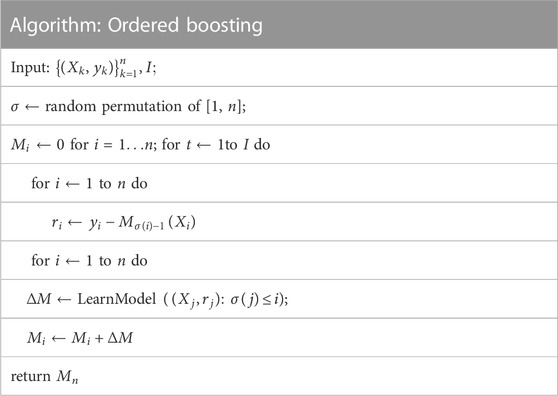
TABLE 1. Ordered boosting calculation.
CatBoost generates a random arrangement of
In this section, according to the four types of fault data measured in the substations of the Southwest Power Grid, the electrical diagram of the transmission system and the corresponding fault types of the fault points are shown in Figure 5. There are 20 fault points in the electrical wiring diagram, and the type represented by each fault point is clearly explained in the right figure. In the original data set, the recorded data on 15 cycles before and after the fault is extracted; the extraction duration of the recorded data is 0.5 s, as shown in Figure 6. Also, the specific meaning of each channel can be referred to from Table 2. It is easy to observe that the 15 channel data mainly record the current and voltage signals of the fault points, and the 15 channel waveforms of the four types of faults are intuitively different, so the characteristics of the data can be used for fault classification and identification. Furthermore, the elements in the data samples of the AC fault, DC fault, converter valve fault, and commutation failure are N1 = 10, N2 = 14, N3 = 14, and N4 = 18, respectively.
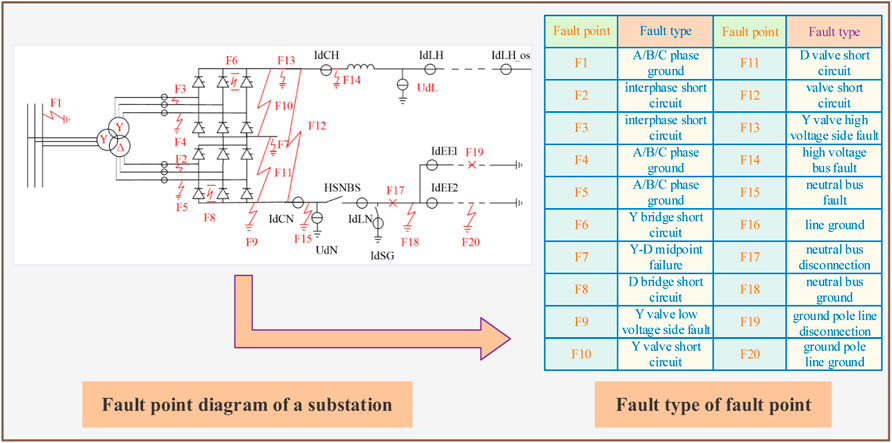
FIGURE 5. Fault type diagram corresponding to fault points of the HVDC system.
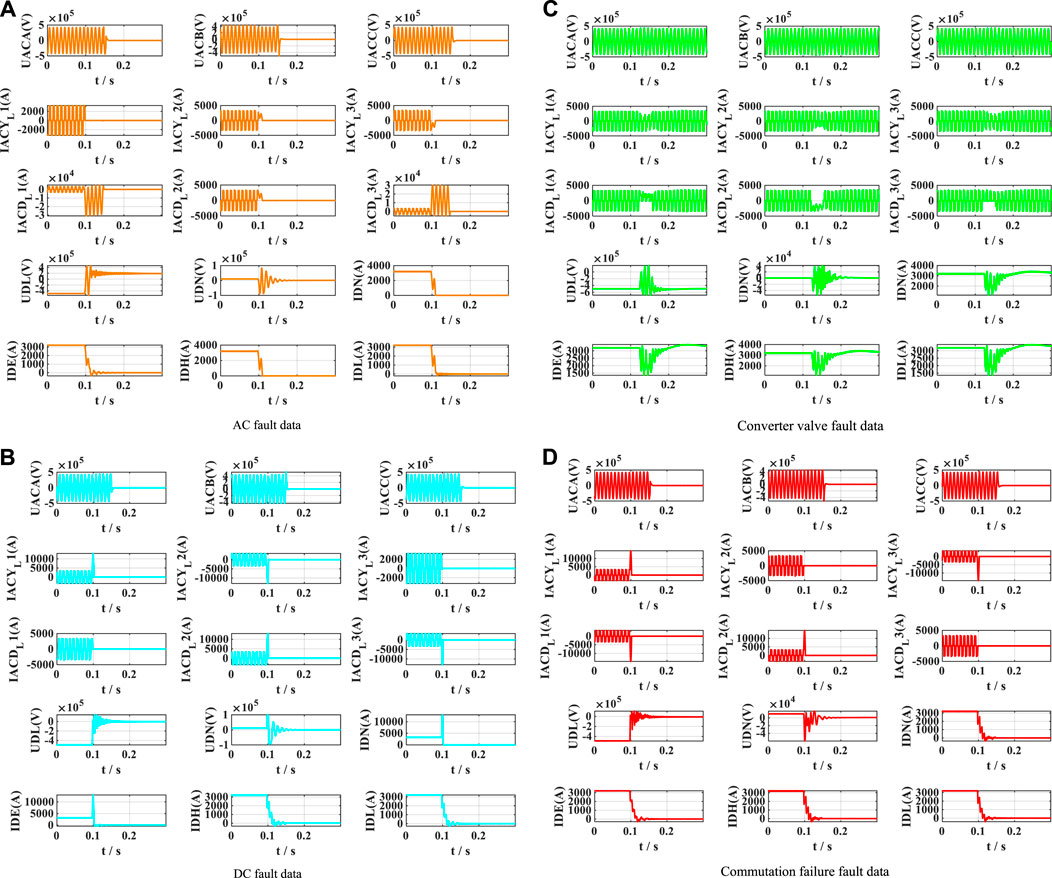
FIGURE 6. Waveforms of the HVDC system four types of faults. (A) AC fault data. (B) DC fault data. (C) Converter valve fault data. (D) Commutation failure fault data.
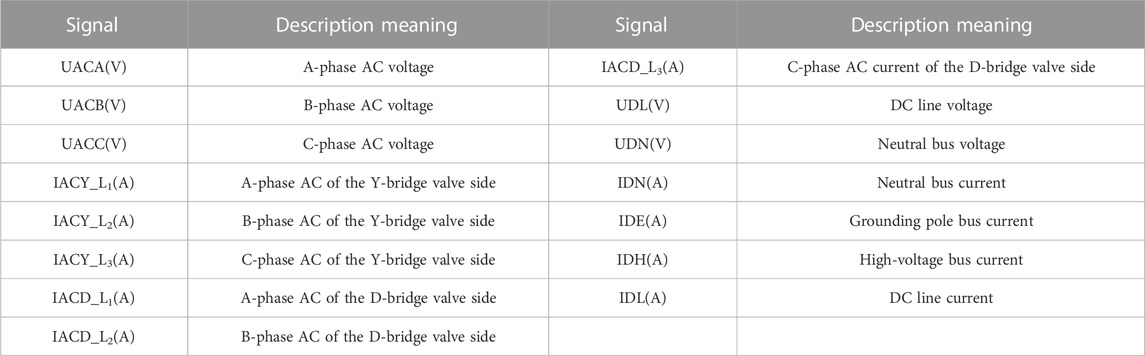
TABLE 2. Channel name and meaning.
After determining the original data, the CatBoost algorithm is used to process and train the four types of fault data, and finally, the fault is diagnosed and the accuracy is calculated. The specific steps are as follows:
First, 15 channel data on each sample in each type of fault data are connected in series to conduct data preprocessing and then stacked according to the number of samples to form a full fault data set. Then, 70% of the total fault data set is randomly selected as training data and 30% as test data. Second, integrated learning is used to extract the features of fault data, and 70% of the data is intensively trained. After determining the number of data classifiers and training data, finally, the remaining 30% of data will be used as test samples for fault diagnosis and classification. The CatBoost classifier is used to train and recognize the training data set, and the accuracy of various fault diagnosis results is counted. The flow chart of the CatBoost-based fault diagnosis model is shown in Figure 7.

FIGURE 7. CatBoost algorithm fault diagnosis flow chart.
First, the training samples from the fault data are input into the model, and then, the test samples are input. In this paper, in order to reflect the scientific nature of fault diagnosis, the test data are divided into three groups to verify the model. The first group of test data is Y1 (n1 = 3, n2 = 5, n3 = 5, and n4 = 6), and the second group of test data is the training data itself Y2 (n1 = 7, n2 = 9, n3 = 9, and n4 = 12). After training the model, the training data itself are substituted into the model for verification. The third group of test data is all the fault data Y3 (n1 = 10, n2 = 14, n3 = 14, and n4 = 18). In this paper, in order to reflect the effectiveness, diagnostic accuracy, and effectiveness of the CatBoost algorithm in small sample fault diagnosis, the BP neural network algorithm is used for comparison, and the fault diagnosis accuracy of the two methods is compared under the same training set and test set. Finally, in order to intuitively reflect the fault diagnosis accuracy of the two methods for the test set, this paper uses the confusion matrix to visually express the fault diagnosis accuracy.
After the two methods have trained their respective fault diagnosis models, the confusion matrix of fault diagnosis results of the Y1 test set is shown in Figure 8. It is easy to see that when the test set is Y1, in the diagnosis result of the CatBoost algorithm, a date group of commutation failure faults are misdiagnosed as converter valve faults, and the fault diagnosis rate of the CatBoost algorithm is as high as 94.74%. However, in BP’s diagnosis results, four groups of DC faults are misdiagnosed as AC faults and commutation failures, respectively. At the same time, two groups of commutation failures are also misdiagnosed as DC faults. BP’s overall fault diagnosis accuracy cannot reach a satisfactory level, only reaching 68.42%. The CatBoost algorithm has the highest classification accuracy of the two methods, although it has diagnostic errors when diagnosing converter valve faults.
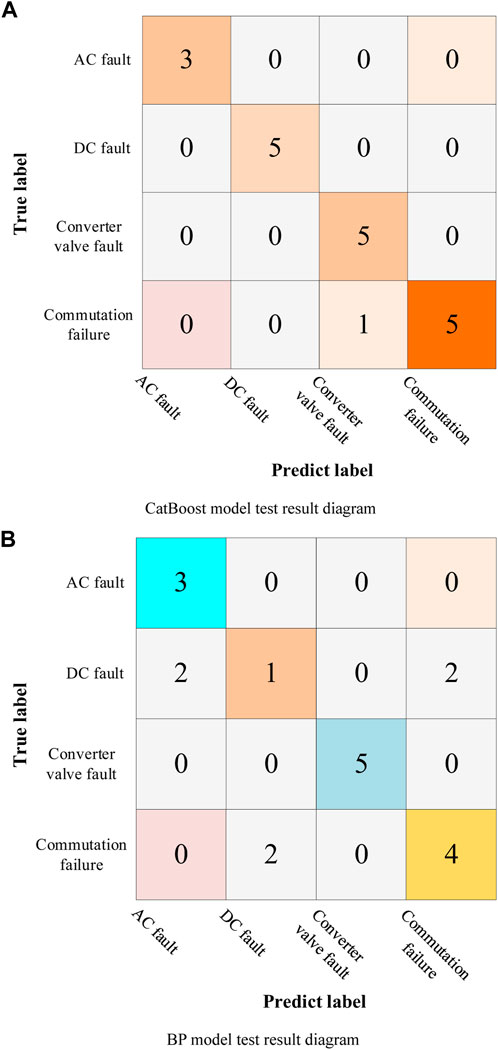
FIGURE 8. Confusion matrix of experimental results for the test set Y1. (A) CatBoost model test result diagram. (B) BP model test result diagram.
The confusion matrix of fault diagnosis results for the Y2 test set is shown in Figure 9. It is easy to see that under the condition that the test set is Y1, the four types of faults can be accurately identified through the CatBoost algorithm and the accuracy rate of fault diagnosis of the CatBoost algorithm is as high as 100%, which proves that the CatBoost algorithm can effectively extract fault data and accurately identify according to the characteristics. However, it is not difficult to find from the BP diagnosis results that one of the commutation failure faults was misdiagnosed as a valve fault, and its accuracy reached 97.3%.
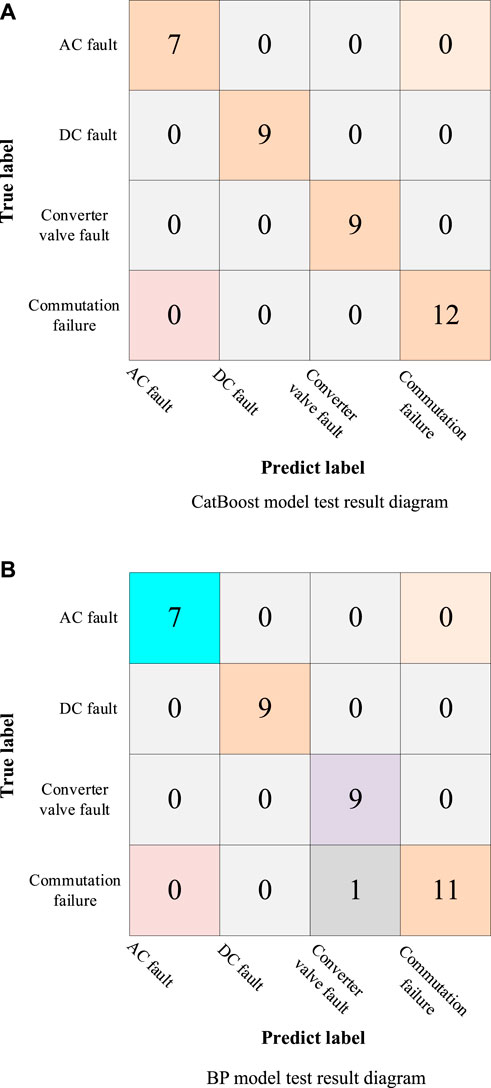
FIGURE 9. Confusion matrix of experimental results for the test set Y2. (A) CatBoost model test result diagram. (B) BP model test result diagram.
The results of the two algorithms under the Y3 test set are shown in Figure 10. It is obvious that CatBoost has the highest diagnostic accuracy, although a group of inverter commutation failure is misdiagnosed as converter valve fault in the CatBoost fault diagnosis model. However, in the fault diagnosis model of the BP neural network algorithm, four groups of DC faults are misdiagnosed as AC faults and commutation failures, respectively, and four groups of commutation failure data are misdiagnosed as a DC fault. According to the confusion matrix, the accuracy of fault diagnosis of CatBoost and BP neural network algorithms can be calculated to be 98.21% and 85.71%, respectively. Furthermore, the fault diagnosis iteration curve of the two algorithms for Y3 is shown in Figure 11. It can be seen that the CatBoost algorithm converges after 30 iterations, while algorithm B converges after 41 iterations, which indicates that CatBoost has a faster diagnosis speed.
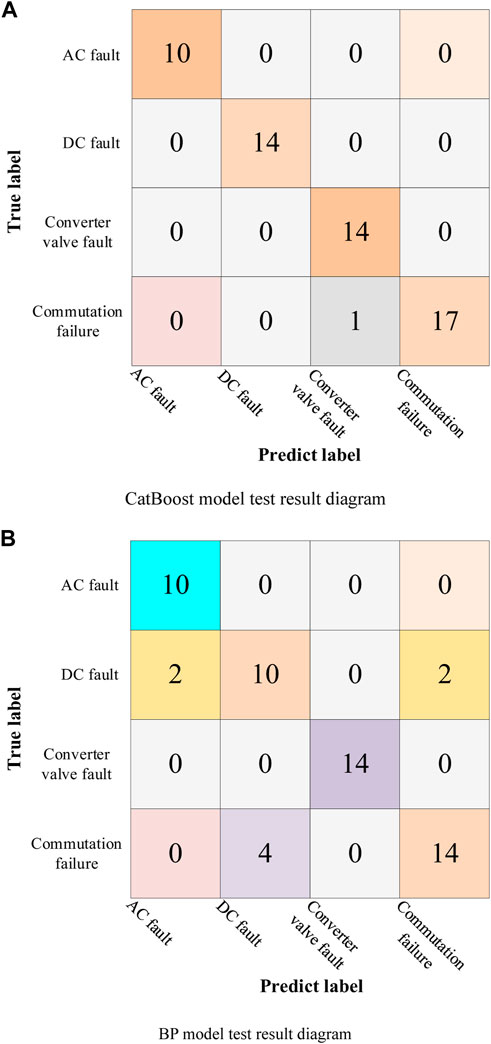
FIGURE 10. Confusion matrix of experimental results for the test set Y3. (A) CatBoost model test result diagram. (B) BP model test result diagram.
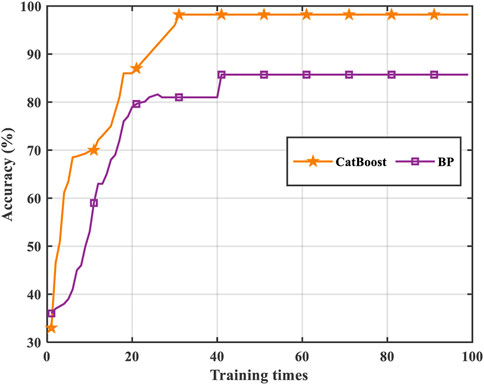
FIGURE 11. Accuracy curve of experimental results for the test set Y3.
Finally, according to the confusion matrix, the accuracy rates of three groups of fault diagnosis experiments are obtained, as shown in Table 3. In test sets Y1, Y2, and Y3, the number of negative data on the CatBoost fault diagnosis model is 1, 0, and 1, respectively, and the BP neural network fault diagnosis model is 6, 1, and 8, respectively. Also, in the CatBoost fault diagnosis model, the DC fault and AC fault can be accurately identified, and misdiagnosis mainly occurs in commutation failure and the converter valve fault. In addition, it is obvious that the CatBoost algorithm has the highest accuracy rate of fault diagnosis in the three groups of data, which can be guaranteed between 94% and 100%, which reflects that CatBoost is applicable to data classification in small sample data sets. However, the accuracy rate of the BP neural network can reach 64% at the lowest. To sum up the aforementioned analysis, it can be seen that algorithm B is superior to algorithm A in terms of convergence speed and fault diagnosis accuracy, which verifies the effectiveness and progressiveness of the method proposed in this paper.
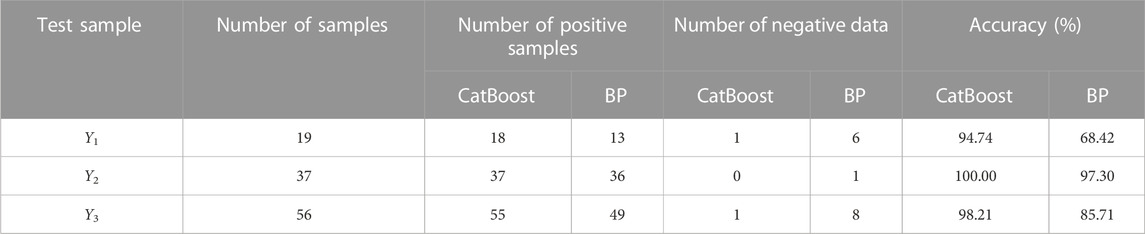
TABLE 3. Experimental accuracy of three test sets.
Fault diagnosis of the HVDC transmission system is important research to ensure the reliable power supply of the whole power system. In the past, the fault diagnosis and inspection of the power system mainly depended on image recognition or acoustic theory, but this kind of method has a huge workload and cannot get timely feedback and maintenance when the system fails. In recent years, with the development of artificial intelligence technology, such as machine learning, reinforcement learning, and KG, these technologies have been applied in fault diagnosis technology of the power system to further improve the speed and accuracy of fault diagnosis. The CatBoost fault diagnosis method proposed in this paper belongs to this kind of technology. On the basis of obtaining historical fault data, the data features are extracted and recognized, and the accuracy is better. The BP neural network algorithm is relatively common in many studies, but it does not show good results in this data set.
The fault diagnosis model of the HVDC transmission system proposed in this paper only contains four types of faults in the data set, so the data set does not cover all faults in the HVDC transmission system to a certain extent, such as the transformer fault and generator fault. In addition, the current work is mainly carried out under small samples, and the number of data sets is not large. Therefore, the data sets need to be improved and enriched. Since fault diagnosis is based on historical fault data to predict the system, the method proposed in this paper has certain limitations for fault prediction in some special cases.
In this paper, a novel fault diagnosis method for the HVDC system is proposed, and the significance of fault diagnosis for the later fault analysis and processing of the HVDC system is described by combining with the KG of the HVDC system. In this paper, the CatBoost algorithm is fully proven to be very effective, accurate, and fast in fault diagnosis of the HVDC system through relevant data validation and analysis. Four common faults of the HVDC system are introduced and analyzed in this work: the AC fault, DC fault, converter valve fault, and commutation failure, and the fault data are sorted out. The representative 15 channel data in the fault recording system are selected, and then, the data are summarized and sorted as the experimental data on this study. Furthermore, a fault diagnosis model of the HVDC system based on the CatBoost algorithm is proposed. Three test sets are used in the experiment to verify the model. The final structure proves that the method can effectively, quickly, and accurately realize the fault diagnosis of the HVDC system. Then, the fault diagnosis effect is compared with the BP neural network algorithm. Finally, the obtained results are visualized and the algorithm convergence curve and confusion matrix are drawn. From the figure, it can be seen that the CatBoost algorithm has a short diagnosis time and high fault diagnosis accuracy. Under the three test sets, its diagnosis accuracy is 94.74%, 100%, and 98.21%, respectively. However, the diagnostic accuracy of the BP neural network algorithm under three test sets is low, which is 68.42%, 97.30%, and 85.71%, respectively.
In the application of new generation AI in the power system, the method proposed in this paper has a certain reference value for the stable operation of the power system. Future studies might focus on the following three aspects:
(1) At present, the proposed fault diagnosis model is mainly applied to the HVDC transmission system. In the future research work, the effectiveness and progressiveness of the proposed method will be tested using the AC/DC hybrid system;
(2) The data set will be further enriched and improved, and more types of HVDC transmission fault data will be considered in the data set, such as the transformer fault, lightning fault, and noise impact on the system;
(3) The proposed algorithm will be further improved and integrated into more effective mechanisms in the KG. At the same time, more algorithms will be tested to analyze the speed and accuracy of system fault diagnosis under a large data set.
The original contributions presented in the study are included in the article/Supplementary Material, further inquiries can be directed to the corresponding author.
JWu: writing the original draft and editing. QL, QC, and NZ: conceptualization. CM, LY, and JWa: visualization and contributed to the discussion of the topic.
This work was supported by the Technology Project of China Southern Power Grid (CGYKJXM20210309 and CGYKJXM20220343). The funder was not involved in the study design, collection, analysis, interpretation of data, the writing of this article, or the decision to submit it for publication.
Authors JWu, QL, and QC were employed by the company China Southern Power Grid Co., Ltd. Authors NZ and CM were employed by the company China Southern Power Grid Co., Ltd. Authors LY and JWa were employed by the company China Southern Power Grid Co., Ltd.
All claims expressed in this article are solely those of the authors and do not necessarily represent those of their affiliated organizations, or those of the publisher, the editors, and the reviewers. Any product that may be evaluated in this article, or claim that may be made by its manufacturer, is not guaranteed or endorsed by the publisher.
Chen, C. P., Chen, S. L., Bi, G. H., Gao, J. Y., Zhao, X., and Li, L. (2022). Fault diagnosis of weak receiving DC transmission system based on parallel CNN-LSTM. Mot. Control Appl. 49 (6), 83–91. doi:10.12177/emca.2022.022
Chen, X., Jia, S., and Xiang, Y. (2020). A review: Knowledge reasoning over knowledge graph. Expert Syst. Appl. 141, 112948. doi:10.1016/j.eswa.2019.112948
Giljum, A., Liu, W., Li, L., Weber, R., and Kelly, K. F. (2021). General neural network approach to compressive feature extraction. Appl. Opt. 60 (25), 217–223. doi:10.1364/AO.427383
Górski, T. (2022). The k + 1 symmetric test pattern for smart contracts. Symmetry 14 (8), 1686. doi:10.3390/sym14081686
Guo, X. S., Li, T., Li, G. W., Wei, Z., Yuan, B., and Chen, D. (2018). Converter valve fault ride through strategy and protection setting optimization in Zhang-Bei flexible DC power grid. Automation Electr. Power Syst. 42 (24), 196–202. doi:10.7500/AEPS20180506004
Li, G., An, T., Liang, J., Liu, W., Joseph, T., Lu, J., et al. (2020). Studies of commutation failures in hybrid LCC/MMC HVDC systems. Glob. Energy Interconnect. 3 (3), 193–204. doi:10.1016/j.gloei.2020.07.001
Li, J. X., Li, X., Gao, T. L., Zhang, J., and Zhang, B. Y. (2021). Research and application of fault handling based on power grid multivariate information knowledge graph. Power Inf. Commun. Technol. 19 (11), 30–38. doi:10.16543/j.2095-641x.electric.power.ict.2021.11.005
Li, J. X., Qian, J., Li, J., and Shan, J. S. (2007). Influence of AC side fault of converter station on HVDC system. Yunnan Electr. Power 35 (3), 10–12. doi:10.3969/j.issn.1006-7345.2007.03.005
Li, R. S., Wong, P., Wang, K., Li, B., and Yuan, F. F. (2020). Power quality enhancement and engineering application with high permeability distributed photovoltaic access to low-voltage distribution networks in Australia. Prot. Control Mod. Power Syst. 5 (3), 18–189. doi:10.1186/s41601-020-00163-x
Li, Z. Q. (2010). Research on a new method of HVDC system fault diagnosis based on auto disturbance rejection controller. Telecom Power Technol. 27 (6), 39–43. doi:10.19399/j.cnki.tpt.2010.06.014
Liu, X., Dai, D., Rao, H. L., Cheng, C., Ai, L., and Wu, S. (2015). Common faults and treatment methods of converter valve in DC system. Electron. World 21, 115–117. CNKI: SUN: ELEW.0.2015-21-068.
Lokanadham, D., and Subbaiah, K. V. (2021). Estimation of tribological performance of Al-LSP composites using grey fuzzy reasoning approach. IOP Conf. Ser. Mater. Sci. Eng. 1070 (1), 012120. doi:10.1088/1757-899X/1070/1/012120
Ma, J., Yang, Z., Du, W., Shen, Y., and Cheng, P. (2022). An active damping control method for direct-drive wind farm with flexible DC transmission system based on the remodeling of dynamic energy branches. Int. J. Electr. Power & Energy Syst. 141, 108004. doi:10.1016/j.ijepes.2022.108004
Mehdi, T., and Mehdi, N. (2020). Human reliability analysis in maintenance team of power transmission system protection. Prot. Control Mod. Power Syst. 5 (4), 26–282. doi:10.1186/s41601-020-00176-6
Meng, Y., Yan, S., Wu, K., Ning, L., Li, X., Wang, X., et al. (2021). Comparative economic analysis of low frequency AC transmission system for the integration of large offshore wind farms. Renew. Energy 179, 1955–1968. doi:10.1016/j.renene.2021.07.137
Mohamed, N., Ahmed, E., and Tamou, N. (2020). Improving low-voltage ride-through capability of a multimegawatt DFIG based wind turbine under grid faults. Prot. Control Mod. Power Syst. 5 (4), 33–382. doi:10.1186/s41601-020-00172-w
Nanayakkara, O., Rajapakse, A. D., and Wachal, R. (2012). Traveling-wave-based line fault location in star-connected multiterminal HVDC systems. IEEE Trans. power Deliv. 27 (4), 2286–2294. doi:10.1109/TPWRD.2012.2202405
Narendra, K. G., Sood, V. K., Khorasani, K., and Patel, R. (1998). Application of a radial basis function (RBF) neural network for fault diagnosis in a HVDC system. IEEE Trans. power Syst. 13 (1), 177–183. doi:10.1109/59.651633
Pauli, B., Mauthe, G., Ruoss, E., Ecklin, G., Porter, J., and Vithayathil, J. (1988). Development of a high current HVDC circuit breaker with fast fault clearing capability. IEEE Trans. Power Deliv. 3 (4), 2072–2080. doi:10.1109/61.194019
Reed, G. F., Hassan, H. A., and Kory, M. J. (2013). “Comparison of HVAC and HVDC solutions for off-shore wind farms with a procedure for system economic evaluation,” in 2013 IEEE Energytech, Cleveland, USA, 21-23 May 2013, 1–7. doi:10.1109/EnergyTech.2013.6645302
Tanmay, D., Ranjit, R., and Kamal, K. M. (2020). Impact of the penetration of distributed generation on optimal reactive power dispatch. Prot. Control Mod. Power Syst. 5 (4), 31–357. doi:10.1186/s41601-020-00177-5
Torres-Olguin, R. E., and Garces, A. (2017). Grid integration of offshore wind farms using a hybrid HVDC composed by an MMC with an LCC-based transmission system. Energy Procedia 137, 391–400. doi:10.1016/j.egypro.2017.10.363
Trondoli, L., Lopes, G. N., and Vieira, J. (2022). Configurable stochastic model for high impedance faults simulations in electrical distribution systems. Electr. Power Syst. Res. 205, 107686. doi:10.1016/j.epsr.2021.107686
Vidal, A. R., Beltran, H., Rolan, A., Belenguer, E., Pena, R., and Blasco-Gimenez, R. (2015). Analysis of the performance of MMC under fault conditions in HVDC-based off-shore wind farms. IEEE Trans. Power Deliv. 31 (2), 839–847. doi:10.1109/TPWRD.2015.2468171
Vidlak, M., Gorel, L., Makys, P., and Stano, M. (2021). Sensor less speed control of brushed DC motor based at new current ripple component signal processing. Energies 14, 5359. doi:10.3390/en14175359
Wang, M., Xu, X., and Yan, Z. (2023). Online fault diagnosis of PV array considering label errors based on distributionally robust logistic regression. Renew. Energy 203, 68–80. doi:10.1016/j.renene.2022.11.126
Wang, R., Ma, D. Z., Li, M. J., Sun, Q., Zhang, H., and Wang, P. (2022). Accurate current sharing and voltage regulation in hybrid wind/solar systems: An adaptive dynamic programming approach. IEEE Trans. Consumer Electron. 68 (3), 261–272. doi:10.1109/TCE.2022.3181105
Wang, R., Sun, Q. Y., Hu, W., Li, Y., Ma, D., and Wang, P. (2021). SoC-based droop coefficients stability region analysis of the battery for stand-alone supply systems with constant power loads. IEEE Trans. Power Electron. 36 (7), 7866–7879. doi:10.1109/TPEL.2021.3049241
Wei, J. W., Lin, L., Cheng, T., and Mou, D. H. (2006). Commutation failure factors analysis in HVDC transmission system. J. Chongqing Univ. 29 (5), 16–18. doi:10.1016/S0379-4172(06)60085-1
Wu, J., Li, Q., Chen, Q., Peng, G., Wang, J., Fu, Q., et al. (2022). Evaluation, analysis and diagnosis for HVDC transmission system faults via knowledge graph under new energy systems construction: A critical review. Energies 15 (21), 8031. doi:10.3390/en15218031
Xiao, Y., Han, F., Ding, Y., and Liu, W. (2021). Research on fault diagnosis method of rapier loom based on the fusion of expert system and fault tree. J. Intelligent Fuzzy Syst. Appl. Eng. Technol. 41 (2), 3429–3441. doi:10.3233/JIFS-210741
Xiong, Y., Li, J., Fei, F., Liu, Z., and Luo, W. (2019). Influence of coherent vortex structures in subgrid scale motions on particle statistics in homogeneous isotropic turbulence. Int. J. Multiph. Flow 113, 358–370. doi:10.1016/j.ijmultiphaseflow.2018.10.021
Yang, B., Yu, T., Shu, H. C., Dong, J., and Jiang, L. (2018). Robust sliding-mode control of wind energy conversion systems for optimal power extraction via nonlinear perturbation observers. Appl. Energy 210, 711–723. doi:10.1016/j.apenergy.2017.08.027
Yang, B., Zhang, X., Yu, T., Shu, H., and Fang, Z. (2017). Grouped grey wolf optimizer for maximum power point tracking of doubly-fed induction generator-based wind turbine. Energy Convers. Manag. 133, 427–443. doi:10.1016/j.enconman.2016.10.062
Yang, B., Zhong, L. E., Yu, T., Li, H. F., Zhang, X. S., Shu, H. C., et al. (2019). Novel bio-inspired memetic salp swarm algorithm and application to MPPT for PV systems considering partial shading condition. J. Clean. Prod. 215, 1203–1222. doi:10.1016/j.jclepro.2019.01.150
Yao, W., Jiang, L., Wen, J. Y., Wu, Q. H., and Cheng, S. J. (2015). Wide-area damping controller for power system inter-area oscillations: A networked predictive control approach. IEEE Trans. Control Syst. Technol. 23 (1), 27–36. doi:10.1109/TCST.2014.2311852
Zeng, R., Xu, L., Yao, L., Finney, S. J., and Wang, Y. (2016). Hybrid HVDC for integrating wind farms with special consideration on commutation failure. IEEE Trans. Power Deliv. 31, 789–797. doi:10.1109/TPWRD.2015.2440354
Zeng, X., Tu, X., Liu, Y., Fu, X., and Su, Y. (2022). Toward better drug discovery with knowledge graph. Curr. Opin. Struct. Biol. 72, 114–126. doi:10.1016/j.sbi.2021.09.003
Zhang, H., Dou, J., and Wei, S. (2013). Study on intelligent grid-connected controller for off-shore distributed wind power system. Lect. Notes Electr. Eng. 216, 159–166. doi:10.1007/978-1-4471-4856-2_20
Zhang, Y., Tang, F., Qin, F., Li, Y., Gao, X., and Du, N. (2021). Research on dynamic reactive power compensation scheme for inhibiting subsequent commutation failure of MIDC. Sustainability 13, 7829–7918. doi:10.3390/su13147829
Zheng, R. N., Hu, Z. S., Wen, Z. X., and Wang, J. J. (2020). AC fault detection method for HVDC system. Guangdong Electr. Power 33 (5), 97–104. CNKI: SUN: GDDL.0.2020-05-012.
Zheng, X. X., and Peng, P. (2019). Fault diagnosis of flexible HVDC converter based on preferred wavelet packet and AdaBoost-SVM. J. Power Syst. Automation 31 (3), 42–49. doi:10.19635/j.cnki.csu-epsa.000024
Keywords: HVDC, CatBoost, fault diagnosis, knowledge graph, BP
Citation: Wu J, Li Q, Chen Q, Zhang N, Mao C, Yang L and Wang J (2023) Fault diagnosis of the HVDC system based on the CatBoost algorithm using knowledge graphs. Front. Energy Res. 11:1144785. doi: 10.3389/fenrg.2023.1144785
Received: 15 January 2023; Accepted: 10 February 2023;
Published: 02 March 2023.
Edited by:
Xin Ning, Institute of Semiconductors (CAS), ChinaReviewed by:
Gabriel Gomes, State University of Campinas, BrazilCopyright © 2023 Wu, Li, Chen, Zhang, Mao, Yang and Wang. This is an open-access article distributed under the terms of the Creative Commons Attribution License (CC BY). The use, distribution or reproduction in other forums is permitted, provided the original author(s) and the copyright owner(s) are credited and that the original publication in this journal is cited, in accordance with accepted academic practice. No use, distribution or reproduction is permitted which does not comply with these terms.
*Correspondence: Qiang Li, bGlxaWFuZzFAZWh2LmNzZy5jbg==
Disclaimer: All claims expressed in this article are solely those of the authors and do not necessarily represent those of their affiliated organizations, or those of the publisher, the editors and the reviewers. Any product that may be evaluated in this article or claim that may be made by its manufacturer is not guaranteed or endorsed by the publisher.
Research integrity at Frontiers
Learn more about the work of our research integrity team to safeguard the quality of each article we publish.