 Guoning Xu1,2,3†
 Yang Gao
- 1Aerospace Information Research Institute, Chinese Academy of Sciences, Beijing, China
- 2University of Chinese Academy of Sciences, Beijing, China
- 3Key Laboratory of Earth Observation of Hainan Province, Hainan Aerospace Information Research Institute, Wenchang, China
Lithium-ion (Li-ion) batteries are widely used in such devices as today’s electrical vehicles, consumer electronics, and unmanned aerial vehicles, and will play a key role in the future. Unexpected Li-ion battery abnormities may result in serious inconvenience and enormous replacement costs. Thus, the diagnostic and prognostic methods play important roles in battery replacement scheduling, maintenance strategy development, and battery failure precaution, However, many published methods are unsuitable for both battery capacity and end-of-discharge. In this paper, a hybrid ensemble approach, integrating k-fold cross validation (k-CV) and genetic algorithm with back-propagation neural network (GA-BPNN), is proposed for capacity and end-of-discharge of Li-ion battery prognostics combined with geometrical features. Geometrical features extracted from charge-discharge cycles of Li-ion batteries are set as the inputs of the neural network. K-fold cross validation is introduced to determine the number of BPNN hidden layer neurons, genetic algorithm is used to initialize and optimize the connection weights and thresholds of BPNN. By the critical geometrical feature extraction and the ensemble BPNN model with k-fold cross validation and genetic algorithm, accurate battery capacity and end-of discharge are accomplished, making the proposed model can potentially be used for real-time estimate for the conditions given in this article. The performance of the proposed approach is demonstrated by using actual Li-ion battery data, which is supplied by the NASA Ames Research Center database.
1 Introduction
Li-ion batteries are widely used in electric vehicles, consumer electronics and unmanned aerial for lower weight, lower self-discharge rate, longer life cycle, higher energy density and the possibility of being recharged (Sbarufatti et al., 2017; Peng et al., 2018). However, unexpected Li-ion battery abnormities may result in serious inconvenience and enormous replacement costs (Liu et al., 2015). To improve the reliability and availability of Li-ion batteries, a battery management system (BMS) is proposed and essentially required to keep Li-ion batteries working safely and efficiently (Xia et al., 2015). Usually, battery capacity and end-of-discharge (EOD) are monitored and function as useful information for BMS (Lu et al., 2014; Ouyang et al., 2015). There are two different definitions for the EOD (end-of-discharge) in the literature. The first one is the time when the SoC hits a pre-determined limit (Pola et al., 2015) while the second one is when the terminal voltage reaches the lower cut-off voltage (Sbarufatti et al., 2017). Actually, these two definitions are equivalent. Thus, the diagnostic and prognostic method for battery capacity and EOD is crucial to BMS, which can play important roles in battery replacement scheduling, maintenance strategy development and battery failure precaution.
Battery capacity is rated in ampere-hour (Ah), which quantifies the available energy stored in the battery, whereas EOD is defined as the time at which the state of charge (SOC) reaches some predefined thresholds before the battery recharging (Saha et al., 2009). As time goes on, both the maximum available capacity and EOD of Li-ion battery will decrease. With the accumulation of charge-discharge cycles, available battery capacity becomes decreasingly worse and EOD falls sharply (Farmann et al., 2015). Once the threshold is exceeded, the battery will fail to supply the required energy and power. Thus, accurate estimation for capacity and EOD is a critical factor to optimize the energy use of Li-ion battery (Lu et al., 2014).
With significant improvements in software capabilities and modern experimental techniques, battery modeling and simulation have undergone prominent advancements in past decades. Various approaches to estimating battery capacity and EOD have been reported in recent research (Saha et al., 2009; Lu et al., 2014; Ouyang et al., 2015; Sbarufatti et al., 2017). In general, these approaches can be categorized as direct measurement method (Wei et al., 2018), model-based method (Lu et al., 2014), and data-driven method (Hu et al., 2014).
The direct measurement of battery capacity and EOD is based on the complete discharging of a cell after a full charging process (Wei et al., 2018). One of the most commonly used direct measurement methods is coulomb counting, which can estimate the battery capacity by a simple integration of current over time (Kong et al., 2008; Hu et al., 2014) and obtain the EOD when the minimum safe voltage threshold is reached (Saha et al., 2009). Although the direct measurement method is the most accurate measurement technique, it is impractical considering its time-consuming and energy-wasting drawbacks.
The model-based method can be highly accurate if the models are consistent with the failure mechanism. Extended Kalman filter (EKF) (Lai et al., 2020; Li et al., 2020; Zhu et al., 2020) and particle filter (PF) (Saha et al., 2009; Schwunk et al., 2012; Li et al., 2017) are the commonly adopted methods to build the battery prognostic model. EKF is used to estimate battery capacity based on the state models involved (Plett et al., 2004; Dong et al., 2016), while PF is used for the estimation of battery capacity and EOD by tracking the state vector (Saha et al., 2009; Li et al., 2017). Besides these two methods, other model-based methods are also applied in battery prognostic. Lu et al. (2014) proposed a geometrical model to calculate battery capacity under different operating conditions with the help of extracted geometrical features. Liaw et al. (2003) used an integrated approach to model the capacity fade during thermal aging, and the applicability of the proposed model is illustrated by an equivalent circuit model. Although the right model can ensure the performance of the estimation algorithms, the suitable model is difficult to be established because of the individual battery stochastic and environmental influences.
Data-driven methods are widely used in battery prognosis because of the flexibility of modeling, fast processing of prediction and the unnecessary consideration of electrochemical process. Data-driven methods for battery capacity and EOD estimation include the k-nearest neighbor algorithm (kNN) (Hu et al., 2014), radial basis function neural networks (RBFNN) (Sbarufatti et al., 2017), support vector machine (SVM) (Pattipati et al., 2011) and Bayesian framework (Saha et al., 2009; Ng et al., 2014). KNN has been used to predict the battery capacity by capturing the dependency of the capacity on the charge-related features (Hu et al., 2014). RBFNN along with PF has been proposed to predict EOD of Li-ion battery, and the number of hidden neurons was determined by a trial-and-error procedure (Sbarufatti et al., 2017). Battery capacity fade is predicted by SVM based on the collected baseline data (Pattipati et al., 2011). A Bayesian framework is used for tracking the capacity fade (Saha et al., 2009) and a naïve Bayes is proposed for capacity depletion modeling (Ng et al., 2014). Long short-term memory (LSTM) network is used to establish battery sate of health (SOH), which is proven to have better estimation accuracy compared with the other three machine learning algorithms, SVM, relevance vector machine (RVM), and Gaussian process regression (GPR) (Deng et al., 2022). To enable battery SOH estimation under actual vehicle operating conditions, a data-driven method based on a random partial charging process and the sparse GPR is proposed and obtained a good estimation accuracy (Deng et al., 2022). In (Hu et al., 2021), a hybrid EOL prediction method based on PF and LSTM neural network is proposed. The grey neural network (GNN) with a sliding window is proposed to track the battery capacity degradation trend (Lin et al., 2021). Since the estimated results are highly dependent on the quality of experiment data, data-driven methods can function well on the base of high data quality.
Considering the merits and drawbacks of the aforementioned prognostic methods, an integrated model with the combination of geometrical features and GA-BPNN with k-CV is proposed to estimate the capacity and EOD of Li-ion batteries. There are two innovations in this work. Firstly, the features both in time and frequency domains are replaced by the geometrical features as the inputs of the neural network, which can reflect the intrinsic degradation, avoid abnormal data affecting and sharply reduce the computation cost. Secondly, the proposed model determines the number of hidden neurons instead of empirically obtaining, and optimizes the initial weights and thresholds to solve the local minima problem of neural network (Montana et al., 1989; Wang et al., 2014; Patil et al., 2015; Wang et al., 2021). The prognostic results demonstrate that both the novel contributions could ensure the accurate estimation of capacity and EOD of Li-ion batteries.
2 Methodological approach
The objective of this section is to detail a novel model based on geometrical features and GA-BPNN with k-CV to estimate the capacity and EOD of Li-ion batteries, as shown in Figure 1. This model consists of three parts: 1) geometrical features extraction, 2) GA-BPNN with k-CV, 3) estimation and prediction. In Part 1, the geometrical features are extracted from the curves of voltage, current, and temperature in charge and discharge cycles. In Part 2, the number of BPNN hidden layer neurons is determined by k-CV method and the values of initial weights and thresholds are determined by GA algorithm. In Part 3, the capacity and EOD of Li-ion batteries are estimated and predicted.
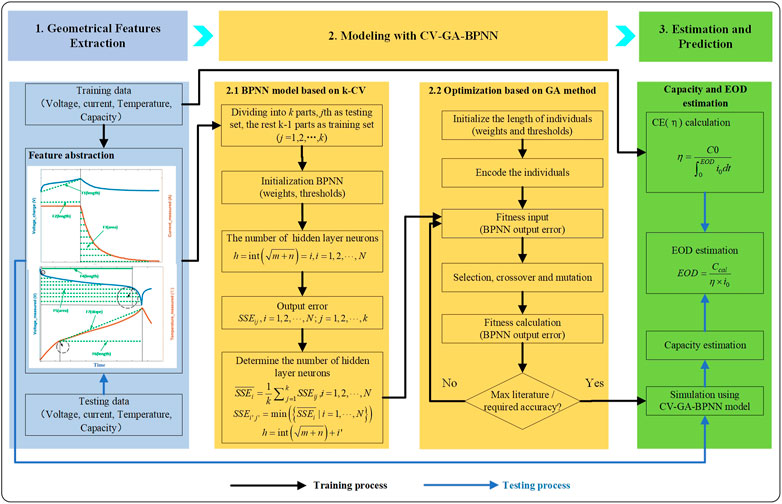
FIGURE 1. The flowchart of the proposed prognostic model for Li-ion battery capacity and EOD.
2.1 Geometrical features extraction
Features extracted from the charging process (Hu et al., 2014), discharging process (Patil et al., 2015) and both charging and discharging process (Lu et al., 2014) are used to estimate the capacity and EOD of Li-ion batteries. Compared with the feature extracting methods proposed (Hu et al., 2014; Patil et al., 2015), the geometrical features proposed by Lu et al. (2014) are easier to pick up, and both charging process and discharging process are considered. Besides of the current and voltage, the working environment temperature also plays an important role in battery degradation (Xing et al., 2013; Liu et al., 2014). In view of the above-mentioned facts, the geometrical features from both current and voltage curves and temperature curves are extracted. In recent years, features are extracted using electrochemical model in some studies (Xu et al., 2022; Xu et al., 2022; Li et al., 2023).
Given the basic measurements (voltage, current and temperature) of a Li-ion battery during charge and discharge cycles, we estimated the capacity and the EOD of Li-ion batteries. In this work, we extracted six geometrical features as the inputs of the proposed model, three features from charging curves and other three from discharging curves (Figure 2). Geometrical features extracted from the charging process are the length of time from the start to the maximum in voltage curves (F1), the length of constant current in current measured curves (F2) and the area under constant voltage in current measured curves (F3) (Figure 2A). Geometrical features extracted from the discharging process are the length between the two maximum-curvature points in voltage curves (F4), the length from the first local maximum curvature point to the maximum in temperature measured curves (F5) and the slope between the first maximum curvature point and the maximum in temperature measured curves (F6) (see Figure 2B). Of the six geometrical features, four of them are length (F1, F2, F4, F5), one is area (F3) and the last is slope (F6). The relationship between the selected 6 features and the key indicators for battery capacity estimation are shown in Table 1,2.
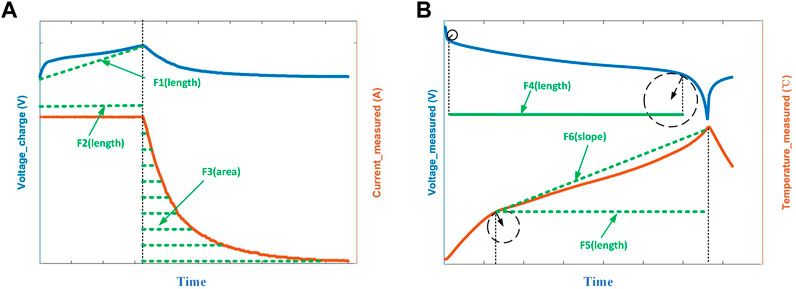
FIGURE 2. Six geometrical features (length, area and slope) extracted from charging and discharging process: (A) three charging related features in an illustrative charging cycle and (B) three discharging related features in an illustrative discharging cycle.

TABLE 1. The relationship between the selected features and key indicators.
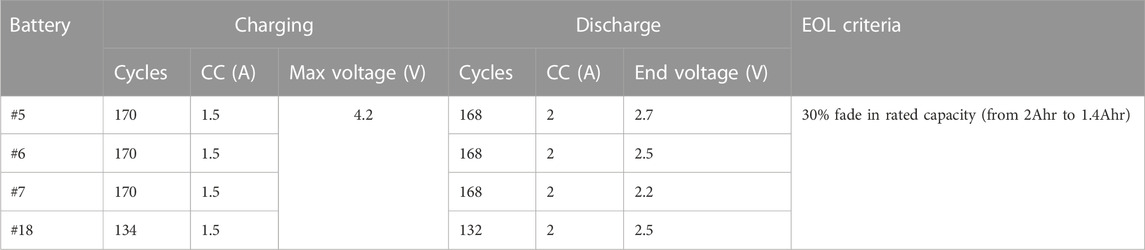
TABLE 2. List of batteries with their operating parameters.
2.2 Methodology
Because of having a strong generalization ability for non-linear mapping among parameters, BPNN has always been one of the most wildly used methods (Liu et al., 2014; Zhang et al., 2021; Ma et al., 2022; Wen et al., 2022; Zhang et al., 2023). The fact that a single hidden layer BP network can approximate any measurable function arbitrarily has been proved (Hornik et al., 1989), and the larger number of hidden neurons, the higher the capability of the algorithm in approximating complex relationships (Bishop et al., 1995). However, on the one hand, having a greater number of hidden neurons is not necessarily better, as two drawbacks will appear as the number grows (Sbarufatti et al., 2017). The first drawback is overfitting, as once the prediction is outside the training domain, the results differ more significantly. The second drawback involves an increase in the computation burden. More unknown parameters need to be optimized if the number of hidden neurons grows, which may significantly increase the computation burden. On the other hand, the initial weights and thresholds of the traditional BPNN are largely random, which may result in falling intointo a local minimum during the training process. Considering the above defects, we introduce k-CV method to determine the number of BPNN hidden layer neurons, and GA to initialize and optimize the connection weights and thresholds of BPNN.
2.2.1 BPNN model based on k-CV
In this section, we selected a single hidden layer BPNN as the prognostic model and used k-CV to determine the number of BPNN hidden layer neurons and avoid overfitting to some extent (Prechelt et al., 1998). The flowchart of BPNN model based on k-CV is shown in Figure 1. The empirical method (Sbarufatti et al., 2017) to determine the number of hidden neurons for BPNN, h, is shown as Eq. 1:
where m is the number of input neurons, n is the number of output neurons, int (·) is an integer function and p is an integer between 0 and N, empirically.
Assume
where Cappred is the predicted battery capacity.
After completing iterations using the classical BPNN model proposed in Section 2.1 and obtaining accepted errors, then the sum of squares due to error (SSE) can be estimated by Eq. 3 (Bishop C, 1995):
where Capreal is the real battery capacity.
Using k-CV, the training data set is divided into K groups, we set qth (j = 1,2, …, K) group as the testing group, and the other K-1 groups are set as training groups, the calculation process is shown in Algorithm 1.
The array of SSEs can be obtained after iterations,
The minimum value is calculated as Eq. 5:
where p’ is the position of the selected SSE.
Then the most suitable number of hidden neurons, h0, can be determined by Eq. 6:
2.2.2 BPNN model integrated with GA
The initial weights and thresholds of BPNN are largely random, and it is easy to fall into a local minimum during the training process, which led to large errors and uncertainties in the training results. GA is a parallel random search optimization method that simulates the genetic mechanism of nature and the theory of biological evolution, it has the characteristics of global search. To solve the local minima problem of neural network (Patil et al., 2015; Wang et al., 2021), GA is integrated BPNN to determine the initial weight and threshold of BPNN (Montana et al., 1989; Wang et al., 2016).
The flowchart of BPNN optimization based on GA method is shown in Figure 1. The detailed process is as follows.
1) Initialization
In this section, the individuals are encoded, and the length of the individuals is initialized. Each individual is encoded with the weights and thresholds of BPNN, and the number of elements (or genes) in each individual, Nsum, can be calculated as Eq. 7 (Wang et al., 2016).
where m, h and n are the number of nodes for input layer, hidden layer and output layer, respectively.
As the size of population, Spop, affects the results of genetic optimization and the execution efficiency of GA, too big or too small size is not suited.
2) Fitness function and selection
The fitness function is used in each iteration to evaluate the quality of all proposed individuals in the current population. In this work, the individual fitness value is formulated as Eq. 8 (Wang et al., 2016):
where
A selection mechanism, fitness proportionate selection, is used to determine the number of copies of each parent individual that can participate in the crossover process. According to a certain proportion, the individuals of the highest fitness are selected to extend to the next-generation.
We selected the individuals of highest fitness and directly entailed to the next-generation. The probability Pl of each individual l is calculated as Eq. 9:
where K is the population size.
3) Crossover and mutation
The crossover operator is mainly responsible for the global search property of the GA, whereas the mutation operator is used to prevent the permanent loss of any gene value (Kumar et al., 2007). The crossover and mutation operators can be obtained from both the binary coded method (Zoumas et al., 2004) and the real coded method (Zheng et al., 2017). In a real coded genetic algorithm, the simulated binary crossover and polynomial mutation are used. A real coded method is selected in this work.
The kth individual ak and lth individual al perform a crossover operation at the jth element as described in Eq. 10 (Zheng et al., 2017):
where b is a random value in [0,1],
The mutation operator for the jth element of lth individual, alj, can be expressed as Eq. 11 (Zheng et al., 2017):
where amax and amin are the maximum value and minimum value of alj; gen is the number of current iterations (or generations);
4) The optimized BPNN model
When the maximum iteration is reached, or the required accuracy is met, we obtained the optimized initial weights and thresholds for the BPNN. At this time, the training process is completed, and this obtained optimized BPNN model can be used for forecasting in the testing process.
2.3 Capacity and EOD estimation
We determined the number of hidden layer neurons with the help of k-CV in Section 3.2.1 and initialized the connection weights and thresholds by GA in Section 3.2.2. Then we estimated the capacity of Li-ion batteries by the GA-BPNN model with k-CV (see Algorithm 1). To obtain the EOD of Li-ion batteries, the equation for calculating the SOC (Zheng et al., 2017) is used:
where SOC0 is the initial SOC at time t0, CapN is the nominal capacity, i is the current,
In the training process, we set t0 = 0, then CapN is the initial capacity after charging, and SOC0 = 1. At the end of discharge, SOC = 0 and t = EOD, as discharge was carried out at a CC (i0), then Eq. (18) is modified to Eq. 13.
The CE is estimated by Eq. 14:
In the testing process, the calculated capacity Capcal is obtained, and the predicted EOD (EODPred) can be estimated by Eq. 15.
//Determine the number of BPNN hidden neurons based on k-CV.
//Tr_data is the training data set, Tr_dataj is qth group of Tr_data
Initialize K, N
Divided the Tr_data into K groups using k-CV
For p = 0: N
Calculate h using Eq. 1
For q = 1: K
Set the qth group Tr_dataq as the testing group
Set the other K-1 groups as the training group
Build the prediction model using Eq. 2
Predict the capacity using BPNN as Section 2.1
calculate SSEpq using Eq. 3
End
Calculate the mean value of SSE using Eq. 4
Calculate the most suitable number of hidden neurons, h0, using Eqs 5, 6
End
return h0 as the number of hidden neurons.
//Determine the values of BPNN initial weights and thresholds integrated with GA
Calculate Nsum using Eq. 7, and initialize the individuals.
Set the elements of each individual as the weights and thresholds of BPNN shown in Eq. 2
Calculate the fitness of each individual using Eq. 8 based on BPNN
For k = 1: Gmax
Select the individuals of the highest fitness using Eq. 9
Create new individuals using the crossover operator as Eq. 10
Evolve the individuals using the mutation operator as Eq. 11
Calculate the fitness of each individual using Eq. 8 based on BPNN
Trace the best fitness value and best individual.
if the mean value of fitness reaches the required accuracy
break;
end
End
Set the elements of best individual as the weights and thresholds of BPNN
Calculate the capacity using the optimized BPNN model
Calculate the EOD using Eq. 15
Algorithm 1:. Description of the GA-BPNN with k-CV.
3 Case study
3.1 Data description
In this paper, we used experimental data from both the charging and discharging processes of Li-ion batteries. The battery cycling data was provided by the Prognostics Center of Excellence (PCoE) at the NASA Ames Research Center25. The experimental system is composed of a set of Li-ion cells, chargers, loads, electrochemical impedance spectroscopy equipment for battery health monitoring, sensors, data acquisition system and a control computer. The sensors gather signals of voltage, current and temperature.
Table 1,2 lists the batteries (Batteries #5, #6, #7 and #18) used in this work, along with their respective operating parameters. The experiments are run through three different operational profiles (charge, discharge and impedance) at room temperature levels. Charging was carried out in a constant current (CC) mode at 1.5A until the battery voltage reached 4.2 V and then continued in a constant voltage mode until the charge current dropped to 20 mA. Discharging was stopped at different EODs. The experiments were stopped when the batteries reached end-of-life criteria, such as 30% fade in rated capacity. In this paper, batteries #5 and #6 are set as the training set, and batteries #7 and #18 are set as the testing set.
The data repository contains capacity, voltage, current, temperature, current load and voltage load recorded for each charge and discharge cycle of the batteries. With the exception of the cell capacity in discharge cycles, we recorded all other parameters over time. We observed that as the battery ages, measured voltage, current and temperature would change. Hence, the usual approach is to extract the relevant features from these curves to build the Li-ion battery degradation model (Hu et al., 2014; Lu et al., 2014; Patil et al., 2015).
3.2 Modeling with the proposed methodology
3.2.1 Geometrical features extraction
Three charging related features (F1, F2, F3) shown in Figure 2A are extracted from current and voltage curves from charging process. The original current and voltage curves of battery #5 and the tendency of F1, F2 and F3 are shown in Figure 3. Four cycles (9th, 138th, 304th, 471th) in battery #5 are depicted to illustrate the degradation of the three charging related features.
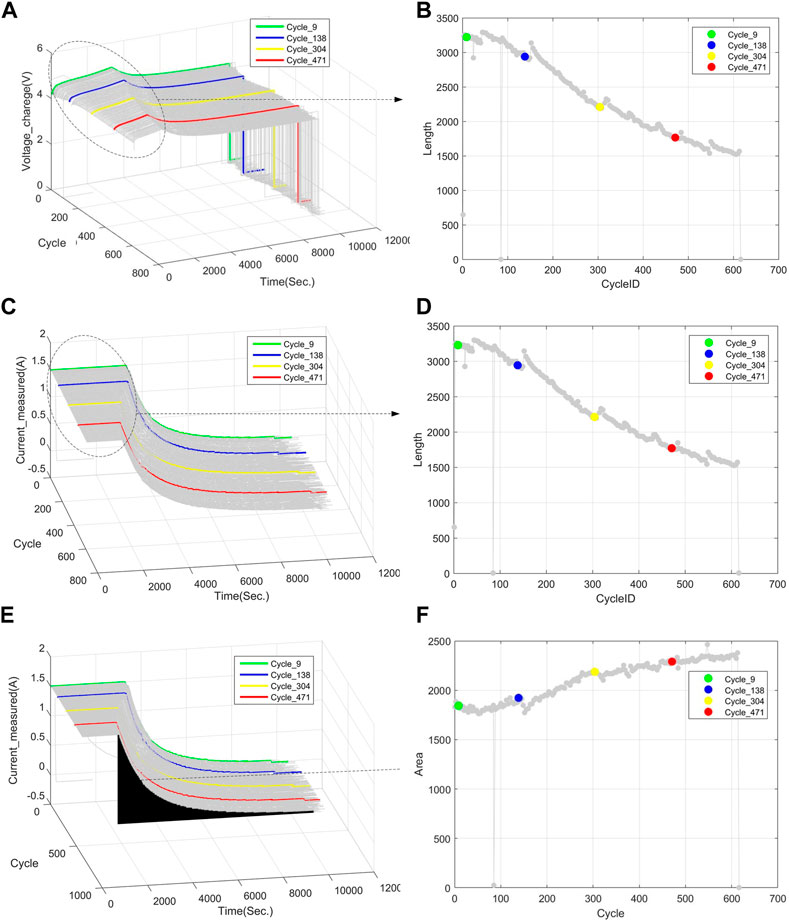
FIGURE 3. Features F1∼F3 extracted from battery #5: (A) voltage curves in charging process (B) the tendency of F1 over time (C) current curves in charging process (D) the tendency of F2 over time (E) current curves in charging process (F) the tendency of F3 over time.
Three discharging related features (F4, F5, F6) shown in Figure 2B are extracted from voltage and temperature curves from discharging process. Original voltage and temperature curves of battery #5 and the tendency of F4, F5 and F6 are shown in Figure 4. Four cycles (9th, 138th, 304th, 471th) in battery #5 are depicted to illustrate the degradation of the three discharging related features.
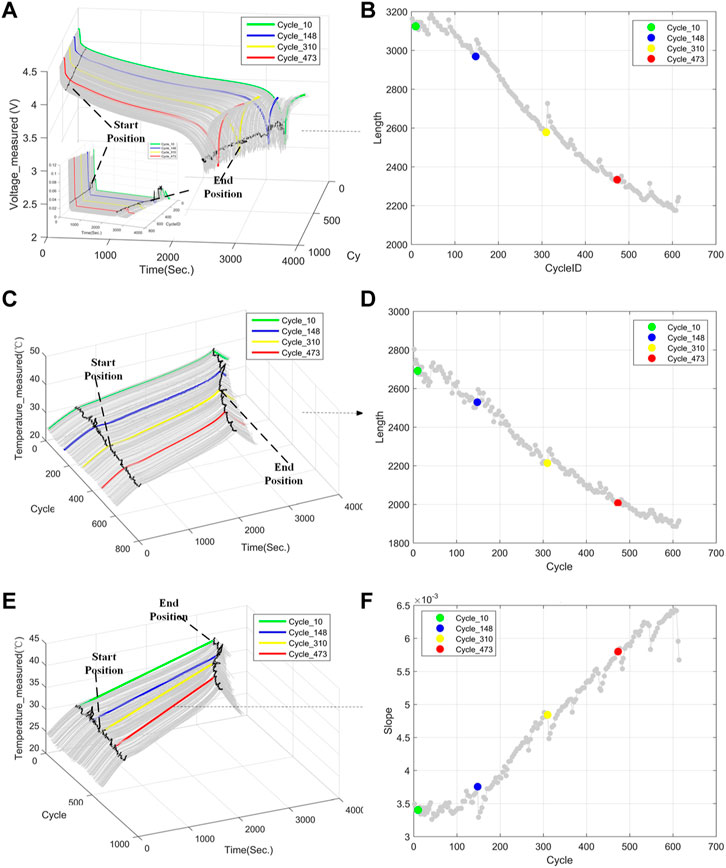
FIGURE 4. Features F4∼F6 extracted from battery #5: (A) voltage curves in charging process (B) the tendency of F4 over time (C) temperature curves in charging process (D) the tendency of F5 over time (E) temperature curves in charging process (F) the tendency of F6 over time.
3.2.2 Modeling
We set the data set of batteries #5 and #6 as training and validation data, the value of k in k-CV as 10 and the value of N in Eq. 1 as 11. The value of m and n of BPNN used here are 6 and 1, respectively. The function of “newff” in MATLAB is used to train the BPNN model, the number of epochs is set as 2000, the learning rate is set as 0.1, and the training performance goal is set as 1 × 10^(-8). Using Algorithm 1, the SSEs are calculated and the box plot of SSE is shown in Figure 5. The distribution of SSEs with different hidden neurons is shown in Figure 5A, and the first four boxes (h = 3,4,5,6) in Figure 5A are zoomed in Figure 5B. When h = 5, the mean value of SSEs is minimum, and the degree of SSEs dispersion is the lowest. Thus, the number of hidden neurons is determined as 5. Therefore, the structure of the proposed BPNN model has 6 inputs (the six extract features in Section 2.1) and 1 output (the Capacity), and has a single hidden layer with 5 neurons.
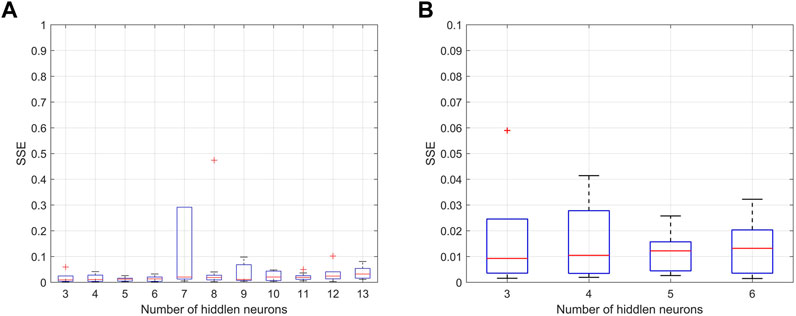
FIGURE 5. Box plot of SSE for batteries #5 and #6: (A) the distribution of SSE with different hidden neurons and (B) zoom in the first four boxes in (A).
After the number of hidden neurons is calculated, we can get the value of Nsum is 41. Considering results accuracy and computational efficiency, we set the size of the population is 20 and the maximum number of iterations is 50. The crossover probability and the mutation probability are set to 0.4 and 0.2 respectively. Using Algorithm 1, the final optimized weights and thresholds from GA are determined, and the updated model as Eq. 2 is used to estimate the capacity of Li-ion battery.
3.3 Results and discussion
3.3.1 Capacity estimation
To illustrate the proposed approach, we used batteries #7 and #18 for demonstration, all data training and testing processes are performed in a MATLAB environment. The prediction results of battery #7 are shown in Figure 6. Figure 6A shows the real and the estimated capacity by BPNN, while Figure 6B depicts the results estimated by GA-BPNN with k-CV. The absolute errors of BPNN based model and proposed model are shown in Figure 6C, and the error distribution is depicted in Figure 6D. The estimation capacity and prediction errors of battery #18 by BPNN and proposed model are depicted in Figure 7. Images (a) and (b) in Figures 6, 7 show that the degradation curve estimated by the proposed model are closer to the real degradation curve than classic BPNN, while Images (c) and (d) in Figures 6, 7 illustrate that results predicted by proposed model are more accurate than classic BPNN.
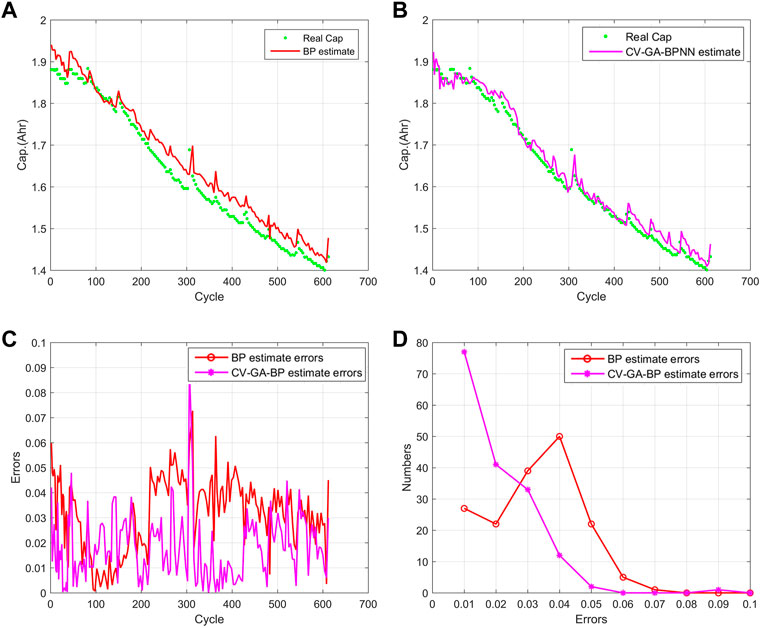
FIGURE 6. Capacity estimation results of battery #7. (A) the real and the estimated capacity by BPNN, (B) the real and the estimated capacity by proposed model, (C) the absolute errors of BPNN based model and proposed model, (D) the error distribution of BPNN based model and proposed model.
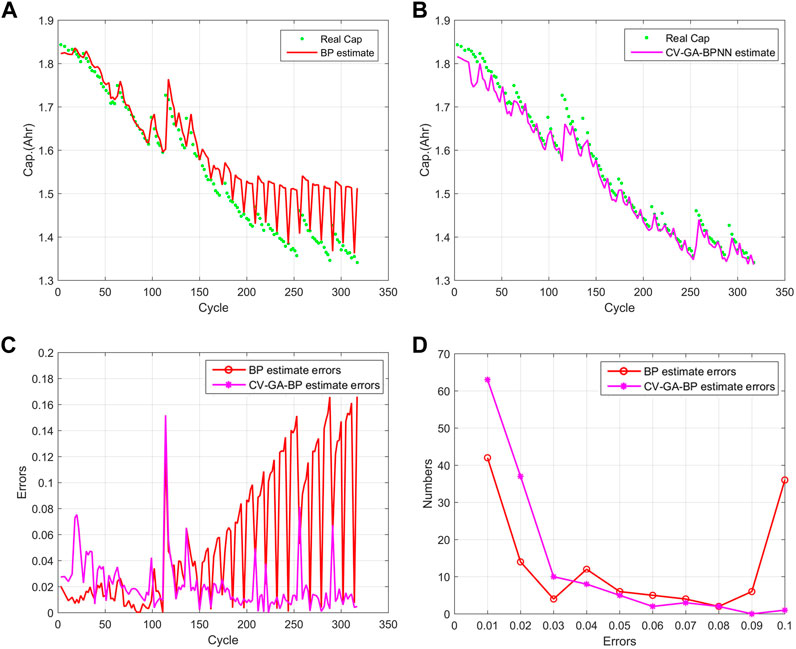
FIGURE 7. Capacity estimation results of battery #18. (A) the real and the estimated capacity by BPNN, (B) the real and the estimated capacity by proposed model, (C) the absolute errors of BPNN based model and proposed model, (D) the error distribution of BPNN based model and proposed model.
The mean absolute error (MAE) and root mean square error (RMSE) by BPNN, GA-BPNN with k-CV, the models in References (Lu et al., 2014) and (Li et al., 2015) are shown in Table 3. The Error 1 used in Reference (Lu et al., 2014) is MAE used in this paper. The simple linear model, p1*t + p2, represents the capacity degradation trend is reported in (Li et al., 2015), which is used for estimating the capacity. The parameters, p1 and p2 here, are regressed by the capacity values of all cycles based on the minimum variance principle. The proposed integration model gets the minimum MAE and RMSE in Battery #7 (0.0179 and 0.0218) and #18 (0.0207 and 0.0285), which demonstrates that the proposed model obtains more accurate results than the other three models.

TABLE 3. Comparison of the estimation accuracy.
3.3.2 EOD estimation
The capacity of batteries #5 and #6 and the value of
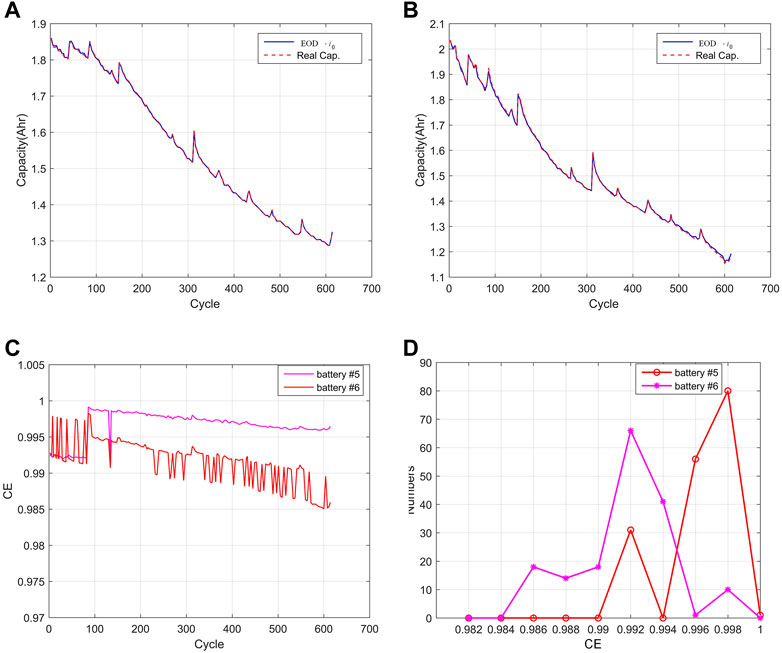
FIGURE 8. The capacity of batteries #5 and #6 and value of
The capacity estimated by proposed model is used to calculate the EOD (Eq. 15). The current in the discharge cycle is 2A, the EOD of batteries #7 and #18 can be estimated by Eq. (20). The estimated EODs for batteries #7 and #18 are shown in Figures 9A, B, respectively. The relative errors (|real_EOD—estimated_EOD|/real_EOD) are shown in Figure 9C and the relative errors distribution is depicted in Figure 9D. The estimation EOD curves shown in Figures 9A, B are consistent with the real EOD curves, Figures 9C, D illustrate that the maximum relative errors for batteries #7 and #18 are 0.0426 and 0.0443, and more than 90% of the relative errors are smaller than 0.03. Both indicate that the proposed model exhibits high accuracy in battery EOD estimations.
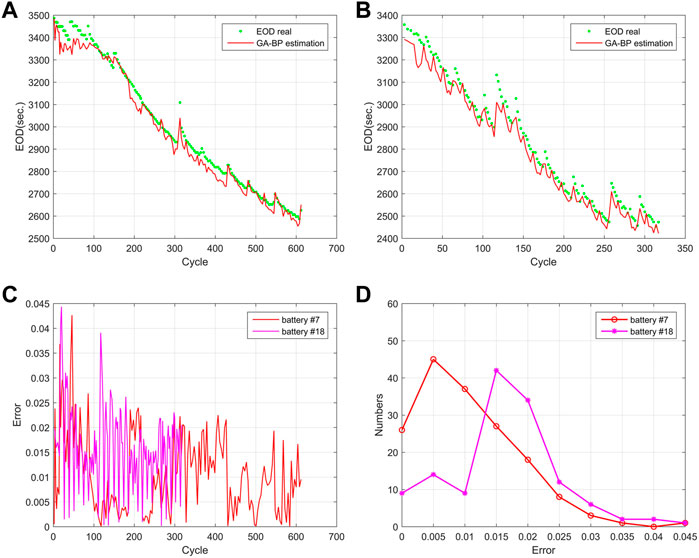
FIGURE 9. Estimated EODs and their relative error for batteries #7 and #18. (A) the estimated EODs for batteries #7, (B) the estimated EODs for batteries #18, (C) the relative errors for batteries #7 and #18, (D) the relative errors distribution for batteries #7 and #18.
3.3.3 Discussion
In the battery capacity curves (the red line in Figure 10), the capacity regeneration (Hu et al., 2020) appears. The capacity regeneration makes the geometrical features extracted from two adjacent cycles differ greatly, which leading to larger errors. The reason for the capacity regeneration is that the battery capacity will increase in the next cycle if the battery is allowed to rest (Saha et al., 2009). Therefore, a long rest causes a high increase in battery capacity, which explains the appearance of the capacity regeneration.
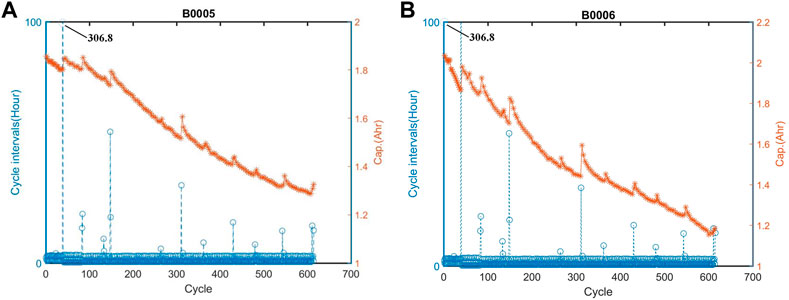
FIGURE 10. Capacity curves versus cycle intervals curves of batteries #5 and #6. (A) Capacity curves versus cycle intervals curves of batteries #5, (B) Capacity curves versus cycle intervals curves of batteries #6.
The charge-discharge cycle intervals of batteries #5 and #6 are analyzed. We found that the long intervals (See Figure 10) generally match the jumps in the battery capacity curves, in accordance with the long rest times leading to jumps. To avoid the effects of these jumps, the jump points in the capacity curves are deleted and the capacity and EOD are re-estimated.
The estimation capacity of batteries #7 and #18 is shown in Figures 11A, B, and the EOD prediction is shown in Figures 11C, D; the MAE and RMSE of the re-estimation battery capacity of batteries #7 and #18 are shown in Table 4. The optimized results calculated with the proposed integration model gets the minimum MAE and RMSE in Battery #7 (0.0171 and 0.0178) and #18 (0.0114 and 0.0142), which demonstrates that the proposed model obtains more accurate results than the other three models. Therefore, the results of re-estimated capacity demonstrate that avoiding the effects of jumps would improve the accuracy of the proposed model.
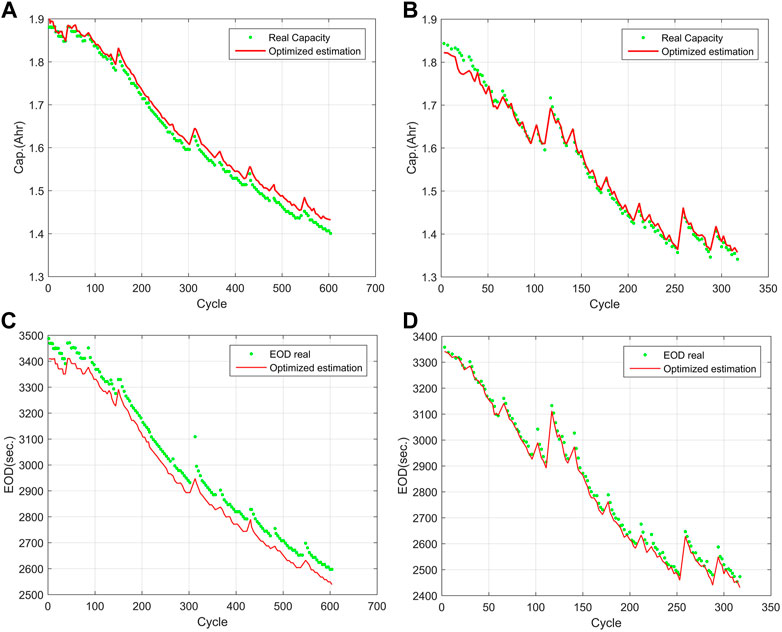
FIGURE 11. Re-estimation battery capacity and EOD of batteries #7 and #18. (A) the estimation capacity of batteries #7, (B) the estimation capacity of batteries #18, (C) the EOD prediction of batteries #7, (D) the EOD prediction of batteries #18.
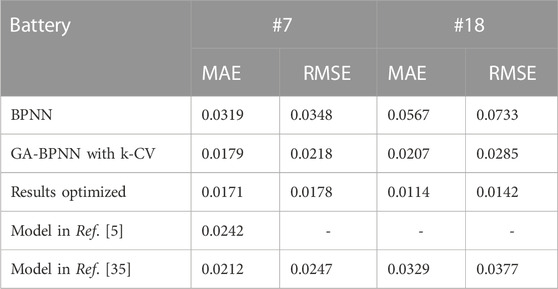
TABLE 4. MAE and RMSE of the re-estimation battery capacity.
4 Conclusion
In this work, a hybrid ensemble approach, GA-BPNN with k-CV, integrated with geometrical features, is proposed for capacity and EOD prognostics. The geometrical features reflect the intrinsic degradation and sharply reduce the computation cost compared with the features both in time and frequency domains, while the proposed model improves the prognostics accuracy contract with the classic BPNN. The values of MAE and RMSE calculated by the proposed approach for capacity and EOD for batteries #7 and #18 have a better performance than the classic BPNN model and the other two models. After optimizing the jump phenomenon in the capacity curves, the proposed approach gets a more accurate result. The case study demonstrates that the proposed integration model can be used to estimate the capacity and EOD of Li-ion batteries accurately under the conditions similar with this work.
However, the proposed model in this paper has its limitation. The proposed six geometrical features used to estimate the capacity and EOD of Li-ion batteries are extracted from both charging and discharging process, once the curves of voltage, current and temperature are unknown or unable to obtain, the method introduced would not work. Therefore, our future work will focus on the universality of the methodology for battery capacity estimation and EOD prognostics.
Data availability statement
Publicly available datasets were analyzed in this study. This data can be found here: https://ti.arc.nasa.gov/tech/dash/groups/pcoe/prognostic-data-repository/.
Author contributions
GX, YG, YL, ZJ, XD, YY, and SW were responsible for the main writing of the paper. All authors contributed to the article and approved the submitted version.
Funding
This project is supported by National Natural Science Foundation of China (Grant No. 52005480 and No. 52005479), Research and Development Project of Key Core and Common Technology of Shanxi Province (2020014), the Scientific Experimental System in Near Space of Chinese Academy of Sciences (XDA17020304), Natural Science Foundation of Hainan Province (Grant No. 123MS109).
Conflict of interest
The authors declare that the research was conducted in the absence of any commercial or financial relationships that could be construed as a potential conflict of interest.
Publisher’s note
All claims expressed in this article are solely those of the authors and do not necessarily represent those of their affiliated organizations, or those of the publisher, the editors and the reviewers. Any product that may be evaluated in this article, or claim that may be made by its manufacturer, is not guaranteed or endorsed by the publisher.
References
Deng, Z., Hu, X., Li, P., Lin, X., and Bian, X. (2021). Data-driven battery state of health estimation based on random partial charging data. IEEE Trans. Power Electron 37 (5), 5021–5031. doi:10.1109/TPEL.2021.3134701
Deng, Z., Lin, X., Cai, J., and Hu, X. (2022). Battery health estimation with degradation pattern recognition and transfer learning. J. Power Sources 525, 231027. doi:10.1016/j.jpowsour.2022.231027
Dong, G., Wei, J., and Chen, Z. (2016). Kalman filter for onboard state of charge estimation and peak power capability analysis of lithium-ion batteries. J. Power Sources 328, 615–626. doi:10.1016/j.jpowsour.2016.08.065
Farmann, A., Waag, W., Marongiu, A., and Sauer, D. U. (2015). Critical review of on-board capacity estimation techniques for lithium-ion batteries in electric and hybrid electric vehicles. J. Power Sources 281, 114–130. doi:10.1016/j.jpowsour.2015.01.129
Hornik, K., Stinchcombe, M., and White, H. (1989). Multilayer feedforward networks are universal approximators. Neural Netw. 2, 359–366. doi:10.1016/0893-6080(89)90020-8
Hu, C., Jain, G., Zhang, P., Schmidt, C., Gomdam, P., and Gorka, T. (2014). Data-driven method based on particle swarm optimization and k-nearest neighbor regression for estimating capacity of lithium-ion battery. Appl. Energy. 129, 49–55. doi:10.1016/j.apenergy.2014.04.077
Hu, X., Yang, X., Feng, F., Liu, K., and Lin, X. (2021). A particle filter and long short-term memory fusion technique for lithium-ion battery remaining useful life prediction. J. Dyn. Syst. Meas. Control 143 (6). doi:10.1115/1.4049234
Kong, S., Moo, C., Chen, Y., and Hsieh, Y. (2009). Enhanced coulomb counting method for estimating state-of-charge and state-of-health of lithium-ion batteries. Appl. Energy. 86, 1506–1511. doi:10.1016/j.apenergy.2008.11.021
Kumar, S., and Naresh, R. (2007). Efficient real coded genetic algorithm to solve the non-convex hydrothermal scheduling problem. Int. J. Ele. Power. 29, 738–747. doi:10.1016/j.ijepes.2007.06.001
Lai, X., Wei, Y., Yifan, C., Chao, Q., Zheng, Y., Qin, C., et al. (2020). Capacity estimation of lithium-ion cells by combining model-based and data-driven methods based on a sequential extended kalman filter. Energy 216, 119233. doi:10.1016/j.energy.2020.119233
Li, X., Ju, L., Geng, G., and Jiang, Q. (2023). Data-driven state-of-health estimation for lithium-ion battery based on aging features. Energy 274, 127378. doi:10.1016/j.energy.2023.127378
Li, X., Rezvanizaniani, M., Ge, Z., Abuali, M., and Lee, J. (2015). Bayesian optimal design of step stress accelerated degradation testing. J. Syst. Eng. Electron. 26 (3), 502–513. doi:10.1109/JSEE.2015.00058
Li, Y., Shi, J., Gong, W., and Zhang, M. (2017). An ensemble model for engineered systems prognostics combining health index synthesis approach and particle filtering. Qual. Reliab. Eng. Int. 33, 2711–2725. doi:10.1002/qre.2229
Liaw, B., Jungst, R., Nagasubramanian, G., Case, H., and Doughty, D. (2004). Modeling capacity fade in lithium-ion cells. J. Power Sources 140, 157–161. doi:10.1016/j.jpowsour.2004.08.017
Li, W., Fan, Y., Ringbeck, F., Jöst, D., Han, X., Ouyang, M., et al. (2020). Electrochemical model-based state estimation for lithium-ion batteries with adaptive unscented kalman filter. J. Power Sources 476, 228534. doi:10.1016/j.jpowsour.2020.228534
Lin, C. A., Yd, A., Bl, A., Sw, A., Yw, B., and Hp, A. (2021). Remaining useful life prediction of lithium-ion battery using a novel particle filter framework with grey neural network. Energy 244, 122581. doi:10.1016/j.energy.2021.122581
Liu, G., Ouyang, M., Lu, L., Li, J., and Hua, J. (2015). A highly accurate predictive-adaptive method for lithium-ion battery remaining discharge energy prediction in electric vehicle applications. Appl. Energy 149, 297–314. doi:10.1016/j.apenergy.2015.03.110
Liu, X., Chen, Z., Zhang, C., and Wu, J. (2014a). A novel temperature-compensated model for power Li-ion batteries with dual-particle-filter state of charge estimation. Appl. Energy. 123, 263–272. doi:10.1016/j.apenergy.2014.02.072
Liu, X., Wu, J., Zhang, C., and Chen, Z. (2014). A method for state of energy estimation of lithium-ion batteries at dynamic currents and temperatures. J. Power Sources. 270, 151–157. doi:10.1016/j.jpowsour.2014.07.107
Lu, C., Tao, L., and Fan, H. (2014). Li-Ion battery capacity estimation: A geometrical approach. J. Power Sources 261, 141–147. doi:10.1016/j.jpowsour.2014.03.058
Ma, Y., Yao, M., Liu, H., and Tang, Z. (2022). State of health estimation and remaining useful life prediction for lithium-ion batteries by improved particle swarm optimization-back propagation neural network. J. Energy Storage 52, 104750. doi:10.1016/j.est.2022.104750
Montana, D., and Davis, L. “Training feed forward neural network using genetic algorithm,” in Proceedings of the of International Joint Conference on Artificial Intelligence, San Mateo, CA, USA, August 1989.
Ng, S., Xing, Y., and Tsui, K. (2014). A naive Bayes model for robust remaining useful life prediction of lithium-ion battery. Appl. Energy. 118, 114–123. doi:10.1016/j.apenergy.2013.12.020
Ouyang, M., Feng, X., Han, X., Lu, L., Li, Z., and He, X. (2016). A dynamic capacity degradation model and its applications considering varying load for a large format Li-ion battery. Appl. Energy. 165, 48–59. doi:10.1016/j.apenergy.2015.12.063
Patil, M., Tagade, P., Hariharan, K., Christophersen, J., Song, T., Yeo, T., et al. (2015). A novel multistage support vector machine based approach for Li ion battery remaining useful life estimation. Appl. Energy. 159, 285–297. doi:10.1016/j.apenergy.2015.08.119
Pattipati, B., Sankavaram, C., and Pattipati, K. (2011). System identification and estimation framework for pivotal automotive battery management system characteristics. Ieee. Throughput Syst. Man. Cy. C 41, 869–884. doi:10.1109/TSMCC.2010.2089979
Peng, Y., Hou, Y., Song, Y., Pang, J., and Liu, D. (2018). Lithium-ion battery prognostics with hybrid Gaussian process function regression. Energies 11. doi:10.3390/en11061420
Plett, G. (2004). Extended kalman filtering for battery management systems of LiPB-based HEV battery packs: part 3. State and parameter estimation. J. Power Sources 161, 277–292. doi:10.1016/j.jpowsour.2004.02.033
Pola, D. A., Navarrete, H. F., Orchard, M. E., Rabié, R. S., Cerda, M. A., Olivares, B. E., et al. (2015). Particle-filtering-based discharge time prognosis for lithium-ion batteries with a statistical characterization of use profiles. IEEE Trans. Rel. 64 (2), 710–720. doi:10.1109/TR.2014.2385069
Prechelt, L. (1998). Automatic early stopping using cross validation: quantifying the criteria. Neural Netw. 11, 761–767. doi:10.1016/S0893-6080(98)00010-0
Saha, B., and Goebel, K. (2007). Battery data set NASA ames prognostics data repository. https://ti.arc.nasa.gov/tech/dash/groups/pcoe/prognostic-data-repository.Available at
Saha, B., and Goebel, K. “Modeling Li-ion battery capacity depletion in a particle filtering framework,” in Proceedings of the Annual Conference of the PHM Society, San Diego, CA, USA, January 2009.
Saha, B., Goebel, K., Poll, S., and Christophersen, J. (2009). Prognostics methods for battery health monitoring using a bayesian framework. IEEE Throughput Instrum. Meas. 58, 291–296. doi:10.1109/TIM.2008.2005965
Sbarufatti, C., Corbetta, M., Giglio, M., and Cadini, F. (2017). Adaptive prognosis of lithium-ion batteries based on the combination of particle filters and radial basis function neural networks. J. Power Sources 344, 128–140. doi:10.1016/j.jpowsour.2017.01.105
Schwunk, S., Armbruster, N., Straub, S., Kehl, J., and Vetter, M. (2013). Particle filter for state of charge and state of health estimation for lithium–iron phosphate batteries. J. Power Sources. 239, 705–710. doi:10.1016/j.jpowsour.2012.10.058
Wang, H., Li, J., and Liu, L. (2021). Process optimization and weld forming control based on GA-BP algorithm for riveting-welding hybrid bonding between magnesium and CFRP. J. Manuf. Process. 70, 97–107. doi:10.1016/j.jmapro.2021.08.024
Wang, S., Zhang, N., Wu, L., and Wang, Y. (2016). Wind speed forecasting based on the hybrid ensemble empirical mode decomposition and GA-BP neural network method. Renew. Energy 94, 629–636. doi:10.1016/j.renene.2016.03.103
Wei, J., Dong, G., and Chen, Z. (2018). Remaining useful life prediction and state of health diagnosis for lithium-ion batteries using particle filter and support vector regression. IEEE Throughput Ind. Electron. 65, 5634–5643. doi:10.1109/TIE.2017.2782224
Wen, J., Chen, X., Li, X., and Li, Y. (2022). SOH prediction of lithium battery based on IC curve feature and BP neural network. Energy 261, 125234. doi:10.1016/j.energy.2022.125234
Xia, B., Lao, Z., Zhang, R., Tian, Y., Chen, C., Sun, Z., et al. (2018). Online parameter identification and state of charge estimation of lithium-ion batteries based on forgetting factor recursive least squares and nonlinear kalman filter. Energies 11, 3. doi:10.3390/en11010003
Xing, Y., He, W., Pecht, M., and Tsui, K. (2014). State of charge estimation of lithium-ion batteries using the open-circuit voltage at various ambient temperatures. Appl. Energy. 113, 106–115. doi:10.1016/j.apenergy.2013.07.008
Xu, L., Deng, Z., Xie, Y., Lin, X., and Hu, X. (2022a). A novel hybrid physics-based and data-driven approach for degradation trajectory prediction in Li-ion batteries. IEEE T Transp. Electr., 1. doi:10.1109/tte.2022.3212024
Xu, Z., Wang, J., Lund, P. D., and Zhang, Y. (2022). Co-estimating the state of charge and health of lithium batteries through combining a minimalist electrochemical model and an equivalent circuit model. Energy 240, 122815. doi:10.1016/j.energy.2021.122815
Zhang, G., Xia, B., and Wang, J. (2021). Intelligent state of charge estimation of lithium-ion batteries based on LM optimized back-propagation neural network. J. Energy Storage 44, 103442. doi:10.1016/j.est.2021.103442
Zhang, J., and Lee, J. (2011). A review on prognostics and health monitoring of Li-ion battery. J. Power Sources 196, 6007–6014. doi:10.1016/j.jpowsour.2011.03.101
Zhang, Y., Li, J., Fei, L., Feng, Z., Gao, J., Yan, W., et al. (2023). Operational performance estimation of vehicle electric coolant pump based on the ISSA-BP neural network. Energy 268, 126701. doi:10.1016/j.energy.2023.126701
Zheng, Y., Ouyang, M., Han, X., Lu, L., and Li, J. (2018). Investigating the error sources of the online state of charge estimation methods for lithium-ion batteries in electric vehicles. J. Power Sources 377, 161–188. doi:10.1016/j.jpowsour.2017.11.094
ZhuDuanZhangZhang, R. B. J. Q., and Zhang, C. (2020). Co-estimation of model parameters and state-of-charge for lithium-ion batteries with recursive restricted total least squares and unscented kalman filter. Appl. Energy 277, 115494. doi:10.1016/j.apenergy.2020.115494
Keywords: lithium-ion battery, capacity, end-of-discharge, geometrical features, CV-GA-BPNN
Citation: Xu G, Gao Y, Li Y, Jia Z, Du X, Yang Y and Wang S (2023) A novel approach for prognosis of lithium-ion battery based on geometrical features and data-driven model. Front. Energy Res. 11:1144450. doi: 10.3389/fenrg.2023.1144450
Received: 14 January 2023; Accepted: 12 April 2023;
Published: 15 August 2023.
Edited by:
Lingna Liu, China University of Geosciences, ChinaReviewed by:
Zhongwei Deng, University of Electronic Science and Technology of China, ChinaLe Xu, Stanford University, United States
Copyright © 2023 Xu, Gao, Li, Jia, Du, Yang and Wang. This is an open-access article distributed under the terms of the Creative Commons Attribution License (CC BY). The use, distribution or reproduction in other forums is permitted, provided the original author(s) and the copyright owner(s) are credited and that the original publication in this journal is cited, in accordance with accepted academic practice. No use, distribution or reproduction is permitted which does not comply with these terms.
*Correspondence: Yongxiang Li, bGl5eEBhaXJjYXMuYWMuY24=
†These authors have contributed equally to this work and share first authorship