 Kacper Świechowski
 Waheed A. Rasaq
 Ewa Syguła
- Department of Applied Bioeconomy, Wrocław University of Environmental and Life Sciences, Wrocław, Poland
In this research, biochar (BC) made from the brewer’s spent grain at temperatures of 300, 450, and 600 °C was produced and subjected to the anaerobic digestion of the brewer’s spent grain. BC shares of 2, 5, 10, and 50% concerning total solids of the substrate were tested at three substrate-to-inoculum ratios of 0.5, 1.0, and 2.0, respectively. The anaerobic digestion process was performed at 37 °C and took 30 days. For anaerobic digestion, biomethane production was recorded and used for kinetics parameter determination according to the first-order model. After the process, process residues (digestate) were analyzed for fertilizing potential. The biomethane yield differs from 264 to 325 mL×gvs−1, while kinetics parameters were 292.7–344.7 mL×gvs−1, 0.08–0.11 d−1, and 24–42.5 mL×(gvs×d)−1, for ymax, k, and r, respectively. The main factors affecting biomethane production were substrate-to-inoculum ratio and BC share. No specific effect between BC types on biomethane yield was found. An increase in BC share from 2% to 50% concerning specific SIR results in biomethane production improvement in the range of 1.8% to 10%. The main factors affecting the quality of digestate (nutrients) were the quality of the used inoculum and the quantity of the used substrate. The research results were complex and showed that the final effect of BC supplementation depends not only on BC properties, but also on process operational parameters and the quality of the used feedstock.
1 Introduction
Organic waste and biomass utilization have great potential as a feedstock to waste-to-energy and waste-to-carbon in the circular economy concepts. Currently, approximately 46% of biomass is used for 1) energy production, 2) animal bedding, and 3) incorporation back into the soil to enhance organic content (Camia and Robert, 2018). One of the abundant organic wastes spread evenly around the globe is waste from the beer production process. As of 2020, beer consumption was estimated at 1.9 billion hL (Conway, 2022), and the overall beer market was worth around 743.8 billion USD (Report, 2022). Beer is one of the most globally consumed alcoholic beverages, but its production harms the environment. Beer production has a global warming potential (GPW) of 0.40–1.47 kgCO2eq.×Lbeer−1 (Amienyo and Azapagic, 2016) and with other alcoholic beverages account for 0.7% of global greenhouse gas emission (Shin and Searcy, 2018). To produce 1 L of beer, 0.10–0.19 kWhel of electrical and 0.32–0.37 kWht of thermal energy are needed (Cheri et al., 2005). Moreover, breweries use 4–7 L of water per liter of beer produced (Olajire, 2020).
The main solid waste from beer production is brewer’s spent grain (BSG). BSG accounts for about 85% of all waste generated during beer production (Aliyu and Bala, 2010). Approximately 0.2 kg of wet BSG is produced per liter of beer produced (González-García et al., 2018). In the EU and the United States alone, production volumes are ∼3.4 × 10⁶ Mg and 4.5 × 10⁶ Mg, respectively. Due to its composition, BSG has great potential for biogas production. The total biogas production capacity of brewery waste streams in the EU per year is estimated at 12.6–39.7 × 10⁹ MJ (Lorenz et al., 2013). The production of biogas from organic waste is considered an environmental-friendly technology, reducing waste volumes, converting organic matter into useful renewable energy, and reducing greenhouse gas emission (Čater et al., 2015). Biogas is produced in the anaerobic digestion (AD) process, also known as methane fermentation. The AD allows converting a huge quantity of wet and biodegradable biomass into biogas/biomethane and digestate within a short time. Due to the application of AD, beer production can become more environmentally friendly and bring additional income to brewery owners (Li et al., 2011; Miller et al., 2021). BSG is characterized by a methane yield of ∼305 m3 CH4×MgVS-1 (Oliveira et al., 2018) or around ∼42 m3 CH4×MgwetBSG-1. AD is a mature technology but can be improved by optimization of process parameters for specific feedstock types and specific technology or by using additive process improvers. One of the most recently studied additives is biochar (BC). Depending on BC properties, different results can be expected from its supplementation into AD. BC supplementation affects the AD process at different levels and process stages. In the AD process, there are four stages: hydrolysis, acidogenesis, acetogenesis, and methanogenesis. The stages are performed by hydrolytic microorganisms, fermentative microorganisms, acidogenic-microorganisms (hydrogen-producing acetogens and homoacetogens), and methanogenic-microorganisms (acetoclastic and hydrogenotrophic methanogens) (Lohani and Havukainen, 2018). These groups interact, the products of one are the substrates of the other, and syntrophic mechanisms occur (Hao et al., 2020). In extreme cases, overproduction by one group may inhibit the functioning of others, leading to AD process inhibition or collapse. BC, due to its porous structure and the presence of some essential functional groups, can absorb and immobilize excess ammonia, heavy metals, and toxins (Syguła et al., 2022). Porous structure also promotes microorganism growth on the BC surface. In the case of digester overloading with easily degradable organic matter, the BC can mitigate acidification and maintain process stability. BC also improves buffer capacity through the presence of functional groups, and ions such as Na+, K+, Ca2+, and Mg2+ (Zhao et al., 2021). Moreover, it is considered that BC promotes direct interspecies electron transfer (DIET) between some syntrophic bacteria and methanogens (Chen et al., 2022), accelerating substrate degradation, lowering volatile fatty acids concentration, and increasing methane production. The DIET is a mechanism that bypasses a need for reduced electron carriers (formate or H2) for the complex organic matter transformation into methane due to the presence of free electron flow between cells of different microorganism species by physical and electrical connections (Liu et al., 2012; Gahlot et al., 2020). Though research showed that BC promotes specific AD phases (hydrolysis, acidification, and methanogenesis), syntrophic metabolism, and interspecies electron transfer, it is not clear which mechanism is leading (Wu et al., 2020). According to our knowledge, there is no other research that has studied the effect of BC made from BSG on the AD of BSG except a study by Dudek et al. (2019) and our preliminary research (Świechowski et al., 2022). Nevertheless, these studies were limited to biogas production measurements and show complex results. For that reason, in this research, broad ranges of BCs, BC shares, and initial AD conditions effects on biomethane production and digestate quality were investigated.
2 Materials and methods
2.1 Materials
The BSG was collected from a laboratory-scale beer production installation. The mash pilsner malt Viking Malt (Strzegom) produced from malting barley was used for beer production. Fresh BSG was dried at 80 °C to dry mass using the laboratory dryer (WAMED, model KBC-65W, Warsaw, Poland). BCs were produced from dry BSG at three temperatures of 300, 450, and 600 °C, and one retention time of 60 min. BCs were labeled BC300, BC450, and BC600, respectively. BCs were made using the laboratory muffle furnace (SNOL, model 8.1/1100, Utena, Lithuania), according to Świechowski et al. (2019). Digestate (D) used as inoculum (methane fermentation starter) was collected from a MWel agriculture biogas plant (Bio-Wat Sp. z o. o., Świdnica, Poland). The biogas plant feedstocks were maize silage and other unspecified seasonal agricultural substrates. To ensure the homogeneity of inoculum, collected digestate was poured through the fabric to remove solid particles. The liquid digestate was stored before further use in the experiment in a laboratory freezer (Electrolux, model EC5231AOW, Jászberény, Hungary) at 4°C.
2.2 Methods
2.2.1 Materials’ analyses
All substrates used in the study were analyzed for total solids (TSs), volatile solid (VS) content, ash content (AC), volatile matter (VM), fixed carbon (FC), ultimate analysis (C, H, N, S, O), electrical conductivity (pH/EC ), specific surface area (SSA), total pore size (Vp), cation exchange capacities, and macro and micronutrients and trace elements (P, K, Fe, Co, Mo, Ni, Se, Na, W, Cu, Zn, Mn). The process residues (digestate) were analyzed for elemental composition and macro and micronutrients/trace elements. The used methods are described in the Supplementary Materials.
2.2.2 Anaerobic digestion process
The AD process was performed using the automatic methane potential test system (BPC Instruments AB, model AMPTS® II, Lund, Sweden). The system consists of 15 independent batch reactors with agitation placed in a water batch. The total volume of one rector is 0.5 dm3. Biogas produced during the AD goes to CO2 absorption units filled with 3 mol×L−1 NaOH solution and afterward to the gas volume meter system. The cleaned biogas (methane) was measured at 15-min intervals and was recorded automatically by the software. The AD process was performed at mesophilic conditions (37 °C), and the contents of the reactors were stirred for 2 min every hour. The AD experiment was divided into three trials. The trials were carried out one after the other, and each took 30 days. In each trial, 15 reactors were used. In each trial, other BC-type additions were tested. A trial consists of one reactor filled with inoculum; two reactors containing inoculum and BSG; and 13 reactors containing inoculum, BSG, and BC. In each trial, three substrate-to-inoculum ratios (SIRs) by volatile solids (0.5, 1.0, and 2.0) and, for each SIR, the four BC to BSG shares by total solids (2, 5, 10, and 50%) were tested. Because each reactor was filled with the same amount of wet inoculum (200 g), different SIRs were obtained by an increase in dry BSG load (∼3.3, ∼6.3, and ∼13.2 g). To obtain assumed BC-to-BSG shares, the amount of added BC varied from 0.07 to 6.60 g. For easier comparison of obtained results with other studies, the amount of added BC was recalculated on a mass of added BC per working volume of the reactor, and these values varied from 0.3 to 31 gBC×L−1. The mass of materials placed in specific reactors and the most commonly used parameters characterizing the batch of AD experiments are summarized in Table 1. During the AD process, the pH was measured at 4- to 5-day intervals. The pH was measured by opening the reactors and directly placing the measuring electrode (Elmetron, model CPC-411, Zabrze, Poland).
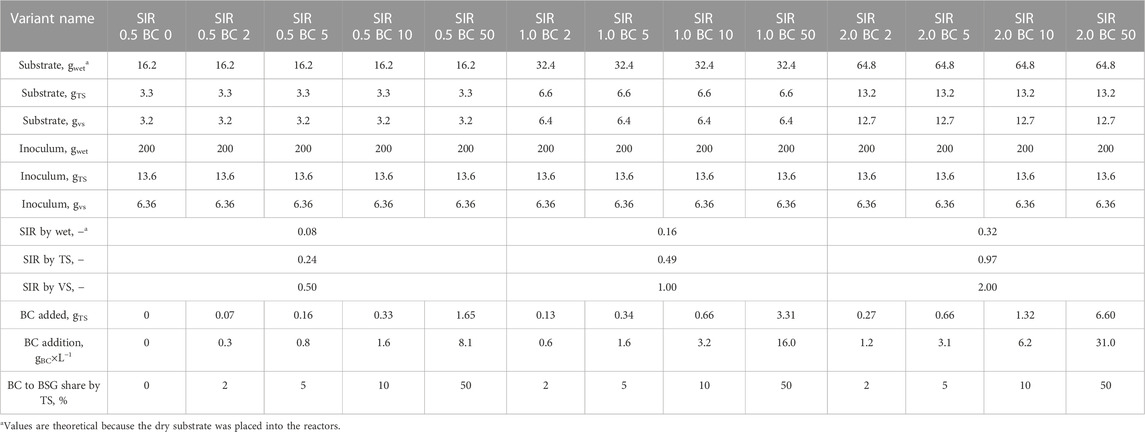
TABLE 1. Anaerobic digestion experiment matrix and reactors setup.
2.2.3 Process kinetics and substrate conversion efficiency determination
To statistically evaluate SIRs’ and BCs’ shared effects on biomethane production, the kinetics parameters were determined. The first-order kinetics model consisting of three parameters (ym, k, and r) was used. The kinetics parameters were determined from the AD cumulative biomethane production curves by the estimation method using Statistica software (TIBCO, version 13.0, Palo Alto, CA, United States). The data of cumulative biomethane production were fit to Eq. (1) for the determination of ym and k, and then, r was calculated using Eq. (2), (Dudek et al., 2019).
where
yt—experimental/predicted biomethane yield obtained after time t, mL×gVS−1,
ym—estimated maximum biomethane yield potential, ml×gVS−1,
k—biomethane production constant, d−1,
t—process time, d,
r—biomethane production rate, mL×gVS−1×d−1.
To statistically evaluate SIRs’ and BCs’ shared effects on process efficiency, the substrate conversion into biomethane (BD) was determined according to Eq. (3). To calculate BD, the theoretical maximal biochemical biomethane potential of BSG (yt) using elemental analysis was determined. The yt calculations were performed according to Boyle’s modification of the Buswell and Mueller stoichiometric formula (Eq. (4)) (Zhang, 2013).
where
CaHbOcNdSe—elemental composition of the substrate,
C—carbon,
H—hydrogen,
O—oxygen,
N–nitrogen,
S—sulfur,
a, b, c, d, and e stand for molar percentage share of specific elements contained in the volatile solids of the substrate,
yexp—experimental biomethane yield obtained after the AD process, mL×gVS−1,
yt—theoretical maximal biochemical biomethane potential, mL×gVS−1.
2.2.4 Statistical analyses
Kinetics parameters (ym, k, and r) and BD were subjected to the ANOVA at p < 0.05. To find out between which of the tested groups the statistically significant differences occurred, a post-hoc Tukey test was performed. The analyses were performed using Statistica software (TIBCO, version 13.0, Palo Alto, CA, United States).
3 Results
3.1 Substrate properties
All results of analyses performed for all materials are summarized in Supplementary Table SA2. The liquid digestate used as inoculum for the AD was characterized by an MC of 93.2% and VS of 46.9%, while raw BSG was characterized by an MC of 79.6% and VS of 96.2%. BCs had the content of VS varying in the range of 85.8%–94.4%. As a result of BSG pyrolysis and its decomposition, BC’s physical and chemical properties changed. BCs produced in this study had specific surface areas of 0.5, 3.3, and 291 m2×g−1 for BC300, BC450, and BC600, respectively. The total pore size of BCs increased to 0.001, 0.004, and 0.137 cm3×g−1, cation exchange capacities increased to 9, 14, and 32 cmol (+)×kg−1, and pH increased to 5.92, 6.03, and 7.85. For comparison, BSG and inoculum pH was 6.4 and 7.9, respectively. The specific surface area and pore size of BSG and inoculum were too small to be measured, and the procedure for CEC determination turned out to be unsuitable for those materials. BC electrical conductivity (EC) measured in a solid-to-water solution of 1:10 were 214, 223, and 332 μS×cm−1 for BC300, BC450, and BC600, respectively. Though an increase in the EC with pyrolysis temperature is visible, the pyrolysis resulted in an EC decrease since the pyrolyzed material had an EC of 718 μS×cm-1.
3.2 Anaerobic digestion process
There were no specific differences between the types of BC added and the AD performance. Therefore, the results of biomethane production of different BCs were combined according to SIR and BC share. This resulted in the reduction of variants for analysis and the simplification of data visualization. In Figures 1A–C, the total cumulative biomethane production from specific variants was summarized, with error bars showing standard deviations in measurements. The result of SIR 0.5 without the BC variant did not differ from SIR 0.5; BC2, therefore, was not included in Figure 1. The highest biomethane yield of 3776 ± 53 mL was obtained for the reactors containing the highest BSG loading (SIR 2.0), while the lowest of 1455 ± 13 mL was for the lowest loading (SIR 0.5). For SIR 1.0, the biomethane yield was 2365 ± 95 mL (Figure 1A). Interestingly, reactors with the highest BC share (BC 50) produced the highest amount of biomethane regardless of SIR. Moreover, an increase of BC shares from 2% to 50% resulted in a biomethane production increase of up to 1.8%, 10%, and 3.1% at SIR of 0.5, 1.0, and 2.0, respectively (Figure 1A). In Figure 1B, cumulative biomethane production per g of BSG’s volatile solid is presented to show the effect of SIR and BC share on VS to methane conversion, and as expected, the highest efficiency of VS conversion to methane of 325 ± 4 mL×gvs−1 was obtained at the lowest organic load (SIR 0.5). Biomethane yield for SIR 1.0 and 2.0 were 306 ± 15 mL×gvs−1 and 264 ± 4 mL×gvs−1, respectively (Figure 1B). Similar to the results presented in Figure 1A, the highest methane yield was obtained for BC 50 regardless of SIR, and a similar increase was observed between BC2 and BC50. Throughout the experiment, the pH changed in the range of 7.3–8.4 (Figure 1C). For each tested variant, the pH drop can be observed after one day. The drop intensity was affected mainly by SIR, and the highest drop was observed for SIR 2.0, while the lowest was for SIR 0.5. In the case of SIR 0.5 and 1.0, the initial pH turned back around day 5 and then started to increase gradually until gaining ∼8.3 at day 30. In the case of SIR 2.0, the initial pH was obtained around day 10. Then, gradual pH increase was noted until day 20 when pH stopped increasing until day 25, after which pH increase significantly accelerated, obtaining similar values as SIR 0.5 and 1.0 at day 30 (Figure 1C). Interestingly, the lowest pH was always measured for the highest BC share regardless of SIR.
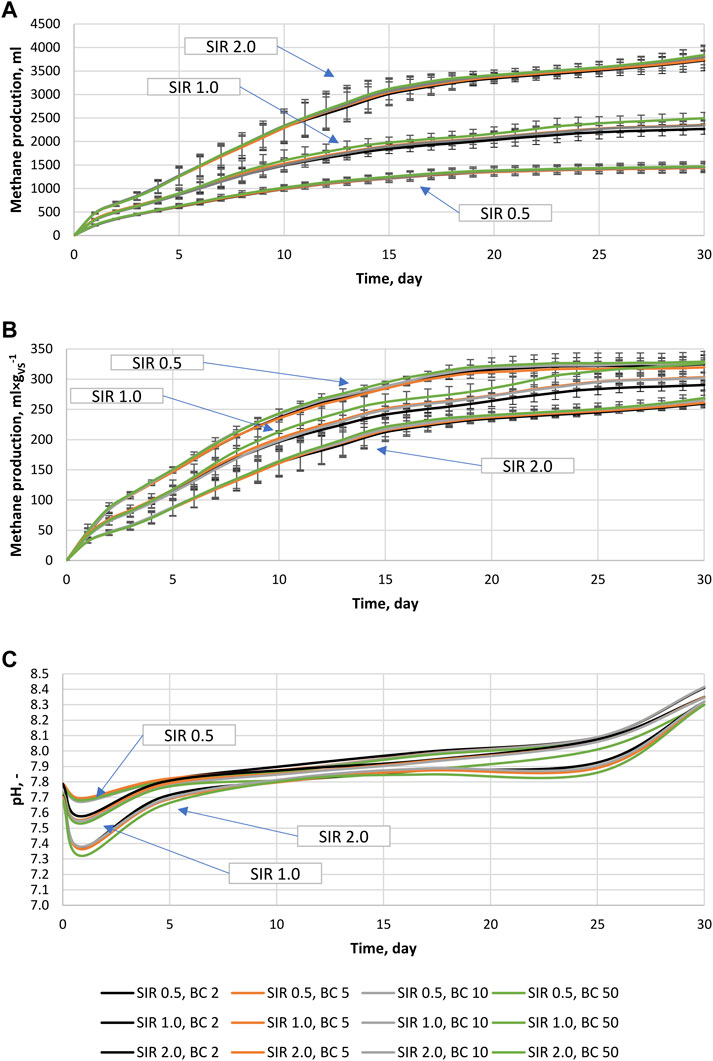
FIGURE 1. Anaerobic digestion process, (A) Cumulative biomethane production from specific reactors (including inoculum), (B) Cumulative biomethane production from BSG processed at different conditions (subtracted inoculum), (C) pH change during the anaerobic digestion process.
3.3 Process kinetics and substrate conversion efficiency
For a better description of SIRs’ and BCs’ shared effect on anaerobic digestion of BSG, the kinetic parameters (ymax, k, and r) and achieved conversion of substrate to methane (BD) are determined and summarized in Table 2. BC addition at specific SIR increased ymax and BD while lacking effect for k. Interesting results were obtained for r, which showed complex effects. At SIR of 0.5, the r values increased with increasing BC share from 39.2 ± 1.2 to 42.8 ± 0.2 mL×(gvs×d)−1; at SIR of 1.0, the r values decreased with increasing BC share from 31.0 ± 2.9 to 28.0 ± 4.8 mL×(gvs×d)−1, while at SIR of 2.0, the r values were stable (Table 2). The occurrence of increasing/decreasing trends with increasing BC shares is visible in the data; nevertheless, ANOVA revealed a lack of statistically significant differences (p < 0.05) between BC share variants at specific SIR, except BD at SIR 1.0. Though the values of ymax, k, and r do not differ significantly between BC shares at a given SIR, the values differ significantly between specific SIRs. Similar to the results presented in Figure 1, the mean value of ymax was the highest at the lowest organic loading and decreased with increasing SIR from 338.7 ± 12.6 mL×gvs−1 by 324.6 ± 18.7 mL×gvs−1 to 293.7 ± 18.2 mL×gvs−1 for SIR of 0.5, 1.0, and 2.0, respectively. In addition, increased organic loading decreased the constant of biomethane production from 0.12 ± 0.01 d−1 by 0.09 ± 0.01 d−1 to 0.08 ± 0.02 d−1 for SIR of 0.5, 1.0, and 2.0, respectively. Rising SIR also results in a decrease of the biomethane production rate that decreased from 41.9 ± 1.1 mL×(gvs×d)−1 by 30.2 ± 3.4 mL×(gvs×d)−1 to 24 ± 3.8 mL×(gvs×d)−1. The same trend was found for BD, which decreased from 64.3% ± 2.6% by 60.1% ± 3.0% to 52.4% ± 1.9% for SIR of 0.5, 1.0, and 2.0, respectively (Table 2). In summary, each kinetic parameter and efficiency of substrate conversion to methane (BD) decrease with increasing organic loading, and BC addition results in a small increase in ymax and BD at specific SIRs.

TABLE 2. Process kinetics and substrate conversion efficiency.
3.4 Process residues
The addition of BC to methane fermentation not only affects the process performance but also the quality of the produced digestate. The introduction of BC or any other process improver that will not be removed before the digestate discharge will result in its accumulation in digestate. The elemental composition of process residues (slurry) and concentration of micro and macro elements are summarized in Figure 2 and Table 3. In general, the mean value of C increased from 26.7% ± 3.7% to 31.2% ± 3.2%, while AC decreased from 51.9% ± 2.2% to 38.1% ± 3.5% for SIR of 0.5 and 2.0, respectively. The O content increased with BSG content increasing from 13.6% ± 1.9% by 16.8% ± .6% to 22.4% ± 3.5% for SIRs of 0.5, 1.0, and 2.0, respectively. There were no significant changes in the content of H, N, and S that differ in the range of 2.6–2.9%, 3.3%–3.8%, and 1.9%–1.6%, respectively, regardless of tested SIRs (Figure 2). The concentration of P, K, Fe, and Na in process residues exceeded the upper measured limit while the concentration of Se and W were below the lower detection limit. The exceeding of upper limit is mainly due to the high concentration of mentioned elements in the inoculum (Table 3). The concentration of Co, Ni, Cu, Zn, and Mn decreased with the increasing BSG content (SIR) and BC share (Table 3). The mean value of Co decreased from 2.9 ± 0.3 by 2.72.9 ± 0.1 to 1.9 ± 0.3 mg×kg−1 for SIR 0.5, 1.0, and 2.0, respectively. For the same SIRs, the Ni concentration was 12.6 ± 0.6, 9.9 ± 3.6, and 8.6 ± 1.0 mg×kg−1, while the concentration of Cu was 48.8 ± 2.1, 45.6 ± 3.4, and 37.0 ± 2.4 mg×kg−1. Interesting and complex results were obtained for Mo, Zn, and Mn for which concentration was the highest at SIR of 1.0 and the lowest at 2.0.
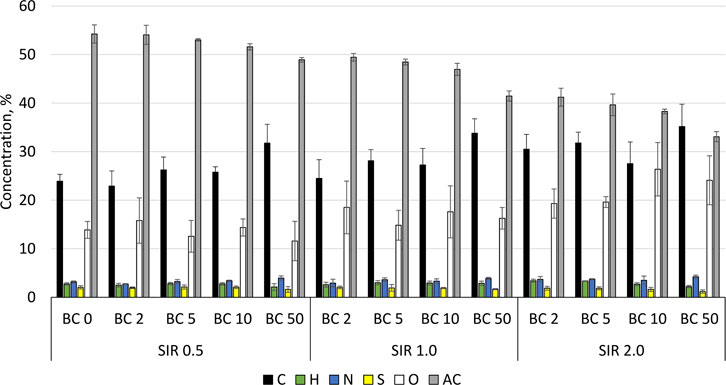
FIGURE 2. Elemental composition of process residues, as dry basis.
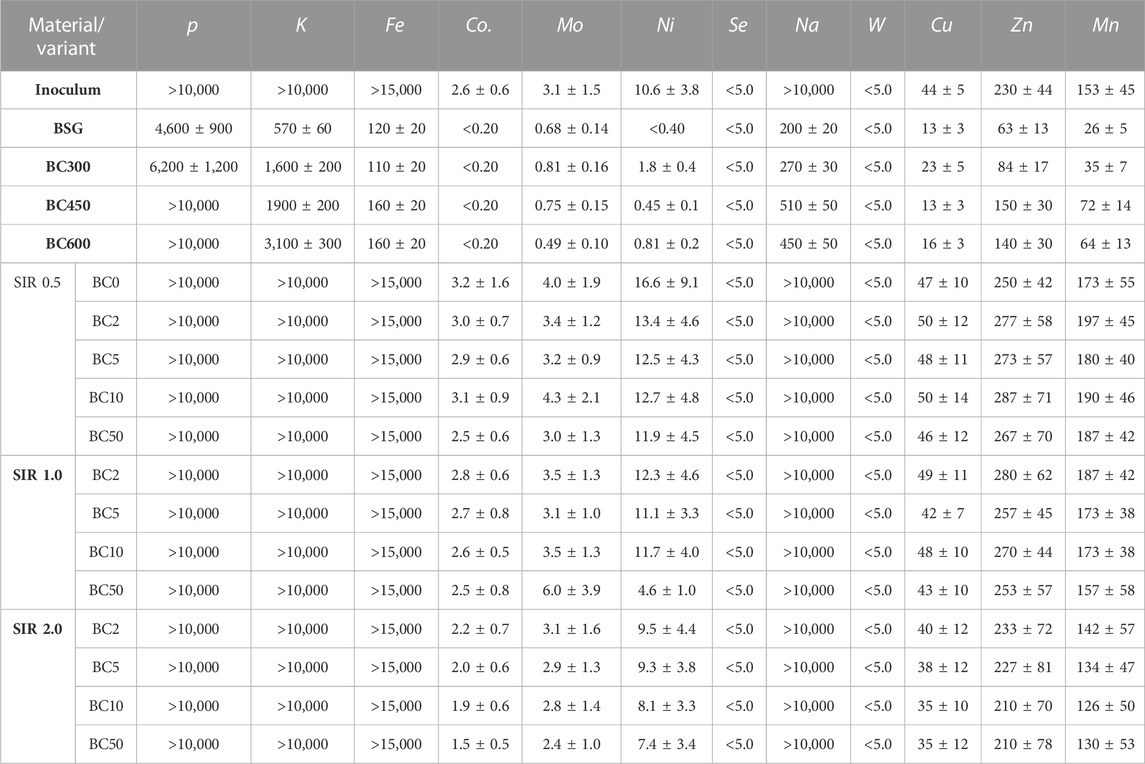
TABLE 3. Macro- and micronutrients and trace elements in substrate and process residues, values are given in mg×kg−1 as a dry basis.
4 Discussion
Substrates used in this research had properties similar to those that can be found in the literature (Mainardis et al., 2019; Zeko-Pivač et al., 2022). The pyrolysis temperature is one of the most important parameters (excluding feedstock type) affecting the quality of the produced BC (Zhao et al., 2021). Results showed that all essential BC properties were improved with increasing temperature. BC600 showed the highest specific surface area, pore size, CEC, and the most alkaline pH. Therefore, it was initially assumed that BC600 is the best for AD improvement. It is because the higher the SSA and pore size, the more space is available for the AD microorganism to grow and the better the efficiency of inhibitors’ adsorption (Yargicoglu and Reddy, 2017). The higher the CEC, the better the transfer of electrons between the species of microorganisms, and the higher the pH and buffer capacity, the more stable the AD due to the reduction of acidification (Cruz Viggi et al., 2017). Nevertheless, there were no specific differences in the AD performance between used BCs at specific SIRs. For that reason, it was concluded that in the case of tested materials, BC share and AD conditions (SIR) were more crucial than the specific properties of BC. It is probably because process conditions affect microorganisms more than specific BC properties. In this research, increasing loading resulted in more biomethane production from the specific reactor, but the yield obtained per unit of organic matter contained in the reactor decreased from 325 to 264 mL×gvs−1 (Figure 1). Obtained results are similar to those that can be found in other studies. Depending on initial conditions and specific characteristics of BSG, Oliveira et al. (2018) obtained 271–387 mLCH4×gVS−1, while Gomes et al. (2021) obtained 81–290 mLCH4×gVS−1. In the work of Gomes et al. (2021), different BSG loading and process temperatures (31 °C–59 °C) were tested over 21 days. Interestingly, the highest methane yield was obtained at 35°C and a BSG concentration of 10 g×L−1 (Gomes et al., 2021). In the performed research, BC addition improved methane yield regardless of initial conditions (SIR), but the improvement was not high (1.8%, 10%, and 3.1% at SIR of 0.5, 1.0, and 2.0) and did not reveal simple dependency between the amount of BC share and its effect on the AD process (Figure 1; Table 2). For comparison, Cai et al. (2016) studied the effects of different organic loads (SIR of 0.5, 1.0, and 1.25) and BC doses (0, 2, 5, and 10 gBC×L−1) on batch AD of food waste and sludge. The increase in organic load decreased cumulative methane production per unit of processed substrate, but BC addition improved its production at specific organic loading. It was observed that the higher the SIR, the bigger the improvement in methane production due to the presence of BC. Cai et al. (2016) concluded that the efficiency of BC depended on the amount of BC added and the amount relative to the amount of used inoculum (Cai et al., 2016). Similar results and conclusions were obtained by Ambaye et al. (2020) who studied the effects of two BCs’ addition at four doses (1.25, 2.5, 3.75, and 5.0 gBC×L−1) at SIRs of 0.5, 0.67, and 1.0 during mesophilic AD of fruit waste mixed with sewage sludge. The BCs were made at 350 °C and 550 °C, and the AD process took 50 h. Interestingly, in most cases, the lower-temperature BC showed higher methane production concerning control and higher-temperature BC, but for both, BC overdosing resulted in inhibition of the dissolved organics degradation rate (Ambaye et al., 2020). In addition, no clear dependence between BC dose and its effect was observed since different dosing showed different methane yield improvements at specific SIRs (Ambaye et al., 2020). Dudek et al. (2019) added BC made at 300°C from BSG at a share of 1%–50% by TS of BSG in a process of 21 days, while Mainardis et al. (2019) added BC made from red spruce woodchips at 650°C in the quantity of 0.2 gBC×gVS−1 of BSG in process of 19 days. Both studies show complex results. In the case of Dudek, the biogas yield differed from 61.3 to 122.0 mL×gVS−1 (control without BC, 92.3 mL×gVS−1), and the best results were obtained for 5% BC share, while the worst one at BC shares over 20% by TS of BSG. In the case of Mainardis, two types of BSG were tested (BSG1 and BSG2) at the same conditions, and different results were obtained. In the case of BSG1, BC addition resulted in a methane production decrease of 5%, while in the case of BSG2, the BC addition prevented AD collapse (resulted from acidification) after 7 days and increased total methane yield by 26.6% (Mainardis et al., 2019). Such contrary and ambiguous effects show that in some specific cases, BC may help to improve AD, while others inhibit it. The reason for that may be the quality of used substrates, BC, and AD conditions themselves. Looking at the results, it can be concluded that when the AD process is performed at optimal conditions, BC cannot improve AD performance much, but when AD is overloaded, it can prevent the process from collapsing and significantly increase methane yield. Similar findings can be found in the work of Masebinu et al. (2021), where the effects of BC supplementation (0.25 and 0.50 gBC×gvs−1) to the digester operated at 45°C and feed with cattle slurry and corn straw were studied. The results showed that for a well-balanced reactor, BC cannot provide operational advantages since no significant changes in microbial community composition, biogas composition, biogas yield, and process stability indicators were found. It was also concluded that more research on BC’s effects on unbalanced digestion systems is needed (Masebinu et al., 2021). In performed research, different organic loading of BSG was tested (SIR 0.5–2.0), and it was expected that the alkaline nature of the BC will increase pH and process stability. Nevertheless, none of the tested loadings resulted in digester overloading, and the pH differed from 7.3 to 8.4 (Figure 1), thus far from the harmful ranges considered for AD microorganisms. The optimal pH range for a one-stage AD process is considered to be 7–8, though each microorganism type has its optimal range (Drosg, 2013). The fermentative bacteria can live at a pH of 4–8.5 with an optimum of 5–6, while methane-producing archaea can live at 5.5–8.0, with an optimum of 6.5–8.0 (Lohani and Havukainen, 2018). As a result, most of the time, the methane-producing microorganism was favored by the environment in this experiment. Also, due to the fact that the pH drop was not lower than 5.0–5.5, the higher organic loading should be tested. Perhaps then BC could show mitigation of ammonia inhibition and acidification related to volatile fatty acids accumulation, improving process stability, and increasing methane yield (Mumme et al., 2014; Ambaye et al., 2020).
Generally, digestate from the agricultural biogas plant is considered to have good fertilizer properties. Also, the digestate from the AD of brewery wastewater was found to be suitable for land application (Akunna, 2015). The quality of digestate varies significantly between biogas plants, used technology, substrate, and post-treatment methods. The most important macronutrients (N, P, K) may vary in broad ranges, 24,597–204,984 mg×kgTS−1; 8,433–55,405 mg×kgTS−1; and 119–81,028 mg×kgTS−1, respectively (Pivato et al., 2016; Ehmann et al., 2018; Lee et al., 2021; Czekała et al., 2022). The quality of process residues (digestate) depends on the quality of the used substrate and process performance. It is important to note that due to the specifics of the conducted experiment (batch reactors), the main factor affecting the quality of obtained digestate was the quality of the used inoculum and its quantity. Considering the quantitative abundance of particular components in the experiment, the second most influencing parameters were the quality of used BSG, its concentration, and BC share. Apart from an initial concentration of specific elements in a feedstock, the final elemental composition depends on obtained biodegradation of substrate and its conversion to biogas. Biogas mainly consists of CH4, CO2, H2O, NH3, and H2S (Li et al., 2019). Depending on process conditions and processed substrate, the methane concentration may differ from 40% to 75%; carbon dioxide, from 15% to 60%; water vapor, from 1% to 5%; and other gases, below 1% (Bharathiraja et al., 2018). As a result, residual biomass left in the reactor (digestate) is characterized by lower organic content (volatile solids) and higher ash content concerning feedstock. On the other hand in batch reactors, micro- and macronutrients and trace elements are likely to stay in the reactor as inorganic minerals, dissolved in digestate, or built into the microorganism biomass (Javed et al., 2020). Therefore, it can be assumed that the final concentration of micro- and macronutrients in a non-continuous AD process is equal to nutrients placed into the reactor with feedstock.
5 Conclusion
The results showed that the most important factor affecting both biomethane yield and digestate quality was SIR, while BC share was of secondary importance. Depending on SIR, the obtained biomethane yield differed significantly from 264 to 325 mL×gvs−1, while an increase in BC share from 2% to 50% concerning specific SIRs result in biomethane production improvement from 1.8% to 10%. Though BC affected the quantity of produced biomethane, no statistically significant differences (p < 0.05) were found between the kinetics parameters of different BC shares at specific SIRs, proving that BC supplementation did not affect the rate of biomethane production. The process residues were mainly affected by the used inoculum and BSG concentrations, while BC addition mainly increased elemental carbon and decreased ash content. In summary, the results showed that BC addition effects not only depend on BC properties and their quantity added but also on the AD operational parameters and quality and properties of feedstock (inoculum and substrate). This research proved that just adding BC to the AD is not enough to understand its effect on an AD of a specific substrate, and wider scope of research (taking into account feedstock properties and operational conditions) is needed. For a better understanding of the BC effect on overloaded digesters, higher SIR needs to be tested with similar BC shares. Also, there is a need for research to be performed in the continuous mode for a long time to check BC influence over time. There is a probability that batch tests cannot reveal all effects in the 30-day process.
Data availability statement
The original contributions presented in the study are included in the article/Supplementary Material; further inquiries can be directed to the corresponding author.
Author contributions
Conceptualization, KŚ; methodology, KŚ; software, KŚ and ES; validation, KŚ; formal analysis, WR, ES, and KŚ; investigation, WR, KŚ, and ES; resources, KŚ; data curation, KŚ; writing—original draft preparation, KŚ, WR, and ES; writing—review and editing, KŚ, WR, and ES; visualization, KŚ and ES; supervision, KŚ; project administration, KŚ; and funding acquisition, KŚ. All authors have read and agreed to the published version of the manuscript.
Funding
The research was funded by the National Science Centre, Poland, project number 2019/35/N/ST8/02498.
Conflict of interest
The authors declare that the research was conducted in the absence of any commercial or financial relationships that could be construed as a potential conflict of interest.
Publisher’s note
All claims expressed in this article are solely those of the authors and do not necessarily represent those of their affiliated organizations, or those of the publisher, the editors, and the reviewers. Any product that may be evaluated in this article, or claim that may be made by its manufacturer, is not guaranteed or endorsed by the publisher.
Supplementary material
The Supplementary Material for this article can be found online at: https://www.frontiersin.org/articles/10.3389/fenrg.2023.1141684/full#supplementary-material
References
Akunna, J. C. (2015). “Anaerobic treatment of brewery wastes,” in Brewing microbiology (Netherlands: Elsevier).
Aliyu, S., and Bala, M. (2010). Brewer’s spent grain: A review of its potentials and applications. Afr. J. Biotechnol. 10, 324–331. doi:10.5897/AJBx10.006
Ambaye, T. G., Rene, E. R., Dupont, C., Wongrod, S., and van Hullebusch, E. D. (2020). Anaerobic digestion of fruit waste mixed with sewage sludge digestate biochar: Influence on biomethane production. Front. Energy Res. 8, 31. doi:10.3389/fenrg.2020.00031
Amienyo, D., and Azapagic, A. (2016). Life cycle environmental impacts and costs of beer production and consumption in the UK. Int. J. Life Cycle Assess. 21, 492–509. doi:10.1007/s11367-016-1028-6
Bharathiraja, B., Sudharsana, T., Jayamuthunagai, J., Praveenkumar, R., Chozhavendhan, S., and Iyyappan, J. (2018). Retracted: Biogas production–A review on composition, fuel properties, feed stock and principles of anaerobic digestion. Renew. Sustain. Energy Rev. 90, 570–582. doi:10.1016/j.rser.2018.03.093
Cai, J., He, P., Wang, Y., Shao, L., and Lü, F. (2016). Effects and optimization of the use of biochar in anaerobic digestion of food wastes. Waste Manag. Res. J. a Sustain. Circular Econ. 34, 409–416. doi:10.1177/0734242X16634196
Camia, A., and Robert, N. (2018). Biomass production, supply, uses and flows in the European Union. Europe: European Commission.
Čater, M., Fanedl, L., Malovrh, Š., and Marinšek Logar, R. (2015). Biogas production from brewery spent grain enhanced by bioaugmentation with hydrolytic anaerobic bacteria. Bioresour. Technol. 186, 261–269. doi:10.1016/j.biortech.2015.03.029
Chen, L., Fang, W., Chang, J., Liang, J., Zhang, P., and Zhang, G. (2022). Improvement of direct interspecies electron transfer via adding conductive materials in anaerobic digestion: Mechanisms, performances, and challenges. Front. Microbiol. 13, 860749. doi:10.3389/fmicb.2022.860749
Cheri, C., Crandall, S., del Grande, D., Flores, T., Gilliland, M., Horwitz, L., et al. (2005). Energy usage, GHG reduction, effi ciency and load management manual.
Conway, J. (2022). Global leading in beer production China was the leading producer of beer in terms of production volume in 2021. In that year, around 359. 74 million hectoliters of beer were brewed in China the United States was the second leading producer of beer in. 44.
Cruz Viggi, C., Simonetti, S., Palma, E., Pagliaccia, P., Braguglia, C., Fazi, S., et al. (2017). Enhancing methane production from food waste fermentate using biochar: The added value of electrochemical testing in pre-selecting the most effective type of biochar. Biotechnol. Biofuels 10, 303. doi:10.1186/s13068-017-0994-7
Czekała, W., Jasiński, T., Grzelak, M., Witaszek, K., and Dach, J. (2022). Biogas plant operation: Digestate as the valuable product. Energies 15, 8275. doi:10.3390/en15218275
Dudek, Ś., Świechowski, K., Manczarski, K., and Koziel, J. A. (2019). The effect of biochar addition on the biogas production kinetics from the anaerobic digestion of brewers’ spent grain. Energies 12, 1518. doi:10.3390/en12081518
Ehmann, A., Thumm, U., and Lewandowski, I. (2018). Fertilizing potential of separated biogas digestates in annual and perennial biomass production systems. Front. Sustain Food Syst. 2. doi:10.3389/fsufs.2018.00012
Gahlot, P., Ahmed, B., Tiwari, S. B., Aryal, N., Khursheed, A., Kazmi, A. A., et al. (2020). Conductive material engineered direct interspecies electron transfer (DIET) in anaerobic digestion: Mechanism and application. Environ. Technol. Innov. 20, 101056. doi:10.1016/j.eti.2020.101056
Gomes, M. M., Sakamoto, I. K., Silva Rabelo, C. A. B., Silva, E. L., and Varesche, M. B. A. (2021). Statistical optimization of methane production from brewery spent grain: Interaction effects of temperature and substrate concentration. J. Environ. Manage 288, 112363. doi:10.1016/j.jenvman.2021.112363
González-García, S., Morales, P. C., and Gullón, B. (2018). Estimating the environmental impacts of a brewery waste–based biorefinery: Bio-ethanol and xylooligosaccharides joint production case study. Ind. Crops Prod. 123, 331–340. doi:10.1016/j.indcrop.2018.07.003
Hao, L., Michaelsen, T. Y., Singleton, C. M., Dottorini, G., Kirkegaard, R. H., Albertsen, M., et al. (2020). Novel syntrophic bacteria in full-scale anaerobic digesters revealed by genome-centric metatranscriptomics. ISME J. 14, 906–918. doi:10.1038/s41396-019-0571-0
Javed, M. B., Cuss, C. W., and Shotyk, W. (2020). Dissolved versus particulate forms of trace elements in the Athabasca River, upstream and downstream of bitumen mines and upgraders. Appl. Geochem. 122, 104706. doi:10.1016/j.apgeochem.2020.104706
Lee, M.-S., Urgun-Demirtas, M., Shen, Y., Zumpf, C., Anderson, E. K., Rayburn, A. L., et al. (2021). Effect of digestate and digestate supplemented with biochar on switchgrass growth and chemical composition. Biomass Bioenergy 144, 105928. doi:10.1016/j.biombioe.2020.105928
Li, Y., Alaimo, C. P., Kim, M., Kado, N. Y., Peppers, J., Xue, J., et al. (2019). Composition and toxicity of biogas produced from different feedstocks in California. Environ. Sci. Technol. 53, 11569–11579. doi:10.1021/acs.est.9b03003
Li, Y., Qiu, Q., He, X., and Li, J. (2011). “Energy use project and conversion efficiency analysis on biogas produced in breweries,” in Proceedings of the World Renewable Energy Congress – Sweden, Linköping, Sweden, 8–13 May, 2011.
Liu, F., Rotaru, A.-E., Shrestha, P. M., Malvankar, N. S., Nevin, K. P., and Lovley, D. R. (2012). Promoting direct interspecies electron transfer with activated carbon. Energy Environ. Sci. 5, 8982. doi:10.1039/c2ee22459c
Lohani, S. P., and Havukainen, J. (2018). “Anaerobic digestion: Factors affecting anaerobic digestion process,” in Energy, environment, and sustainability (Germany: Springer Nature).
Lorenz, H., Fischer, P., Schumacher, B., and Adler, P. (2013). Current EU-27 technical potential of organic waste streams for biogas and energy production. Waste Manag. 33, 2434–2448. doi:10.1016/j.wasman.2013.06.018
Mainardis, M., Flaibani, S., Mazzolini, F., Peressotti, A., and Goi, D. (2019). Techno-economic analysis of anaerobic digestion implementation in small Italian breweries and evaluation of biochar and granular activated carbon addition effect on methane yield. J. Environ. Chem. Eng. 7, 103184. doi:10.1016/j.jece.2019.103184
Masebinu, S. O., Fanoro, O. T., Insam, H., Mbohwa, C., Wagner, A. O., Markt, R., et al. (2021). Can the addition of biochar improve the performance of biogas digesters operated at 45°C? Environ. Eng. Res. 27, 200648. doi:10.4491/eer.2020.648
Miller, K. E., Herman, T., Philipinanto, D. A., and Davis, S. C. (2021). Anaerobic digestion of food waste, brewery waste, and agricultural residues in an off-grid continuous reactor. Sustain. Switz. 13, 6509. doi:10.3390/su13126509
Mumme, J., Srocke, F., Heeg, K., and Werner, M. (2014). Use of biochars in anaerobic digestion. Bioresour. Technol. 164, 189–197. doi:10.1016/j.biortech.2014.05.008
Olajire, A. A. (2020). The brewing industry and environmental challenges. J. Clean. Prod. 256, 102817–102821. doi:10.1016/j.jclepro.2012.03.003
Oliveira, J. V., Alves, M. M., and Costa, J. C. (2018). Biochemical methane potential of brewery by-products. Clean. Technol. Environ. Policy 20, 435–440. doi:10.1007/s10098-017-1482-2
Pivato, A., Vanin, S., Raga, R., Lavagnolo, M. C., Barausse, A., Rieple, A., et al. (2016). Use of digestate from a decentralized on-farm biogas plant as fertilizer in soils: An ecotoxicological study for future indicators in risk and life cycle assessment. Waste Manag. 49, 378–389. doi:10.1016/j.wasman.2015.12.009
Report (2022). Beer market size, share and COVID-19 impact analysis, by type (lager, ale, stouts, and others), packaging (glass bottle and metal can), distribution channel (On-trade and off-trade), and regional forecast. 2028. 1–7.
Shin, R., and Searcy, C. (2018). Evaluating the greenhouse gas emissions in the craft beer industry: An assessment of challenges and benefits of greenhouse gas accounting. Sustain. Switz. 10, 4191–4230. doi:10.3390/su10114191
Świechowski, K., Liszewski, M., Bąbelewski, P., Koziel, J., and Białowiec, A. (2019). Fuel properties of torrefied biomass from pruning of oxytree. Data (Basel) 4, 55. doi:10.3390/data4020055
Świechowski, K., Syguła, E., Rasaq, W. A., Gasinski, A., and Łyczko, J. (2022). “Anaerobic digestion of brewers’ spent grain with biochar-biogas production kinetics and process efficiency,” in 9th International Symposium on Energy from Biomass and Waste, Hotel Monaco and Grand Canal, Venice, Italy, 23 November 2022.
Syguła, E., Gałęzowska, M., and Białowiec, A. (2022). Enhanced production of biogas using biochar–sulfur composite in the methane fermentation process. Materials 15, 4517. doi:10.3390/ma15134517
Wu, Y., Wang, S., Liang, D., and Li, N. (2020). Conductive materials in anaerobic digestion: From mechanism to application. Bioresour. Technol. 298, 122403. doi:10.1016/j.biortech.2019.122403
Yargicoglu, E. N., and Reddy, K. R. (2017). Effects of biochar and wood pellets amendments added to landfill cover soil on microbial methane oxidation: A laboratory column study. J. Environ. Manage 193, 19–31. doi:10.1016/j.jenvman.2017.01.068
Zeko-Pivač, A., Tišma, M., Žnidaršič-Plazl, P., Kulisic, B., Sakellaris, G., Hao, J., et al. (2022). The potential of brewer’s spent grain in the circular bioeconomy: State of the art and future perspectives. Front. Bioeng. Biotechnol. 10, 870744. doi:10.3389/fbioe.2022.870744
Zhang, Y. (2013). Anaerobic digestion fundamentals II Thermodynamics. Jyväskylä Available at: http://www.valorgas.soton.ac.uk/Pub_docs/JyU%20SS%202013/VALORGAS_JyU_2013_Lecture%202.pdf (Accessed October 26, 2021).
Keywords: brewer’s spent grain, methane fermentation, biomethane production kinetics, digestate quality, fertilizer, pyrolysis, biochar, biogas
Citation: Świechowski K, Rasaq WA and Syguła E (2023) Anaerobic digestion of brewer’s spent grain with biochars—biomethane production and digestate quality effects. Front. Energy Res. 11:1141684. doi: 10.3389/fenrg.2023.1141684
Received: 10 January 2023; Accepted: 09 March 2023;
Published: 24 March 2023.
Edited by:
Vivekanand Vivekanand, Malaviya National Institute of Technology, IndiaReviewed by:
Shunli Wang, Institute of Environment and Sustainable Development in Agriculture, Chinese Academy of Agricultural Sciences (CAAS), ChinaNabin Aryal, University of South-Eastern Norway (USN), Norway
Copyright © 2023 Świechowski, Rasaq and Syguła. This is an open-access article distributed under the terms of the Creative Commons Attribution License (CC BY). The use, distribution or reproduction in other forums is permitted, provided the original author(s) and the copyright owner(s) are credited and that the original publication in this journal is cited, in accordance with accepted academic practice. No use, distribution or reproduction is permitted which does not comply with these terms.
*Correspondence: Kacper Świechowski, a2FjcGVyLnN3aWVjaG93c2tpQHVwd3IuZWR1LnBs