 Merija K. S.
 N. Angeline Little Flower
- Department of Physics and Nanotechnology, SRM Institute of Science and Technology, Kattankulathur, Tamilnadu, India
Hexavalent chromium is one of the most hazardous contaminants that threaten the environment. The present research work involves the synthesis of Graphene Oxide/Zinc molybdate (GO/ZM) nanocomposite by wet chemical route. The structure and morphology of the synthesized samples were analysed by various characterization techniques such as X-Ray Diffraction (XRD), Fourier Transform Infrared Spectroscopy (FTIR), UV-Vis Spectroscopy, and High-Resolution Transmission Electron Microscopy (HR-TEM), Brunauer-Emmett-Teller (BET) surface area analysis, Barrett-Joyner-Halenda (BJH) pore size analysis and Raman Spectroscopy. The efficiency of the prepared samples for removing hexavalent chromium from the water was investigated by performing batch adsorption studies. The maximum adsorption capacity was optimum at using 6 mg adsorbent, under conditions pH 2 with contact time for 120 min and temperature 283 K. Two isotherm models and two kinetic models were used to study the adsorption mechanism of Cr(VI) ions adsorption on the surface of GO/ZM nanocomposite. The results of isotherm and kinetic modelling shows that the adsorption of Cr(VI) using GO/ZM nanocomposite was well described by Freundlich Isotherm model with higher correlation coefficient (R2 = .985) and follows pseudo second order kinetic model.
1 Introduction
A proper water treatment process is inevitable for sustainable living and a healthy environment. Therefore, it is vital to develop an innovative and advanced system for water purification with low energy consumption, high efficiency, and cost-effectiveness. Among the various contaminants which pollute the water bodies, heavy metals are considered more toxic and life-threatening. Chromium is one of the most hazardous heavy metal pollutants which can cause serious threat to the environment. It is considered to be highly toxic and poisonous, which has mutagenic and carcinogenic effects on animals, plants, humans, and microbes (Mishra and Bharagava, 2016). Chromium exists in two stable oxidation states as trivalent Cr (III) and hexavalent Cr (VI) in which Cr (VI) is found to have an extremely high toxicity. Also, Cr (VI) shows very high mobility that it is easily transported via soil and water (Karthik and Meenakshi, 2014). Several industries use chromium for a variety of applications and discharge a large quantity into the environment, including tanneries, paints, pigments, electroplating, metal processing, wood preservatives, textile, dye, steel fabrication, and canning factories (Ali et al., 2016). Biological amplification of Cr (VI) in the food chain increases the chances of Cr (VI) toxicity in humans that when it enters an organism it is reduced by proteins or intracellular antioxidants to chromium (III), which then interacts with DNA or proteins, resulting in adverse toxic effects such as degenerative diseases and cancers (Buters and Biedermann, 2017; Chen et al., 2018).
There are several methods for the removal of chromium from the solution which include methods such as ultra-filtration techniques, electrocoagulation (Hamdan and El-Naas, 2014), reverse osmosis, photocatalysis, and adsorption (Enniya et al., 2018). In contrast to other techniques, adsorption is widely used because of its high effectiveness, simplicity, ease of operation, and relative affordability (Avila et al., 2014). A variety of adsorption methods have been developed for the adsorption of Cr (VI) ions which includes biomaterials, zeolites (Neolaka et al., 2017), activated carbon (Enniya et al., 2018), and clay minerals (Shaban et al., 2018).
Nanostructured material-based adsorbents are now gaining more attention than conventional adsorbents because they have a large number of active sides, high specific surface area, superior thermal and mechanical stability, and low intra-particle diffusion resistance and are easy to modify or functionalize (Herrero-Latorre et al., 2018; Liu et al., 2019a). In the present work among various materials, graphene oxide incorporated with zinc molybdate nanoparticles is used as a nano-adsorbent for the removal of Cr (VI) ions from water. Graphene oxide is the oxidized form of graphite with the presence of atomic layers of sp2-hybridized carbon atoms arranged in a hexagonal structure. Due to its planar sheet-like morphology, it has an extensive specific surface area and high adsorption capacity, providing both sides for active adsorption (Thangavel and Venugopal, 2014). However, in some cases, the adsorption capacity of graphene materials may reduce since they tend to form aggregates due to Van der Waals forces and π-π interactions between the planar sheets. Graphene oxide is a monolayer material with several oxygen-containing functional groups such as epoxy, carboxyl, and hydroxy groups, making it an excellent adsorbent for heavy metal ions. The oxygen-containing functional groups are eliminated when GO is reduced, which decreases the adsorption of heavy metal ions (Gao et al., 2011). There has not been much exploration into removing metal ions using graphene oxide compared to the other carbon adsorbents. The development of GO based nanocomposite would be a promising material for improving the effectiveness of removal of contaminants through the adsorption process. In the present study the ability of zinc molybdate (ZnMoO4) nanoparticles to enhance the adsorption properties of GO has been investigated. ZnMoO4 was reported to be an efficient nano adsorbent for removing methylene blue dye via the adsorption technique. Thus the adsorption properties of GO and ZnMoO4 can be combined together to develop a more efficient adsorbent for the removal of chromium metal ions (Oudghiri-Hassani et al., 2018).
Though the as prepared graphene oxide/zinc molybdate nanocomposite is already used for battery and supercapacitor applications, the adsorption capacity of the nanocomposite is not yet investigated for the removal of hexavalent chromium from water. In this paper, we report the facile synthesis of economically viable novel adsorbent GO/ZM nanocomposite which can eliminate Cr (VI) metal ions from aqueous solutions having different characteristics. It is performed through a batch adsorption study by varying initial concentration, pH, contact time, adsorbent dosage, and temperature. We also report the kinetic and isotherm studies to observe the adsorption behaviour of GO/ZM nanocomposite.
2 Materials and methods
2.1 Reagents and materials
Fine graphite powder (98%) was supplied from Loba Chemie Pvt. Ltd. Sulfuric acid (H2SO4), potassium permanganate (KMnO4), hydrogen peroxide (H2O2) solution 30%, zinc acetate dihydrate (Zn(CH3CO2)2·2H2O) and sodium molybdate dihydrate (Na2MoO4) were purchased from Sisco research laboratories Pvt. Ltd.
2.2 Synthesis of graphene oxide
Graphene oxide was synthesized using Hummer’s method. A total of 2 g of fine graphite powder was mixed with 2 g of sodium nitrate and dissolved in 50 ml of sulphuric acid by continuous stirring under an ice bath maintained in the temperature range 0–5°C. Potassium permanganate was added to the mixture very slowly to prevent an excessive rise in temperature. Then the mixture was continuously stirred for 2–3 days until a thick brown paste-like consistency is obtained. Further, we add distilled water dropwise to the mixture, and the temperature rises above 80°C. More distilled water is added until we obtain a uniform-coloured brown diluted solution. Finally, hydrogen peroxide (H2O2) is added to terminate the reaction, and the colour of the solution gets changed to yellowish-green colour. The solution was kept for ageing and then washed several times using hydrochloric acid and distilled water until it becomes neutral. The obtained mixture is then dried at a temperature of 80°C (Hou et al., 2020).
2.3 Synthesis of zinc molybdate
Zinc Molybdate nanoparticles were synthesized via the co-precipitation method. 0.3 M Sodium Molybdate solution was added dropwise to 0.3 M zinc acetate solution. The mixture was then continuously stirred for 1 h until a white precipitate is formed. Now the suspension was centrifuged with ethanol and distilled water and then the precipitate is dried in a hot air oven at 60°C for 4 h. The sample was annealed at 400°C in a muffle furnace (Jia et al., 2013).
2.4 Synthesis of graphene oxide/zinc molybdate nanocomposite
0.1 g of graphene oxide in 10 ml ethanol was ultrasonicated for 1 h to disperse it uniformly in the solution. ZnMoO4 nanoparticles were added to the dispersed GO solution. The mixture was ultrasonicated again for 1 h at room temperature to obtain a homogeneous solution and then kept for ageing for a few hours. Later it was centrifuged with distilled water and dried at 60°C for 4 h (Rodríguez et al., 2020).
2.5 Characterization techniques
The crystallinity, particle size, and phase structure of graphene oxide (GO), zinc molybdate (ZM) and GO/ZM nanocomposite were investigated by X-ray diffraction (XRD) by BRUKER United States D8 Advance, Davinci. The morphology of the as-prepared samples was characterized by a High-resolution transmission electron microscope (HRTEM: JEOL Japan). The absorbance of the samples was measured using UV-Vis Spectrometer. The values of specific surface area and pore size distribution were evaluated by Brunauer–Emmett–Teller (BET) and Barrett-Joyner-Halenda (BJH) methods respectively using Quanta chrome Instruments, Autosorb IQ series Nitrogen adsorption/desorption analyzer. The functional groups of the material were studied using Fourier transform infrared spectroscopy (FT-IR). To examine the chemical composition and lattice parameters of graphene oxide Raman spectroscopy was used.
2.6 Adsorption studies
The adsorption process has to be optimized through a batch study to determine the ideal condition for the adsorption of Cr (VI) on the surface of GO/ZM to occur. A stock solution (60 mg/L) of Cr (VI) was prepared at room temperature and stirred at a speed of 200 rpm. The test solution for each study was prepared by diluting the stock solution. The effect of pH in the adsorption of Cr (VI) by GO/ZM nanocomposite was studied by varying the pH value of the solution from 2 to 8 by adding either 0.1 M HCl or 0.1 M NaOH. The amount of adsorbent dosage was optimized by adding various amounts of adsorbent ranging from 2 to 8 mg. The contact time between Cr (VI) and the adsorbent was varied between 0 and 300 min and the percentage of removal was calculated. Also, the optimum temperature for the adsorption was found by varying the temperature over a range of 283K–343 K. All the optimization studies were performed using 10 ml of 40 mg/L Cr (VI) solution. Then the aliquot was analysed using UV-Vis absorption spectroscopy at λmax 350 nm (Sanchez-Hachair and Hofmann, 2018) and in each case, the adsorption capacity was calculated. The adsorption capacity (qe) of the adsorbent for the removal of the contaminant was calculated using the formula:
where Cinitial (mg/L) is the initial concentration of the solution, Cfinal (mg/L) is the concentration of the solution at equilibrium, V is the volume of the Cr(VI) solution in litres and m is the amount of the adsorbent used in grams.
The removal percentage of the Cr (VI) using the GO/ZM nanocomposite is calculated using the formula:
Where Cinitial is the initial concentration of the Cr (VI) solution and Cfinal is the final concentration at the end of the adsorption process.
3 Results and discussions
3.1 X-ray diffraction analysis
The crystalline structures of GO, ZM and GO/ZM nanocomposite were analysed by XRD patterns. The XRD patterns of the synthesized samples are shown in Figure 1. The XRD spectra were measured in the scan range of 5° to 60°. The diffraction pattern of graphene oxide shows the characteristic peak at 2θ = 10.05° with crystal plane (1 1 1), which corresponds to an interlayer spacing of 8.79 Å.The XRD pattern of pure zinc molybdate, reveals the characteristic peaks at 2θ values of 16.3°, 19.4°, 25.12°, 25.6°, 26°, 28.7°, 29.59°, 30.42°, 30.47°, 30.8°, 33.06°, 33.6°, 38.8°, 42.68°, 45.38°, 48.3°, and 49.09° which corresponds to the miller indices (−1 1 1), (1 0 1), (1 1 1), (0 2 1), (−2 1 1), (−2 0 2), (0 −1 3), (1 −22), (−2 -1 1), (0 −3 1), (−2 −2 1), (−2 1 3), (−3 1 1), (0 3 2), (0 4 0), (0 4 1), and (−2 0 5), respectively. The identified diffraction peaks are matched with JCPDS card no 96-1528283 and are assigned to the anorthic crystal structure with P-1 space group. For GO/ZM nanocomposite, the XRD pattern exhibits only the broadening and low-intensity diffraction peaks of zinc molybdate. In the hybrid matrix, no obvious diffraction peaks of graphene can be observed, probably because the crystallinity of graphene is inadequate (Wan et al., 2017).
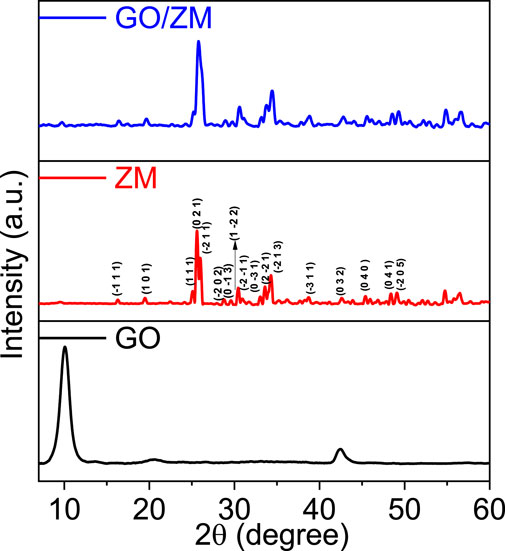
FIGURE 1. XRD diffraction pattern for GO, ZM and GO/ZM.
3.2 FTIR analysis
FTIR analysis was used to determine the types of functional groups and chemical bonding of the molecules present in the GO/ZM nanocomposite. The characteristic absorption of functional group vibrations of GO/ZM nanocomposite was identified by performing the FTIR analysis in the scan range between the wavenumbers 500 and 4000 cm−1, as shown in Figure 2. Depending on the relative mass of an atom, the constants governing bonding force or rigidity, as well as the geometry of the atom, each functional group vibrates with a specific frequency or wave number. In the FTIR spectrum of GO the broad peak above 3000 cm−1 appears due to the high density of hydroxyl groups on the surface of GO. The infrared bands at 3524 and 1608 cm−1 are attributed to the stretching and bending motions of OH in the water molecule. The adsorption bands at 1282.51 and 1074.39 cm−1 correspond to the epoxy C–O and alkoxy C–O groups, respectively. Thus, the formation of GO by the oxidation of graphite was confirmed by the presence of oxygen-containing functional groups, such as C=O and C–O. In the FTIR spectra of the GO/ZM nanocomposite, mostly [MoOy]n− is responsible for adsorption bands in the 700–900 cm−1 range (Hardcastle and Wachs, 1990; Reddy et al., 2018). At wave number 1717.38 cm−1, there is an absorption peak related to C=O stretching vibrations from carbonyl or carboxyl groups.
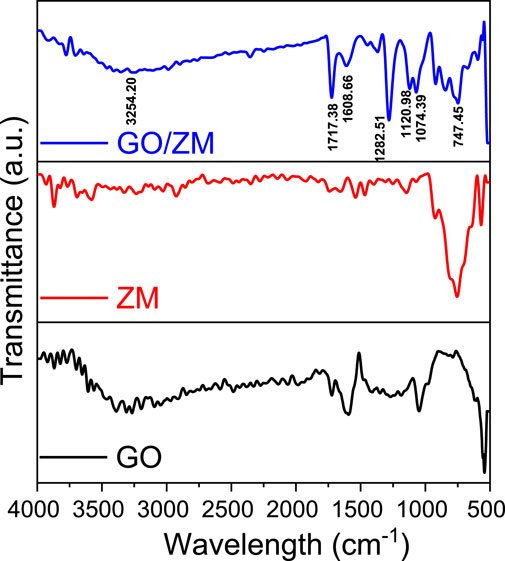
FIGURE 2. FTIR Spectra of GO/ZM nanocomposite.
3.3 Raman spectroscopy
Raman spectroscopy is widely used to characterize graphene’s structural and electronic properties, including defect density, disorder, and defects (Gurunathan et al., 2012). The presence of graphene oxide in the GO/ZM nanocomposite was confirmed by Raman spectroscopy, as shown in Figure 3. It can be observed that both GO and GO/ZM nanocomposite exhibit two characteristic peaks at 1331 and 1590 cm−1, corresponding to the disorder-induced D-band and graphitic G-band, respectively (Peng et al., 2016; Yang et al., 2016). At 1331 cm−1, the D vibration band is formed by j-point photons of A1g symmetry, and at 1590 cm−1, the G vibration band from the first-order scattering of E2g phonons by sp2 carbon can be observed. From the spectra shown in Figure 3, it is observed that the ID/IG ratio for GO and GO/ZM are 1.07 and 1.11, respectively, which implies that the addition of ZnMoO4 to GO nanosheets increase the number of vacancies and defects in the GO/ZM hybrid (Liu et al., 2016).
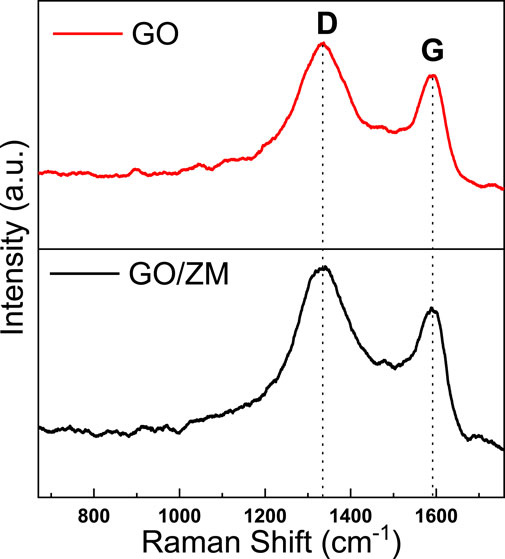
FIGURE 3. Raman spectra of GO and GO/ZM.
3.4 UV-visible spectroscopy
From the UV–visible analysis, the presence of intermediary energy level due to imperfection/lattice distortion can be investigated. UV- visible absorption spectra of the as-synthesized GO, ZM and GO/ZM is plotted in Figure 4. The single absorption peak at 215 nm for GO is attributed to the Π–Π* Plasmon interactions. The sp2 clusters of the GO synthesized via the Hummers method, coupled with C=C, C=O, and C-O linking units, are accountable for the peak at 215 nm (Song et al., 2014). The recorded absorption spectra of ZnMoO4 depict broad absorption spectra in the range of 200–400 nm peaking at 360 nm. The absorption peak of ZnMoO4 is due to defects in the ZNM matrix. The broad absorbance peak reveals that the emission process is a direct consequence of multi-energy clusters of MoO4 units (Lovisa et al., 2019). With the addition of GO, the absorption peak is broadened and shows a blue shift.

FIGURE 4. UV-vis spectra of GO, ZM and GO/ZM.
3.5 Transmission electron microscopy
The surface morphology of GO, ZM, and GO/ZM nanocomposites were investigated by High-resolution Transmission Electron Microscopy (TEM). Figure 5 shows the TEM images of the GO, ZM, and GO/ZM nanocomposite, respectively; Figure 5A shows that graphene oxide has a sheet-like morphology, and as shown in Figure 5B, ZnMoO4 nanoparticles appear to have a pebble-like structure. Furthermore, the TEM image of GO/ZM in Figure 5C reveals that s the pebble-like structured ZnMoO4 nanoparticles non-uniformly distributed on the graphene oxide sheets. The metal oxide nanoparticles prevent the restacking of the graphene oxide sheets and provide an increased surface area (Majumder et al., 2019).

FIGURE 5. HRTEM images of (A) GO (B) ZM (C) GO/ZM nanocomposite.
3.6 BET studies
N2 adsorption-desorption isotherm curve of GO/ZM nanocomposite is obtained by the gas sorption measurement performed at 77.35 K. From Figure 6A, it is understood that the isotherm resembles type IV hysteresis in which narrow area in the lower pressure region indicates an open porous structure, and the presence of macropores is indicated by the hysteresis loop at the high-pressure region. Thus, it can be concluded that the sample is mesoporous (Mukhtar et al., 2020). The surface area of the adsorbent is obtained to be 121.181 m2/g. The porosity distribution of GO/ZM nanocomposite is shown in Figure 6B. The average pore radius is calculated to be 2.1528 nm by the Barrett-Joyner-Halenda (BJH) model, which confirms the mesoporous (2–50 nm in size) nature of the adsorbent.
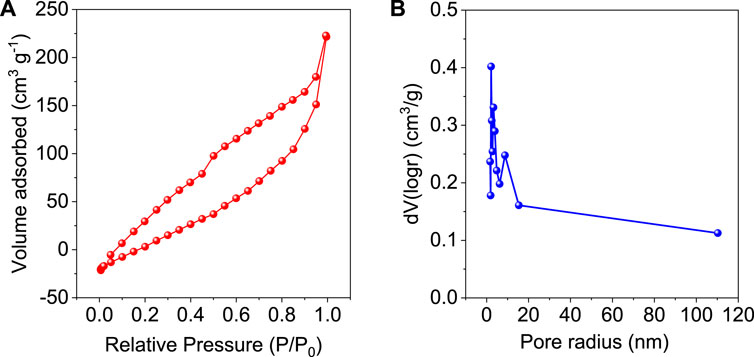
FIGURE 6. (A) N2 Adsorption-Desorption Isotherm of GO/ZM, (B) Pore size distribution curve of GO/ZM.
3.7 Adsorption studies
The effect of various parameters such as initial concentration, pH, contact time, adsorbent dosage and temperature on the removal of Cr (VI) ions using GO/ZM was investigated to optimize the adsorption process.
3.7.1 Effect of initial concentration
The effect of the initial concentration of the Cr (VI) ions on the adsorption process is shown in Figure 7A. The experiment was conducted at room temperature with different initial concentrations of 10, 20, 30, 40, 50, and 60 mg/L of Cr (VI) solutions. 6 mg adsorbent was added to 10 ml of each concentration, and the adsorption capacity was calculated. It was found that the adsorption capacity of the adsorbent increased with the increase in the initial concentration of the chromium ions present in the solution. Due to its higher concentration, this may be due to more vacant sites on the adsorbent occupied by the adsorbate molecules (Prasetya et al., 2020).
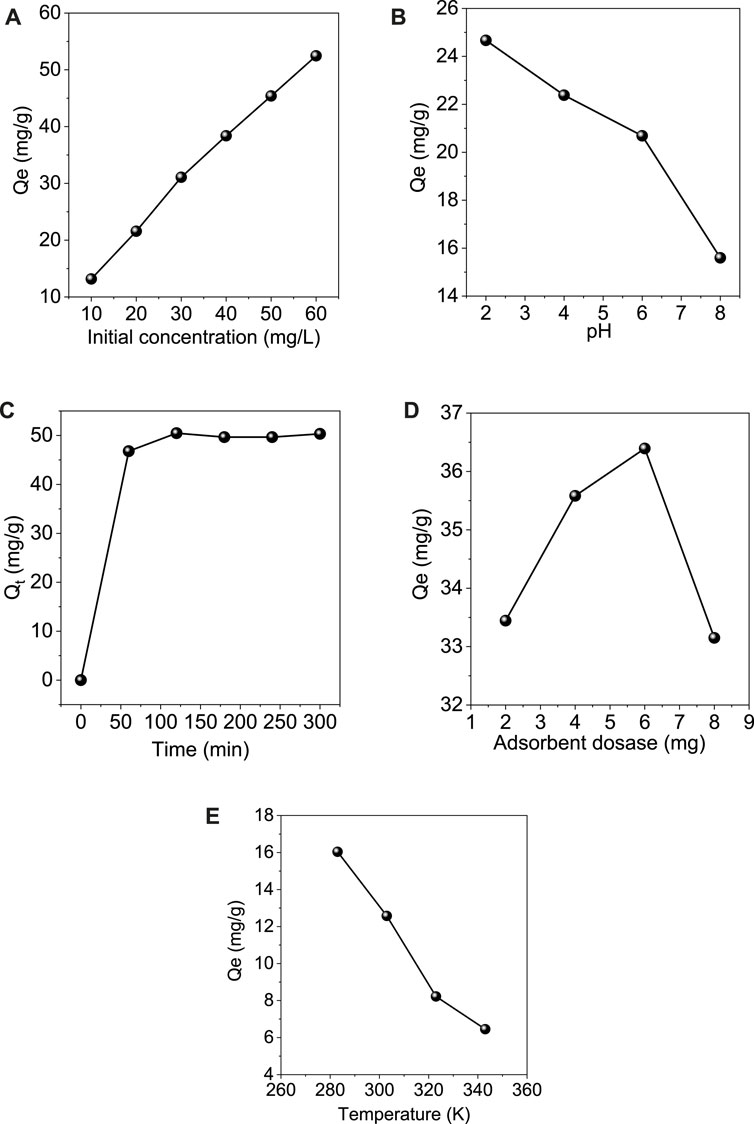
FIGURE 7. Effect of different optimization parameters on the adsorption of Cr (VI) onto GO/ZM nanocomposite (A) Initial concentration (B) pH (C) Contact time (D) Adsorbent dosage (E) Temperature.
3.7.2 Effect of pH
The pH of the solution plays a significant role in the distribution of the Cr (VI) metal ions and the surface potential of GO/ZM adsorbent (Liu et al., 2019b). To evaluate the adsorption capacity of GO/ZM for the removal of Cr (VI) ions under both acidic and alkalic conditions pH of the 40 mg L−1 Cr (VI) solution was varied from 2 to 8 and the corresponding absorbance for each pH was noted as shown in the Figure 7B. The pH of a solution influences both the surface charge of the adsorbent and also the speciation of the metal ions. The results indicate that the maximum removal of the Cr metal ions occurs at a lower pH 2. At pH 2, the maximum adsorption capacity is obtained due to the protonation of functional groups (-OH and -COOH) on a significant fraction of the adsorbent, resulting in a sizeable electrostatic affinity with negatively charged chromium ions (Neolaka et al., 2018; Neolaka et al., 2020). There is a drastic decrease in the removal percentage as the pH of the solution is increased above 2 because the oxidized functional groups deprotonate to form an opposing adsorbent surface and the anionic species of Cr (VI) become more resistant to the electrostatic interaction (Neolaka et al., 2020). Also, increased interactions between Cr (VI) anion and OH− ion at higher pH could cause a decrease in Cr (VI) adsorption on GO/ZM nanocomposite (Wang et al., 2017).
3.7.3 Effect of contact time
The contact time is one of the significant factors to find the equilibrium between the adsorbent and the adsorbate. In the present work, the experiment was carried out at room temperature with 40 mg/L Cr (VI) solution and 6 mg adsorbent at pH value 2 to study the effect of contact time on the batch adsorption of Cr (VI) ions on GO/ZM adsorbent. To determine the equilibrium time for the maximum adsorption progress, the contaminant and the adsorbent were treated over a contact time varying from 60–300 min. As shown in Figure 7C, the adsorption capacity of Cr (VI) from the aqueous solution using the adsorbent increases rapidly up to 120 min and then gradually decreases from 180 to 240 min. The higher adsorption in the initial stages might be attributed to the greater availability of adsorption sites, which saturates as the adsorption progresses (Mondal and Chakraborty, 2020). The surface area obtained from the BET isotherm model is found to be 121.181 m2/g, which might be insufficient for adsorption after it reaches the equilibrium contact time.
3.7.4 Effect of adsorbent dosage
The effect of GO/ZM adsorbent dosage for the removal of Cr (VI) at room temperature is shown in Figure 7D. The experiment was carried out in the range of 2–8 mg of adsorbent dosage. The study shows that when the adsorbent dosage was increased from 2 to 6 mg, the adsorption capacity also gradually increased later when the adsorbent dosage became 8 mg, the adsorption capacity got decreased. Thus maximum removal of Cr (VI) was observed when the adsorbent dosage was 6 mg per 10 ml Cr (VI) solution. This significant decrease in the adsorption capacity might be due to the heterogeneous distribution of the active sites throughout the surface of the material (Liu et al., 2019b), which is also clearly evident from the Freundlich isotherm correlation coefficient value, which is discussed in section 3.3.
3.7.5 Effect of temperature
Temperature is one of the crucial factors which influence the adsorption progress. To study the effect of temperature on the adsorption process 6 mg adsorbent was added to 10 ml of 40 mg/L Cr(VI) solution with pH value 2, and the temperature was varied from 283 to 343 K. As shown in Figure 7E, the results indicate that the adsorption progress gradually decreased as the temperature was increased. Maximum adsorption was observed at 283 K thus, it can be concluded that the reaction is exothermic.
3.8 Adsorption isotherms
The adsorption mechanism can be better understood with the help of adsorption isotherms. Isotherm studies using the GO/ZM nanocomposite adsorbent were performed with different initial concentrations of Cr (VI) solution of 10, 20, 30, 40, 50, and 60 mg/L. In the present study two theoretical models, Langmuir and Freundlich isotherms were used to examine the adsorption behaviour of GO/ZM adsorbent for the removal of Cr (VI) ions.
The mathematical expression for Langmuir isotherm is given by the equation:
where qe is the equilibrium adsorption capacity (mg/g), Ce is the equilibrium concentration (mg/L), qmax is the maximum adsorption capacity (mg/g) and KL is the Langmuir constant related to the adsorption rate (L/mg).
The mathematical expression for Freundlich Isotherm is given by the equation:
where 1/n is the adsorption intensity and KF is the Freundlich constant related to the adsorption rate (L/mg).
From Figure 8 and Figure 9, we can conclude that when compared to other isotherm models, the Freundlich model is well suited to represent the experimental data which is characterized by a higher correlation coefficient value (R2 = .985). This might be attributed to the multilayer adsorption and the heterogeneous distribution of the active sites on the surface of the adsorbent. Furthermore, the adsorption parameters obtained from the isotherms models are shown in Table 1.
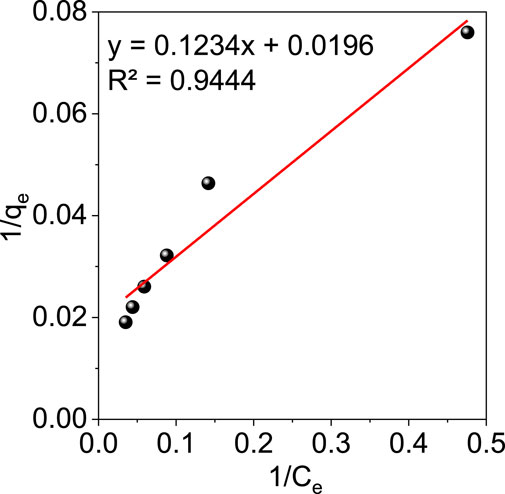
FIGURE 8. Langmuir isotherm for adsorption of Cr (VI) onto GO/ZM nanocomposite.

FIGURE 9. Freundlich isotherm for adsorption of Cr (VI) onto GO/ZM nanocomposite.
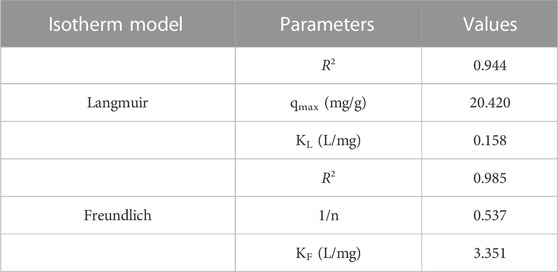
TABLE 1. The value of isotherm parameters in the adsorption of Cr (VI) ions using GO/ZM nanocomposite.
3.9 Adsorption kinetics
The kinetic analysis provides significant information regarding the path and mechanism of adsorption as well as the rate of adsorption (Li et al., 2018). To understand the adsorption kinetics between the adsorbent and the adsorbate, two kinetic models of pseudo first order (PFO) and pseudo second order (PSO) as shown in Table 2 were used.
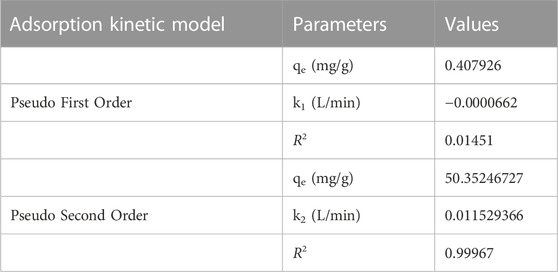
TABLE 2. The value of kinetic parameters in the adsorption of Cr (VI) ions using GO/ZM nanocomposite.
The mathematical expression for pseudo first order kinetics is given by:
where qe (mg/g) is the equilibrium adsorption capacity, qt is the adsorption capacity at time t and k1 is the rate constant (L/min).
Similarly, the mathematical expression for pseudo second order kinetics is given by:
where k2 is the rate constant (mg/min).
Figure 10 and Figure 11 show the results of linear fitting for pseudo-first order and pseudo-second order, respectively. From Table 2, which depicts the values of the kinetic parameters, it is clear that the adsorption of Cr (VI) using GO/ZM nanocomposite follows pseudo-second-order kinetic model with a higher correlation coefficient (R2 = .9997) when compared to the pseudo first-order kinetic model. The PSO kinetic model for Cr(VI) adsorption on GO/ZM nanocomposite is based on the assumption that the rate-controlling step in the process is chemical adsorption or chemisorption (Kecili and Hussain, 2018).

FIGURE 10. Pseudo first order kinetic model for adsorption of Cr (VI) onto GO/ZM nanocomposite.
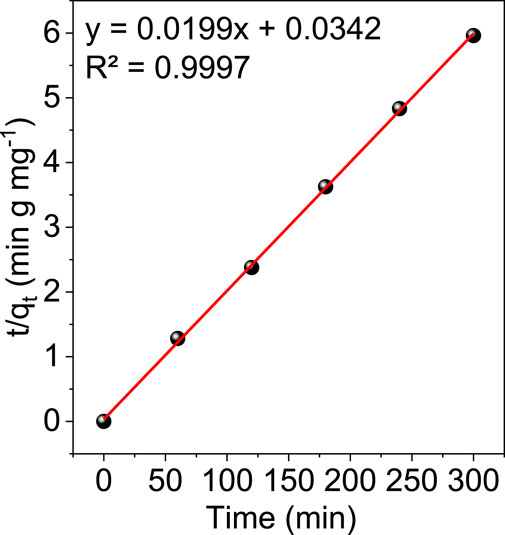
FIGURE 11. Pseudo second order kinetic model for adsorption of Cr (VI) onto GO/ZM nanocomposite.
4 Conclusion
In summary, Graphene Oxide-Zinc Molybdate nanocomposite was synthesized successfully. The optimized parameters for adsorption of Cr(VI) ions using the synthesized nano adsorbent are pH 2, adsorbent dosage of 6 mg in 10 ml of 40 mg/L Cr(VI) solution, contact time of 120 min, and temperature to be 283 K. From the adsorption isotherm studies, it is found that the adsorption of Cr (VI) ions using GO/ZM nanocomposite follows the Freundlich isotherm model which has a better fit compared to the Langmuir isotherm model. While based on the adsorption kinetic study, the adsorption process followed the pseudo second order kinetic model which predicts the chemisorption behaviour. The BET studies show that it follows type IV isotherm, and the surface area of the adsorbent is found to be 121.181 m2/g. Also, from the BJH model, the average pore size is obtained to be 2.1528 nm. So based on all the obtained results, it can be concluded that the adsorption of Cr (VI) ions using GO/ZM nanocomposite is multilayer adsorption and the adsorbent is mesoporous material with a heterogeneous surface.
Data availability statement
The original contributions presented in the study are included in the article/Supplementary Material, further inquiries can be directed to the corresponding author.
Author contributions
MK contributed to the experimental analysis, data curation, and writing the original draft. KR contributed to the contributed to the conceptualization, review and editing. RS contributed to resource and methodology. NL contributed to project administration, visualization, writing, review, and editing.
Acknowledgments
The authors MK and NL would like to thank the Department of Physics and Nanotechnology, SRM Institute of Science and Technology for providing us required lab facilities. The authors would like to acknowledge the HRTEM FACILITY at SRMIST set up with support from MNRE (Project No. 31/03/201415/PVSE-R&D), the Government of India. We acknowledge SRM Institute of Science and Technology for providing the Micro Raman facility.
Conflict of interest
The authors declare that the research was conducted in the absence of any commercial or financial relationships that could be construed as a potential conflict of interest.
Publisher’s note
All claims expressed in this article are solely those of the authors and do not necessarily represent those of their affiliated organizations, or those of the publisher, the editors and the reviewers. Any product that may be evaluated in this article, or claim that may be made by its manufacturer, is not guaranteed or endorsed by the publisher.
References
Ali, A., Saeed, K., and Mabood, F. (2016). Removal of chromium (VI) from aqueous medium using chemically modified banana peels as efficient low-cost adsorbent. Alexandria Eng. J. 55 (3), 2933–2942. doi:10.1016/j.aej.2016.05.011
Avila, M., Burks, T., Akhtar, F., Göthelid, M., Lansåker, P. C., Toprak, M. S., et al. (2014). Surface functionalized nanofibers for the removal of chromium (VI) from aqueous solutions. Chem. Eng. J. 245, 201–209. doi:10.1016/j.cej.2014.02.034
Buters, J., and Biedermann, T. (2017). Chromium (VI) contact dermatitis: Getting closer to understanding the underlying mechanisms of toxicity and sensitization. J. Investigative Dermatology 137 (2), 274–277. doi:10.1016/j.jid.2016.11.015
Chen, L., Zhang, J., Zhu, Y., and Zhang, Y. (2018). Interaction of chromium (III) or chromium (VI) with catalase and its effect on the structure and function of catalase: An in vitro study. Food Chem. 244, 378–385. doi:10.1016/j.foodchem.2017.10.062
Enniya, I., Rghioui, L., and Jourani, A. (2018). Adsorption of hexavalent chromium in aqueous solution on activated carbon prepared from apple peels. Sustain. Chem. Pharm. 7, 9–16. doi:10.1016/j.scp.2017.11.003
Gao, W., Majumder, M., Alemany, L. B., Narayanan, T. N., Ibarra, M. A., Pradhan, B. K., et al. (2011). Engineered graphite oxide materials for application in water purification. ACS Appl. Mater. interfaces 3 (6), 1821–1826. doi:10.1021/am200300u
Gurunathan, S., Han, J. W., Dayem, A. A., Eppakayala, V., and Kim, J-H. (2012). Oxidative stress-mediated antibacterial activity of graphene oxide and reduced graphene oxide in Pseudomonas aeruginosa. Int. J. nanomedicine 7, 5901–5914. doi:10.2147/ijn.s37397
Hamdan, S. S., and El-Naas, M. H. (2014). Characterization of the removal of Chromium (VI) from groundwater by electrocoagulation. J. Industrial Eng. Chem. 20 (5), 2775–2781. doi:10.1016/j.jiec.2013.11.006
Hardcastle, F. D., and Wachs, I. E. (1990). Determination of molybdenum–oxygen bond distances and bond orders by Raman spectroscopy. J. Raman Spectrosc. 21 (10), 683–691. doi:10.1002/jrs.1250211009
Herrero-Latorre, C., Barciela-García, J., García-Martín, S., and Pena-Crecente, R. (2018). Graphene and carbon nanotubes as solid phase extraction sorbents for the speciation of chromium: A review. Anal. Chim. acta 1002, 1–17. doi:10.1016/j.aca.2017.11.042
Hou, Y., Lv, S., Liu, L., and Liu, X. (2020). High-quality preparation of graphene oxide via the Hummers' method: Understanding the roles of the intercalator, oxidant, and graphite particle size. Ceram. Int. 46 (2), 2392–2402. doi:10.1016/j.ceramint.2019.09.231
Jia, R. P., Zhang, C., and Xu, J. Y. (2013). Morphology-controllable synthesis and characterization of ZnMoO4 nanoparticles. Adv. Mater. Res. (Trans Tech Publ) 624, 51–54. 10.4028/www.scientific.net%2FAMR.624.51
Karthik, R., and Meenakshi, S. (2014). Facile synthesis of cross linked-chitosan–grafted-polyaniline composite and its Cr (VI) uptake studies. Int. J. Biol. Macromol. 67, 210–219. doi:10.1016/j.ijbiomac.2014.03.035
Kecili, R., and Hussain, C. M. (2018). Mechanism of adsorption on nanomaterials. Nanomaterials in Chromatography. Elsevier, 89–115. doi:10.1016/B978-0-12-812792-6.00004-2
Li, N., Yue, Q., Gao, B., Xu, X., Kan, Y., and Zhao, P. (2018). Magnetic graphene oxide functionalized by poly dimethyl diallyl ammonium chloride for efficient removal of Cr (VI). J. Taiwan Inst. Chem. Eng. 91, 499–506. doi:10.1016/j.jtice.2018.05.028
Liu, S., Ma, C., Ma, M-G., and Xu, F. (2019). Magnetic nanocomposite adsorbents. Composite Nanoadsorbents. Elsevier, 295–316. doi:10.1016/B978-0-12-814132-8.00013-7
Liu, X., Ma, R., Wang, X., Ma, Y., Yang, Y., Zhuang, L., et al. (2019). Graphene oxide-based materials for efficient removal of heavy metal ions from aqueous solution: A review. Environ. Pollut. 252, 62–73. doi:10.1016/j.envpol.2019.05.050
Liu, Y., Zhang, N., Yu, C., Jiao, L., and Chen, J. (2016). MnFe2O4@ C nanofibers as high-performance anode for sodium-ion batteries. Nano Lett. 16 (5), 3321–3328. doi:10.1021/acs.nanolett.6b00942
Lovisa, L., Fernandes, Y., Garcia, L., Barros, B., Longo, E., Paskocimas, C., et al. (2019). Tb3+/Pr3+ co-doped ZnMoO4 phosphor with tunable photoluminescence and energy transfer processes. Opt. Mater. 96, 109332. doi:10.1016/j.optmat.2019.109332
Majumder, P., Dutta, K., and Dutta, P. (2019). Synthesis, properties of graphene oxide-metal oxide mixed nanocomposites and their applications-review. Int. J. Adv. Sci. Eng. 3, 1032–1039. doi:10.29294/ijase.5.3.2019.1032-1039
Mishra, S., and Bharagava, R. N. (2016). Toxic and genotoxic effects of hexavalent chromium in environment and its bioremediation strategies. J. Environ. Sci. Health, Part C. 34 (1), 1–32. doi:10.1080/10590501.2015.1096883
Mondal, N. K., and Chakraborty, S. (2020). Adsorption of Cr (VI) from aqueous solution on graphene oxide (GO) prepared from graphite: Equilibrium, kinetic and thermodynamic studies. Appl. Water Sci. 10 (2), 61–10. doi:10.1007/s13201-020-1142-2
Mukhtar, A., Mellon, N., Saqib, S., Lee, S-P., and Bustam, M. A. (2020). Extension of BET theory to CO2 adsorption isotherms for ultra-microporosity of covalent organic polymers. SN Appl. Sci. 2 (7), 1232–1234. doi:10.1007/s42452-020-2968-9
Neolaka, Y. A., Kalla, E. B., Supriyanto, G., and Puspaningsih, N. N. T. (2017). Adsorption of hexavalent chromium from aqueous solutions using acid activated of natural zeolite collected from ende-flores, Indonesia. Rasayan J. Chem. 10 (2), 606–612.
Neolaka, Y. A., Lawa, Y., Naat, J. N., Riwu, A. A., Iqbal, M., Darmokoesoemo, H., et al. (2020). The adsorption of Cr (VI) from water samples using graphene oxide-magnetic (GO-Fe3O4) synthesized from natural cellulose-based graphite (kusambi wood or Schleichera oleosa): Study of kinetics, isotherms and thermodynamics. J. Mater. Res. Technol. 9 (3), 6544–6556. doi:10.1016/j.jmrt.2020.04.040
Neolaka, Y. A., Supriyanto, G., and Kusuma, H. S. (2018). Adsorption performance of Cr (VI)-imprinted poly (4-VP-co-MMA) supported on activated Indonesia (Ende-Flores) natural zeolite structure for Cr (VI) removal from aqueous solution. J. Environ. Chem. Eng. 6 (2), 3436–3443. doi:10.1016/j.jece.2018.04.053
Oudghiri-Hassani, H., Rakass, S., Abboudi, M., Mohmoud, A., and Al Wadaani, F. (2018). Preparation and characterization of α-Zinc molybdate catalyst: Efficient sorbent for methylene blue and reduction of 3-nitrophenol. Molecules 23 (6), 1462. doi:10.3390/molecules23061462
Peng, S., Han, X., Li, L., Zhu, Z., Cheng, F., Srinivansan, M., et al. (2016). Unique cobalt sulfide/reduced graphene oxide composite as an anode for sodium-ion batteries with superior rate capability and long cycling stability. Small 12 (10), 1359–1368. doi:10.1002/smll.201502788
Prasetya, G. A., Wijayanti, E., and Ferdiansjah, F. (2020). Dependence of temperature and initial concentration in cesium adsorption as experimental radioactive waste using metal organic frameworks [Zn4O (BDC) 3], In AIP Conference Proceedings (AIP Publishing LLC), 2223 (1), 030006. doi:10.1063/5.0003956
Reddy, B. J., Vickraman, P., and Justin, A. S. (2018). Investigation of novel zinc molybdate–graphene nanocomposite for supercapacitor applications. Appl. Phys. A 124 (6), 409–9. doi:10.1007/s00339-018-1793-0
Rodríguez, C., Tapia, C., Leiva-Aravena, E., and Leiva, E. (2020). Graphene oxide–ZnO nanocomposites for removal of aluminum and copper ions from acid mine drainage wastewater. Int. J. Environ. Res. Public Health 17 (18), 6911. doi:10.3390/ijerph17186911
Sanchez-Hachair, A., and Hofmann, A. (2018). Hexavalent chromium quantification in solution: Comparing direct UV–visible spectrometry with 1, 5-diphenylcarbazide colorimetry. Comptes Rendus Chim. 21 (9), 890–896. doi:10.1016/j.crci.2018.05.002
Shaban, M., Abukhadra, M. R., Khan, A. A. P., and Jibali, B. M. (2018). Removal of Congo red, methylene blue and Cr (VI) ions from water using natural serpentine. J. Taiwan Inst. Chem. Eng. 82, 102–116. doi:10.1016/j.jtice.2017.10.023
Song, J., Wang, X., and Chang, C-T. (2014). Preparation and characterization of graphene oxide. J. Nanomater. 2014, 1–6. doi:10.1155/2014/276143
Thangavel, S., and Venugopal, G. (2014). Understanding the adsorption property of graphene-oxide with different degrees of oxidation levels. Powder Technol. 257, 141–148. doi:10.1016/j.powtec.2014.02.046
Wan, L., Shen, J., Zhang, Y., and Li, X. (2017). Novel ZnMoO4/reduced graphene oxide hybrid as a high-performance anode material for lithium ion batteries. J. Alloys Compd. 708, 713–721. doi:10.1016/j.jallcom.2017.03.078
Wang, D., Zhang, G., Zhou, L., Wang, M., Cai, D., and Wu, Z. (2017). Synthesis of a multifunctional graphene oxide-based magnetic nanocomposite for efficient removal of Cr (VI). Langmuir 33 (28), 7007–7014. doi:10.1021/acs.langmuir.7b01293
Keywords: graphene oxide, zinc molybdate, Chromium, adsorption, isotherms
Citation: K. S. M, Rahulan KM, Sujatha RA and Little Flower NA (2023) Adsorption of hexavalent chromium from water using graphene oxide/zinc molybdate nanocomposite: Study of kinetics and adsorption isotherms. Front. Energy Res. 11:1139604. doi: 10.3389/fenrg.2023.1139604
Received: 07 January 2023; Accepted: 25 January 2023;
Published: 08 February 2023.
Edited by:
Mugilan Narayanasamy, Sungkyunkwan University, Republic of KoreaReviewed by:
Suresh Perumal, Indian Institute of Technology Jodhpur, IndiaR. Ramesh, Periyar University, India
Copyright © 2023 K. S., Rahulan, Sujatha and Little Flower. This is an open-access article distributed under the terms of the Creative Commons Attribution License (CC BY). The use, distribution or reproduction in other forums is permitted, provided the original author(s) and the copyright owner(s) are credited and that the original publication in this journal is cited, in accordance with accepted academic practice. No use, distribution or reproduction is permitted which does not comply with these terms.
*Correspondence: N. Angeline Little Flower, YW5nZWxpbm5Ac3JtaXN0LmVkdS5pbg==