 Juan Luo
 Jiwen Yang2
 Siyu Wan
- 1School of Law and Sociology, Xihua University, Chengdu, China
- 2School of Criminal Law, East China University of Political Science and Law, Shanghai, China
- 3Business School, University of Nottingham, Malaysia Campus, Selangor, Malaysia
- 4School of Aviation Safety and Security, Civil Aviation Flight University of China, Guanghan, China
- 5Chongqing Vocational College of Transportation, Chongqing, China
This article investigates the impact of energy conservation and emission reduction policies on household carbon emissions by using the fixed-effect model and finds energy conservation and emission reduction policy has a positive effect on household carbon emissions. The data sample covers 31 provinces, autonomous regions and municipalities in China from 2011 to 2020. In addition, this article conducts a mechanism test and finds new energy public buses can play a negative mediating effect on the relationship between government policy and household carbon emissions. Besides, this article finds that the effect of energy conservation on emission reduction policies is more evident in western areas.
1 Introduction
Due to the extensive use of fossil fuels by human beings, the greenhouse effect is constantly superimposed, resulting in global warming. In response to global warming, the United Nations has adopted the United Nations Framework Convention on Climate Change (FCCC, 1992) to set the emission reduction process for climate change. Subsequently, 193 contracting parties signed the Copenhagen Accord (2009) to reach an agreement on carbon dioxide emissions. Encouraging low-carbon economic transformation, optimizing energy structure and improving energy efficiency have become the main strategic paths for countries to reduce carbon dioxide emissions (Cheng et al., 2021). The household sector is considered an important source of carbon dioxide emissions. Hertwich et al. (2018) pointed out that about 72% of global carbon emissions are contributed by household consumption. Sepehr et al. (2018) show that households consumed about 40% of the world’s primary energy in 2016 and produced greenhouse gas emissions exceeding 33% of global-related greenhouse gas emissions.
According to the International Energy Agency (IEA) analysis data, China’s carbon dioxide emissions in 2021 were 11.9 billion tons, accounting for 33% of the global total, ranking first in the world. With the acceleration of urbanization, China’s total energy consumption has increased by 3.5 times in the past 20 years, from 1469.64 million tons of standard coal in 2000–5240 million tons of standard coal in 2021. With the rapid growth of China’s household income, the level of consumption structure has gradually increased, and the energy consumption caused by household-based activities such as transportation, residential use, and food is increasing. This energy consumption pattern follows the environmental Kuznets curve, that is, energy consumption increases with the increase in income, and it also shows that the household sector has become an important source of carbon emissions. Dai et al. (2012) predict that household consumption will increase as a share of China’s economy in the future, per capita consumption of most commodities will increase significantly, and more carbon emissions can be attributed to the household sector; Fan et al. (2013) pointed out that after 2000, the annual growth rate of household carbon emissions (HCE) was 8.7%, and showed an upward trend.
Huge pressure on carbon emission reduction in Chinese cities (Cheng et al., 2020b). As an important urban unit, HCE plays a significant role in carbon emission reduction (Wang et al., 2015). With the increase of green consumption demand, the guiding role of environmental cognition on household green consumption behavior has become more prominent (Xie et al., 2022). China has promised to achieve carbon neutrality by 2060, making the necessary strategic choice for carbon reduction in the household sector. To this end, China has introduced a series of energy conservation and emission reduction policies (ECERPs), which aim to control total energy consumption, improve energy efficiency, and promote the green transformation of economic and social development. The ECERPs mainly formulate measures from the aspects of changing family lifestyle, advocating family low-carbon consumption, guiding residents to develop low-carbon home-based habits, and promoting green low-carbon travel and healthy low-carbon diet, which have a significant impact on family carbon emission reduction. With the changes in policy, environment and technology, it is vital to investigate the impact of ECERPs on HCE.
Therefore, this article focuses on ECERP issued by provincial departments in China and analyzes the impact of ECERP on HCE. The purpose of this study is to investigate whether ECERP can reduce HCE and whether this relationship is sustainable. These explorations will help to determine the effectiveness of ECERP and provide useful policy inspiration for the Chinese government to achieve the dual carbon goal by 2030.
2 Literature review
2.1 Influencing factors of HCE
Since China formulated the green development goals, more and more scholars have begun to pay attention to and study the influencing factors of HCE. The earliest model of household energy consumption originated from the “energy ladder” model, which explored the relationship between household income growth and fuel selection in household energy consumption. However, this model has been challenged by researchers over time. Furthermore, the ‘energy services’ model has been developed. It insists that household energy choice is a non-linear development path, and admits that household income plays a key role in household energy choice, but advocates attention to other factors that will affect household energy choice. In recent years, with the development of digital technology, the research direction of household carbon emission reduction has gradually shifted from climatic conditions to significant factors. For example, Muller and Yan, (2018) pointed out that household size, building type and the number of rooms have the most significant impact on household energy consumption. Soltani et al. (2019) investigated the energy choice and consumption dominant patterns of 821 households in urban and rural residential areas of Mahabad City, northwestern Iran, and used a three-energy dimension model that combines energy choice, energy consumption, and energy installations to reveal that household income, energy types, energy prices and availability significantly affect household energy conversion preferences. The latest research is committed to building a digital global value chains decomposition framework to analyze the corresponding carbon emission reduction effect and mechanism (He and Xie, 2022).
It is generally believed that HCE can be divided into direct carbon emissions and indirect carbon emissions. Previous studies have concluded that indirect carbon emissions are far higher than direct carbon emissions and should play a major role in carbon emission reduction. Yuan et al. (2020) confirmed that urbanization is the most important factor affecting household indirect carbon emissions. Liu et al. (2019) studied the indirect carbon emissions of urban households in China from 2002 to 2012, aiming to measure urban household inequality more accurately. The study found that household consumption activities have an impact on indirect carbon emissions, and there are significant differences in per capita carbon emissions among households with different income levels. This kind of research mainly discusses the impact of household consumption activities on HCE in China at the national or regional level, ignoring the heterogeneous effects that may arise when China is divided into regions with similar characteristics and has not yet realized the impact of policies on the behaviour of family members and thus on HCE, thus weakening the importance of policy impact. At the same time, scholars tend to measure whether HCE will indeed decrease from the aspects of household income, household consumption structure and urbanization. For example, Soltani et al. (2020), Xu et al. (2016) and Shigetomi et al. (2014) pointed out that urban HCE are mainly affected by demographic characteristics, and points out that family size, education level, family age, household employment and income and household burdens are other factors that affect HCE. Dai et al. (2012) proposed two possible household consumption expenditure patterns in China in 2050 considering total expenditure growth and urbanization and studied the impact of future household consumption pattern changes on total energy use and emissions. The results show that the increase in future income level will cause a sharp rise in household energy demand and carbon dioxide emissions, but if household consumption expenditure is placed in a non-materialized scenario, household energy demand and carbon emissions will be reduced.
The consumer lifestyle approach method (CLA) (Wang and Yang, 2016) and input-output analysis method (IOA) (Ding et al., 2017) are often used to study HCE. To reveal the dominant and recessive economic factors that lead to changes in HCE, researchers have innovated research methods. For example, Zhu et al. (2017) used the IOA and structural decomposition analysis (SDA) methods to study the carbon dioxide emissions in the process of urbanization in Tianjin, China. The study found that 74.1% of carbon emissions increased due to household consumption were significantly related to urbanization. Wang et al. (2019) used the IOA and factor-reversible SDA method to explore the impact of urbanization and consumption patterns on HCE in China from 2002 to 2012. Brizga et al. (2017) assessed the link between household energy consumption and carbon dioxide emissions in the Baltic States from 1995 to 2011 based on a multi-regional input-output model. Thanks to the above research methods and their improvements, there are a large number of research results in the field of HCE. In general, policies will not directly affect HCE but depend on some intermediary factors to be linked. It is necessary to comprehensively analyze the impact of intermediary factors, and the above research methods have limitations in decomposing these effects. Therefore, a new method is needed to deal with the impact of these factors one by one to measure their relative impact on HCE, and then to measure the impact of policies on HCE. Fixed-effect models are often used to compare the difference between each particular independent variable and the interaction between a single independent variable and other independent variables. Studies have shown that analysis results based on fixed-effect methods are more robust than random-effects methods. In the field of energy conservation and emission reduction, Wu et al. (2022) used a fixed-effect model to examine the impact of public environmental concerns on corporate environmental behavior.
2.2 Government policy and HCE
`Excessive carbon emissions can lead to environmental pollution, thus forming a negative external effect (Song et al., 2020). The theory of government intervention holds that when there are negative externalities in the social economy, the government should intervene and internalize the external influence through taxation, creditor’s rights, policies and other measures. As an important environmental regulation tool for green development, the policy has a very significant impact on carbon emission reduction. Given China’s special economic situation and policy environment, scholars have conducted a series of empirical studies on relevant policies aiming at energy conservation and emission reduction. Cheng et al. (2020a) pointed out that only at the provincial level can the government’s emission reduction policies effectively reduce carbon emissions. Chen et al. (2020) used DID and parallel multiple mediator models to investigate the carbon emission reduction effect of China’s carbon emission trading pilot and the impact path of the policy from the national and regional levels. The results show that the current emissions trading schemes (ETS) policy has a significant carbon emission reduction effect, but there is still a lot of potential emission reduction space, such as promoting low-carbon technology innovation. Cheng et al. (2022) pointed out that government spending may be a potential policy tool that indirectly affects carbon emission reduction. Based on China’s provincial panel data; Xuan et al. (2020) used DID model to explore whether the implementation of a carbon emission trading policy can effectively promote carbon emission reduction. Carbon emission trading policy, the level of economic development, investment in technical research, and opening to the outside world have a significant role in promoting carbon emission reductions. In contrast, industrial structure and environmental investment inhibit the process of carbon emission reduction, while forest coverage rate has no significant effect on carbon emission reduction. Such studies only consider the overall impact of policies and have not examined the mediating role between policies and carbon emissions. Therefore; Hibbard et al. (2018) reviewed the first decade of the Regional Greenhouse Gas Initiative and found that it not only stimulated carbon emission reduction but also stimulated investment in low-carbon power technologies and strategies. At the same time, the integrated decomposition approach is widely used to evaluate the impact mechanism of policies. The specific method is to regress the policy and carbon emission decomposition components; Su and Ang, (2015) used the logarithmic mean divisia index method (LMDI) to decompose carbon emissions into energy composition effect, energy intensity effect and industrial structure effect. However, this method cannot measure potential influencing factors that cannot be decomposed. It can be seen that policies can indeed play a role in reducing carbon emissions through the consumption effect and structural effect (Auffhammer et al., 2016). Based on the consumption effect, under the guidance and constraints of policies, enterprises and families will take the initiative to reduce energy consumption in various ways. Meanwhile, policies promote the promotion of low-carbon and environmental protection technologies by influencing the consumption structure, and then directly or indirectly affect carbon emissions in the form of changing the consumption structure.
To compare and analyze the differentiated ECERPs in China and their effects on HCE reduction, this article tries to achieve the following three goals based on existing research: (1) To expand the scope of research on carbon emissions reduction from the micro level. Based on the household level, this article discusses the impact of provincial ECERPs on carbon emissions, which breaks the existing thinking of studying carbon emissions mainly from the macro level. (2) Choosing effective empirical models to discuss the influence of ECERPs on HCE. In this article, the fixed-effect model was used to analyze the relationship between ECERPs and HCE. In addition, this article explores the mediating effect of new energy public buses. (3) Analyzing the heterogeneity impact of areas divided by their locations. It is worth noting that the analytical framework and results in this article are not only applicable to China but also can be promoted in other countries.
Overall, according to a series of influence brought by government policies, this article proposes research hypothesis 1:
H1. Existing provincial ECERPs will significantly increase the HCE.
3 Samples, variables, and methodology
3.1 Samples
The data samples in this article are from all the 31 provinces, autonomous regions and municipalities in China from 2011 to 2020. However, due to the special status of Tibet Autonomous Region in China, this article has not collected data on its household carbon emissions. So the actual number of sample individuals is 30.
As for policy scores, this article first identified five keywords: “carbon emissions”, “energy conservation and emission reduction”, “household carbon emissions”, “low-carbon life” and “green travel”. Secondly, this article counts the policy documents of these keywords from the legal database of Peking University and government-related official websites, such as the National Development and Reform Commission and the Ministry of Ecology and Environment. Finally, this article counts 317 policy documents and gives them a score to build a policy score index. Other variable data of this article are from China Statistical Yearbook, China Energy Statistical Yearbook and local statistical yearbooks. Besides, this study uses the winsorise method to deal with the extreme value of exceeding 97.5% and below 2.5%.
3.2 Variables
3.2.1 Energy conservation and emission reduction policies
Referring to the policy text quantification method of Luo et al. (2022), this article uses the assignment scoring method to quantify the ECERP documents promulgated by 31 provinces, autonomous regions and municipalities in China from 2011 to 2020 according to the dual dimensions of policy strength and policy content. The assignment criteria for policy strength and policy content are shown in Tables 1, 2.
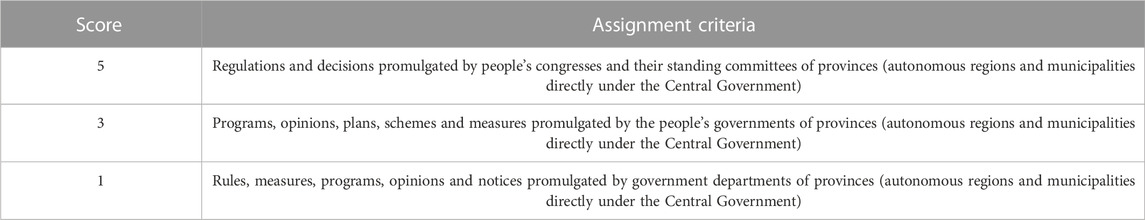
TABLE 1. The assignment criteria of policy strength.
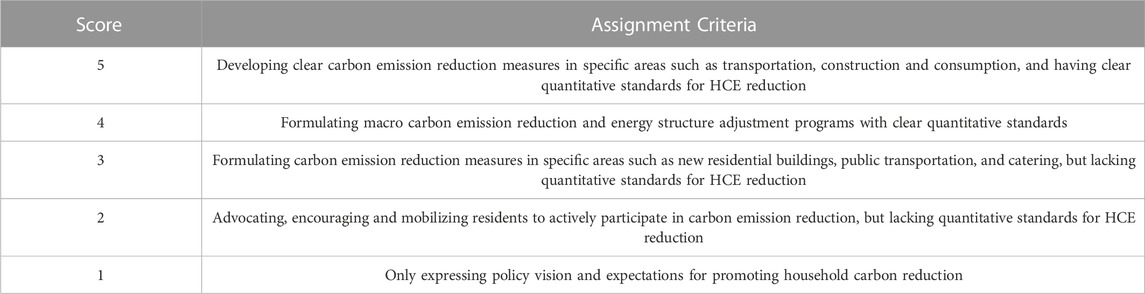
TABLE 2. The assignment criteria of policy content.
3.2.2 Household carbon emissions
This article refers to the method of Sun et al. (2015) to measure HCE from the perspective of household consumption. The scale of carbon emissions is calculated by:
In formula 1, CE represents the scale of carbon emissions, CEP represents energy consumption, CEC represents the carbon emission coefficient and i represents the year. This article uses the coefficient published by the United Nations Intergovernmental Panel on Climate Change to determine the carbon emission coefficient of 2.6. Based on formula 1, the regional carbon emissions per unit of GDP can be calculated according to formula 2:
According to formula 2, regional carbon emissions per unit of GDP are equal to the scale of regional carbon emissions divided by the total annual GDP.
Based on formula 2, regional HCE can be calculated from formula 3:
In formula 3, HCE represents the regional household carbon emissions, C represents the regional total consumption expenditure per capita, PU represents the regional urban population, PR represents the regional rural population and i represents the year. Table 3 summaries and explains all the variables in this thesis.
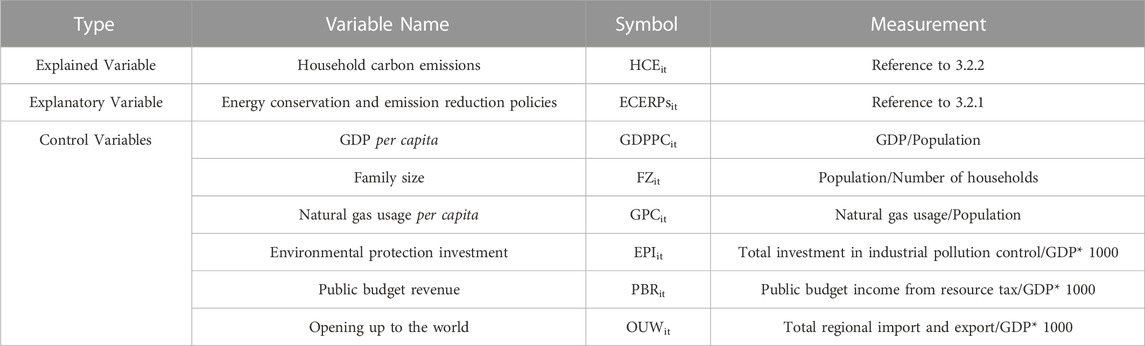
TABLE 3. Variable definition.
In this article, the measurement methods of independent variables, dependent variables and control variables involved in the model are summarized in Table 5 for reference.
3.3 Methodology
To investigate the effect that the government policy has on HCE and to validate hypothesis 1, the following regression model is established:
In the basic model, the subscript i and t denote the area i in year t. ECERPsit indicates comprehensive score of government policies for the area i in year t. The remaining variables are control variables. Placei is the individual fixed effect term, and εit refers to the error term. All variables tabulate in Table 3.
This article does not add time fixed effect term. This is because the sample is short panel data, whose size of T is smaller than N. In addition, this article has generated time dummy variables and carried out a joint significance test on time dummy variables. The result of F test is not significant, so it cannot reject the original hypothesis, which assumes that all the coefficients of time dummy variables are 0. Therefore, time change has little impact on the model.
4 Results
4.1 Descriptive statistics
Table 4 displays the descriptive statistical results for the variables, including the mean, standard deviation, minimum and maximum. The measurement of variables is shown in Table 1.
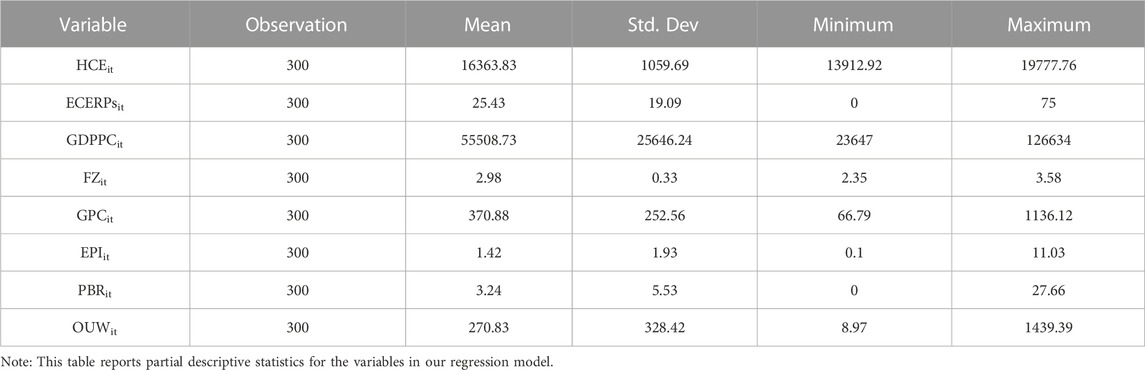
TABLE 4. Descriptive statistics of variables.
Table 4 shows that the gaps between maximum and minimum values in the variables of HCE and ECERPs are huge, which means that their structure is unbalanced, and different areas have significant differences in the variables of HCE and ECERPs. So this article does heterogeneity tests to examine the various effects of different types of regions.
4.2 Benchmark regression result
Following the method of gradually adding control variables, this article gets four regression results shown in Table 5. Firstly, this article does not control area fixed effects in column (1) and found the sign of the coefficient of ECERPs is positive and it is significant at the level of 5%. Then, this article controls the area fixed effects in column (2) and column (3). In addition, this article only controls the micro household influencing factors in column (2) and controls the household influencing factors and macro area influencing factors in column (3). All three columns show that ECERPs significantly increase household carbon emissions. Besides, this article uses robust standard error to reduce the effect of heteroscedasticity for all three regression analysis results. In short, all three regression results support hypothesis one that existing ECERPs do not help reduce HCE, but will increase HCE.
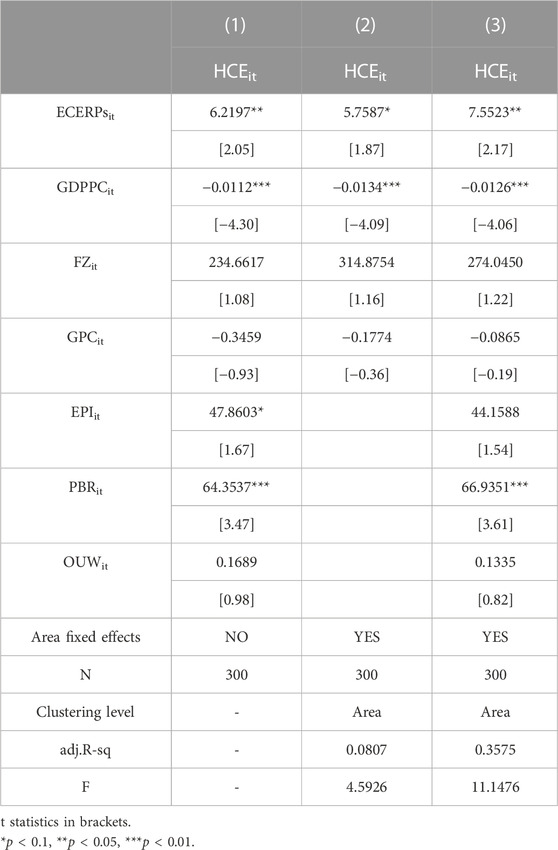
TABLE 5. Benchmark regression estimation outcomes.
Among them, the third column’s result reveals that ECERPs will lead to higher level of household carbon emissions, which is totally contrast to government’s initial intention. The coefficient symbol of GDPPCit is significantly negative at the 1% level. It implies that the better the per capita economic situation, the more carbon emissions of households can be curbed. In contrast, the area with higher public budget revenue will have a positive impact on HCE. This is because governments with higher public budget revenue could own better financial support to prompt the policy execution. However, existing ECERPs are not conducive to the reduction of HCE.
4.3 Robust test
To enhance the persuasiveness of the results of the article, this article uses the other indicator to measure HCE. Specifically, relative to the absolute value of HCE, this article uses household car ownership to measure the situation of HCE. Because the carbon emissions caused by the use of cars in households account for the main component of the total HCE. According to the sixth IPCC assessment report, the carbon emissions from gasoline combustion in Chinese households account for 36.65% of the total HCE. Therefore, household car ownership (HCO) can be used as an indicator to judge HCE. Table 6 displays the results of the regression.
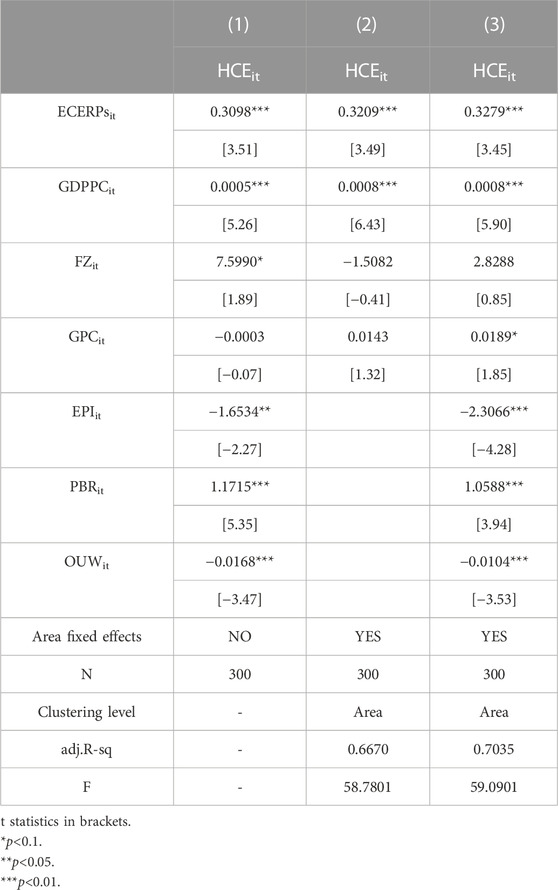
TABLE 6. Robust test results.
The three columns of results in Table 6 are presented in a similar way to the basic regression results. The first column has no regional fixed effects, the second column controls individual fixed effects but does not add macro control variables, and the third column is the result after adding all control variables. According to Table 5, all three column results show that the coefficient of ECERPsit is positive and significant at the level of 1%. These results support hypothesis one and prove that the basic regression result is reliable.
5 Further analysis
5.1 Mechanism Test
In the process of the impact of government policies on HCE, especially when this article uses household car ownership to measure HCE, the alternative car travel plan provided by the governments becomes particularly important. This article uses the logarithm of the number of new energy buses serving the citizens as a measurement variable of the level of low-carbon public transport. When the city provides more low-carbon travel plans, it will attract more citizens to choose public transport, which will promote the implementation efficiency of government policies. Therefore, this article proposes the hypothesis that the provision of new energy buses will speed up the implementation of the policy, thus building a regression formula 5 to verify the hypothesis.
In this formula, the subscript i and t denote the area i in year t” ECERPsit indicates comprehensive score of government policies for the area i in year t “α" is the constant term, "β" are variable coefficients, and "εit " is the error term. Based on the basic regression model, this model adds the new energy bus variable and the interactive term between new energy bus and the government policy, so as to judge the mediating effect of new energy buses on the government policy. The result is shown in Table 7.
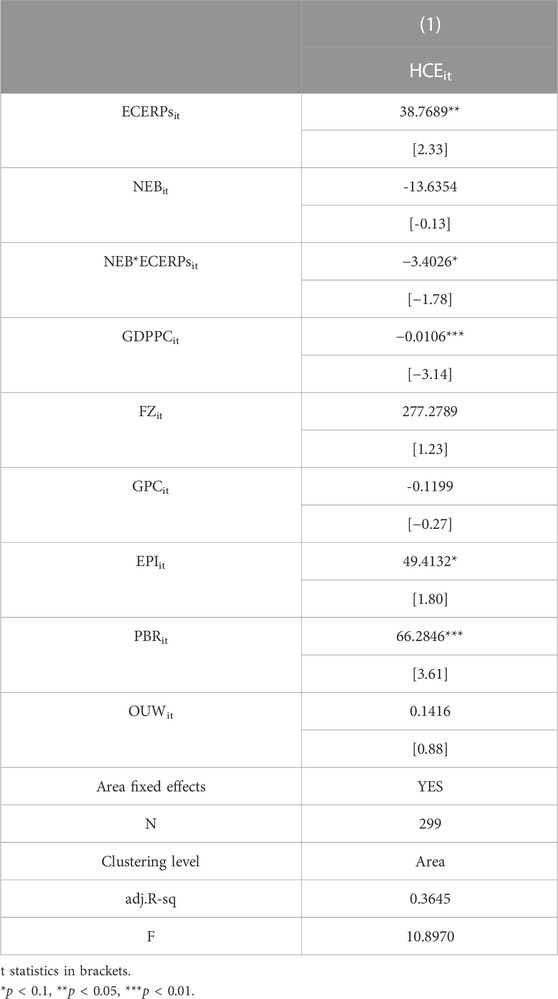
TABLE 7. Mechanism test results.
Table 7 shows that the coefficient of the interaction term of NEB and ECERPs is significant and the sign is negative. This shows that NEB can reduce the impact of government policies on HCE. It shows that the green public transport provided by the government can reduce the increase of household carbon emissions caused by government policies, thus contributing to the green development of the country.
5.2 Heterogeneity test
The data samples in this article are from all the 31 provinces, autonomous regions and municipalities in China, except Tibet. However, there is a large gap in economic development between western cities and eastern cities. According to the longitude of the region, this article equally divides 30 regions into the western region and the eastern region. Then this article uses the fixed-effect model to separately assess the two groups of sample and discusses whether the impact of ECERPs on HCE performs different effects among different groups. Table 8 displays the final regression result.
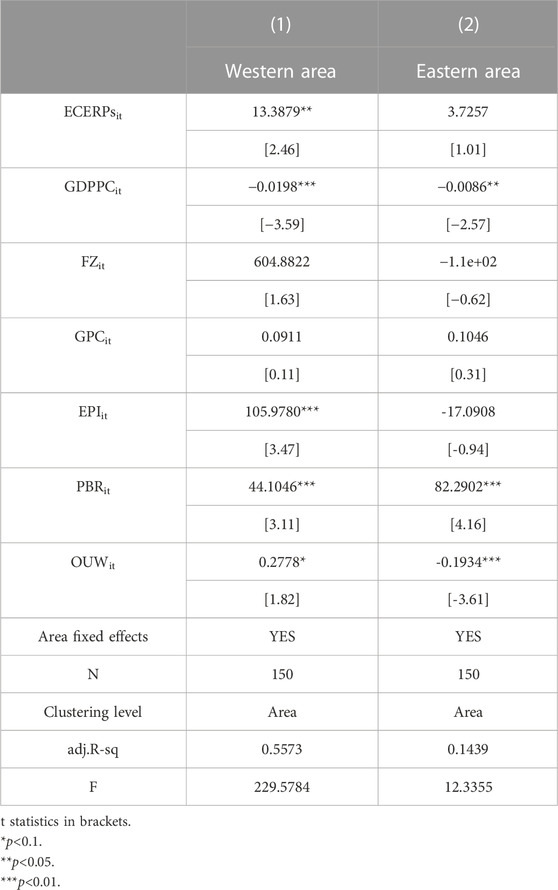
TABLE 8. Heterogeneity test results.
The results in Table 8 show that the provincial ECERPs will significantly increase the scale of HCE in the western region at the level of 5%, but this impact is not obvious in the eastern regions. This shows that the provincial policies have a greater impact on cities in the west. The reason may be that the vitality of the market economy in western cities is weaker, and the government’s intervention ability is stronger, so the implementation of policies is stronger.
6 Conclusion and suggestions
This article takes the efficiency of provincial ECERPs’ impact on HCE in various regions as the research object, analyses the development and change law of HCE, draws the conclusion that ECERP has a linear influence on HCE, is helpful for understanding the role of ECERPs in household carbon reduction, and has certain enlightenment significance for household in shaping awareness of green behaviour, and consciously carrying out carbon reduction activities. At the same time, this article finds that new energy bus can play a negative mediating effect on the relationship between government policy and HCE. Using fixed-effect model, this article finds that provincial ECERPs will significantly increase the scale of HCE, especially in the western regions. The reason for the heterogeneous effect is that the ECERPs of various provinces, autonomous regions, and municipalities directly under the Central Government often have the characteristics of ‘local knowledge’, the focus and specific requirements of ECERPs in different regions are different, and the different government’s implementation of policies is also different. As for the impact on HCE at the specific level, whether these provincial ECERPs can sink into each household and its specific carbon behaviour, needs to be analysed.
This article’s conclusions provide implications for promoting household energy conservation and emission reduction. There are three specific policy recommendations. First, optimize the implementation path of provincial ECERPs in the process of HCE to solve the problem of deviation between the implementation of existing ECERPs and past environmental policies. Second, continuously raise awareness of energy conservation and emission reduction in the household sector, actively participate in environmental governance activities, and then improve the incentive effect of provincial ECERPs in the process of HCE. Third, establish a long-term mechanism for ECERPs, normalize the implementation process of ECERPs through mid-term assessment and long-term assessment to mitigate the hysteresis effects of the policies and ensure the implementation effects of the policies.
Data availability statement
The raw data supporting the conclusion of this article will be made available by the authors, without undue reservation.
Author contributions
Contributions of the authors to this article are as follows: JL, design of the study, conceptualization, original draft writing, review and editing; JY, data collection, original draft writing; SW, supervision, original draft writing, methodology, data analysis, review and editing; JZ, validation and supervision; JL, data collection and syntax modification.
Conflict of interest
The authors declare that the research was conducted in the absence of any commercial or financial relationships that could be construed as a potential conflict of interest.
Publisher’s note
All claims expressed in this article are solely those of the authors and do not necessarily represent those of their affiliated organizations, or those of the publisher, the editors and the reviewers. Any product that may be evaluated in this article, or claim that may be made by its manufacturer, is not guaranteed or endorsed by the publisher.
References
Auffhammer, M., Sun, W., Wu, J., and Zheng, S. Q. (2016). The decomposition and dynamics of industrial carbon dioxide emissions for 287 Chinese cities in 1998-2009. J. Econ. Surv. 30, 460–481. doi:10.1111/joes.12158
Brizga, J., Feng, K., and Hubacek, K. (2017). Household carbon footprints in the baltic States: A global multi-regional input–output analysis from 1995 to 2011. Appl. Energy 189, 780–788. doi:10.1016/j.apenergy.2016.01.102
Chen, S., Shi, A., and Wang, X. (2020). Carbon emission curbing effects and influencing mechanisms of China's emission trading scheme: The mediating roles of technique effect, composition effect and allocation effect. J. Clean. Prod. 264, 121700. doi:10.1016/j.jclepro.2020.121700
Cheng, S. L., Fan, W., Chen, J. D., Meng, F. X., Liu, G. Y., Song, M. L., et al. (2020a). The impact of fiscal decentralization on CO2 emissions in China. Energy 192, 116685. doi:10.1016/j.energy.2019.116685
Cheng, S. L., Fan, W., Meng, F. X., Chen, J. D., Cai, B. F., Liu, G. Y., et al. (2020b). Toward low-carbon development: Assessing emissions-reduction pressure among Chinese cities. J. Environ. Manag. 271, 111036. doi:10.1016/j.jenvman.2020.111036
Cheng, S. L., Fan, W., Meng, F. X., Chen, J. D., Liang, S., Song, M. L., et al. (2021). Potential role of fiscal decentralization on interprovincial differences in CO2 emissions in China. Environ. Sci. Technol. 55, 813–822. doi:10.1021/acs.est.0c04026
Cheng, S. L., Wang, P., Chen, B. Y., and Fan, W. (2022). Decoupling and decomposition analysis of CO2 emissions from government spending in China. Energy 243, 122741. doi:10.1016/j.energy.2021.122741
Dai, H., Masui, T., Matsuoka, Y., and Fujimori, S. (2012). The impacts of China’s household consumption expenditure patterns on energy demand and carbon emissions towards 2050. Energy Policy 50, 736–750. doi:10.1016/j.enpol.2012.08.023
Ding, Q., Cai, W. J., Wang, C., and Sanwal, M. (2017). The relationships between household consumption activities and energy consumption in China: An input-output analysis from the lifestyle perspective. Appl. Energy 207, 520–532. doi:10.1016/j.apenergy.2017.06.003
Fan, J. L., Liao, H., Liang, Q. M., Tatano, H., Liu, C. F., and Wei, Y. M. (2013). Residential carbon emission evolutions in urban-rural divided China: An end-use and behavior analysis. Appl. Energy 101, 323–332. doi:10.1016/j.apenergy.2012.01.020
He, Y. X., and Xie, C. (2022). Measurement, decomposition and emission reduction effects of digital global value chains. J. Clean. Prod. 378 (10), 134307. doi:10.1016/j.jclepro.2022.134307
Hertwich, E. G., and Peters, G. P. (2009). Carbon footprint of Nations: A global, trade-linked analysis. Environ. Sci. Technol. 43 (16), 6414–6420. doi:10.1021/ES803496A
Hibbard, P. J., Tierney, S. F., Darling, P. G., and Cullinan, S. (2018). An expanding carbon cap-and-trade regime? A decade of experience with rggi charts a path forward. Electr. J. 31, 1–8. doi:10.1016/j.tej.2018.05.015
LiuWangSongWangWang, X. X. J. H. S. (2019). Indirect carbon emissions of urban households in China: Patterns, determinants and inequality. J. Clean. Prod. 241, 118335. doi:10.1016/j.jclepro.2019.118335
Luo, J., Xu, C., Yang, B., Chen, X., and Wu, Y. (2022). Quantitative analysis of China’s carbon emissions trading policies: Perspectives of policy content validity and carbon emissions reduction effect. Energies 15, 5123. doi:10.3390/en15145123
Muller, C., and Yan, H. (2018). Household fuel use in developing countries: Review of theory and evidence. Energy Econ. 70, 429–439. doi:10.1016/j.eneco.2018.01.024
Sepehr, M., Eghtedaei, R., Toolabimoghadam, A., Noorollahi, Y., and Mohammadi, M. (2018). Modeling the electrical energy consumption profile for residential buildings in Iran. Sustain. Cities Soc. 41, 481–489. doi:10.1016/j.scs.2018.05.041
Shigetomi, Y., Nansai, K., Kagawa, S., and Tohno, S. (2014). Changes in the carbon footprint of Japanese households in an aging society. Environ. Sci. Technol. 48 (11), 6069–6080. doi:10.1021/es404939d
Soltani, M., Rahmani, O., Beiranvand Pour, A., Ghaderpour, Y., Ngah, I., and Misnan, S. H. (2019). Determinants of variation in household energy choice and consumption: Case from Mahabad city, Iran. Sustainability 11, 4775. doi:10.3390/su11174775
Soltani, M., Rahmani, O., Ghasimi, D., Ghaderpour, Y., Ngah, I., Misnan, S. H., et al. (2020). Impact of household demographic characteristics on energy conservation and carbon dioxide emission: Case from Mahabad city, Iran. Energy 194, 116916. doi:10.1016/j.energy.2020.116916
Song, M., Zhao, X., Shang, Y., and Chen, B. (2020). Realization of green transition based on the anti-driving mechanism: An analysis of environmental regulation from the perspective of resource dependence in China. Sci. Total Environ. 698, 134317. doi:10.1016/j.scitotenv.2019.134317
Su, B., and Ang, B. W. (2015). Multiplicative decomposition of aggregate carbon intensity change using input-output analysis. Appl. Energy 154, 13–20. doi:10.1016/j.apenergy.2015.04.101
Sun, X., and Wang, Z. (2021). Can Chinese families achieve a low-carbon lifestyle? An empirical test of China’s low-carbon pilot policy. Front. Energy Res. 9, 655733. doi:10.3389/fenrg.2021.655733
Wang, Z., Cui, C., and Peng, S. (2019). How do urbanization and consumption patterns affect carbon emissions in China? A decomposition analysis. J. Clean. Prod. 211, 1201–1208. doi:10.1016/j.jclepro.2018.11.272
Wang, Z. H., Liu, W. L., and Yin, J. H. (2015). Driving forces of indirect carbon emissions from household consumption in China: An input-output decomposition analysis. Nat. Hazards 75, S257–S272. doi:10.1007/s11069-014-1114-7
Wang, Z. H., and Yang, Y. T. (2016). Features and influencing factors of carbon emissions indicators in the perspective of residential consumption: Evidence from beijing, China. Ecol. Indic. 61, 634–645. doi:10.1016/j.ecolind.2015.10.015
Wu, Y. M., Sun, H., Sun, H. L., and Xie, C. (2022). Impact of public environmental concerns on the digital transformation of heavily polluting enterprises. Int. J. Environ. Res. Public Health 20, 203. doi:10.3390/ijerph20010203
Xie, C., Wang, R., and Gong, X. X. (2022). The influence of environmental cognition on green consumption behavior. Front. Psychol. 13, 988585. doi:10.3389/fpsyg.2022.988585
Xu, X. K., Han, L. Y., and Lv, X. F. (2016). Household carbon inequality in urban China, its sources and determinants. Ecol. Econ. 128, 77–86. doi:10.1016/j.ecolecon.2016.04.015
XuanMaShang, D. X. Y. (2020). Can China's policy of carbon emission trading promote carbon emission reduction? J. Clean. Prod. 270, 122383. doi:10.1016/j.jclepro.2020.122383
Yuan, B., Ren, S., and Chen, X. (2015). The effects of urbanization, consumption ratio and consumption structure on residential indirect CO2 emissions in China: A regional comparative analysis. Appl. Energy 140, 94–106. doi:10.1016/j.apenergy.2014.11.047
Zhou, B., Zhang, C., Song, H., and Wang, Q. (2019). How does emission trading reduce China’s carbon intensity? An exploration using a decomposition and difference-in-differences approach. Sci. Total Environ. 676, 514–523. doi:10.1016/j.scitotenv.2019.04.303
Keywords: household carbon emissions, energy conservation and emission reduction policies, fixed-effect model, new energy public buses, western areas
Citation: Luo J, Yang J, Wan S, Zhao J and Liang J (2023) Can energy conservation and emission reduction policies affect household carbon emissions? Evidence from China. Front. Energy Res. 11:1138467. doi: 10.3389/fenrg.2023.1138467
Received: 05 January 2023; Accepted: 01 February 2023;
Published: 09 February 2023.
Edited by:
Shulei Cheng, Southwestern University of Finance and Economics, ChinaReviewed by:
Wei Fan, Southwestern University of Finance and Economics, ChinaXiaoxiao Gong, Guizhou University, China
Chi Xie, Hunan Normal University, China
Copyright © 2023 Luo, Yang, Wan, Zhao and Liang. This is an open-access article distributed under the terms of the Creative Commons Attribution License (CC BY). The use, distribution or reproduction in other forums is permitted, provided the original author(s) and the copyright owner(s) are credited and that the original publication in this journal is cited, in accordance with accepted academic practice. No use, distribution or reproduction is permitted which does not comply with these terms.
*Correspondence: Siyu Wan, d2Fuc2l5dW5vdHRpbmdoYW1AZ21haWwuY29t