 Jiting Gu1
 Shuai Wang
 Yangbo Ou
95% of researchers rate our articles as excellent or good
Learn more about the work of our research integrity team to safeguard the quality of each article we publish.
Find out more
ORIGINAL RESEARCH article
Front. Energy Res. , 11 April 2023
Sec. Smart Grids
Volume 11 - 2023 | https://doi.org/10.3389/fenrg.2023.1136753
This article is part of the Research Topic Optimal Planning, Operation, and Control for Multi-energy Microgrid View all 6 articles
This paper proposes a two-stage planning method of distributed generation based on coordinated recovery of load partition to improve the resilience of the power grid in extreme weather. The method includes a scenario generation model and an optimization model. In the first stage, a scenario generation model is established, including the distributed generation output and line failure models, to obtain the power output and line status in different scenarios with different weather. Then, an optimal subnetwork screening robust optimization model is built to screen the optimal subnetworks for the deployment of distributed generation in each scenario. In the second stage, a node location optimization model is developed to obtain the optimal node locations for deploying distributed generation within the subnetwork, aiming at maximizing the recovery efficiency of critical loads. Case studies based on a modified IEEE 30-bus system are used to demonstrate the effectiveness of the proposed method. The findings show that the recovered load and recovery efficiency of the power system can be significantly improved.
Extreme disasters have occurred frequently in recent years, seriously endangering the safe and stable operation of power systems (Ummenhofer and Meehl, 2017). Power systems are often subjected to large-scale cracking after being affected by damage to lines, towers, or electrical equipment under extreme disasters (Geng et al., 2021), triggering major power outages and causing huge economic losses (Ma et al., 2016; Chang and Liu, 2021). At this time, it often happens that there is an insufficient power supply for important loads and no power supply for general loads within each subnetwork of the power grid, and it is impossible to exchange power with the outside world through contact lines for a short period of time. In such cases, we can only restore the power supply to the important loads as much as possible through the existing distributed power sources and undamaged lines. Therefore, for this situation, advance planning of the specific location of distributed power sources in the grid is necessary to enhance the resilience of the grid. At the same time, deep decarbonization of the power system is imperative (Chen et al., 2020). In the context of the new power system with new energy sources as the mainstay, the proportion of outbound clean power and local distributed generation (DG) in the urban grid will increase and take a dominant position. When compared with the traditional distribution grid, DG sources not only have the characteristics of flexibility, environmental protection, and economy but can also continue to supply power to the load in case of grid failure. Power system resilience is the ability of the power system to prevent, resist, and quickly recover from small probability–high loss extreme disasters (Bie et al., 2020). Improving the power system resilience (Li et al., 2019) can greatly reduce the adverse effects of extreme disasters on people’s life and property safety.
During extreme weather, the available DG in the urban grid can become an important support for the black start of the grid and contribute to the resilience of the urban grid. Therefore, for different disaster types after an extreme disaster, studying the role of DG in the grid recovery process and planning the location of DG rationally would help improve the resilience level of the urban grid. Load partition recovery, as a load recovery strategy, could quickly and reliably restore power to important loads and enhance the level of system resilience during the post-disaster recovery phase.
For power planning, scholars have focused on improving the economy and reliability of power systems. In terms of economics, Qing et al. (2014), Zhang et al. (2015), and Ding et al. (2019) have established a power system planning model to reduce the integrated costs and network losses and maximized the net system benefits. In terms of reliability, Shi et al. (2018) and Wang et al. (2021) have studied the impact of the DG type, location, capacity, and output characteristics on reliability. Traditional black-start power sources, such as hydroelectricity, are under great pressure to meet urban water use and ensure power supply during the dry season. DG, which includes distributed wind turbines (DWT), DPV, and energy storage devices, can be used as a better black-start power to participate in the post-failure black start. It has the characteristics of economy, environmental protection, flexible load regulation and convenient opening, and cutting machine. Ali et al. (2020a) used the improved decomposition-based evolutionary algorithm to select the number of DGs and their capacities along with the best location, all of which effectively minimize the real power losses and voltage deviations and maximize the voltage stability index. Ali et al. (2020b) proposed a novel method to find the optimal feeder reconfiguration (OFR) of the radial distribution network along with optimal site and size of distributed generation (DG) with an objective of power loss reduction. Yin et al. (2022) proposed a two-stage adaptive robust optimization framework DDARDGP for microgrid utility to investigate the DG planning strategy that includes the category, type, number, and location decisions, which effectively avoids excessive conservatism while keeping the costs well down.
For the recovery of load partitioning, scholars have focused their research on partitioning methods using different indexes. Sun et al. (2015) grouped units with the objective of the fastest power delivery from the black-start power source to the units to be recovered, which accelerated system recovery, but did not consider the importance of different loads and recovery line security. Li et al. (2018) proposed a comprehensive and practical parallel recovery strategy based on an improved label propagation algorithm that reflects the tightness of connections between nodes, but not the security of line power delivery. Yida et al. (2020) considered the recovery cost of DG with the units to be recovered and the importance of the different loads, but did not consider the coordination of the loads in each partition. Gu et al. (2009) grouped units with the objective of having the closest electrical distance from the black-start power to the unit to be recovered, and partitioned the system with the least power on the contact line and the least loss in each partitioned network. But, it however did not consider the importance of each load node and the safety of the restoration line. Shi et al. (2011) assumed that the units could recover all loads. It considered the safety and rapidity of the path from the unit to be recovered and load to the black-start power source, and the restoration time and size of each partition. However, this method is not applicable when the unit may cannot meet all load recovery requirements when extreme disasters occur. Zhao et al. (2023) divided the power system recovery partition based on the improved label propagation algorithm and proposed a multi-black-start power distribution optimization method with zonal recovery, which not only reduced the outage time but also improved the restoration efficiency. Li et al. (2021) proposed a partition scheme of islands and put forward the black-start strategy of DG to continue to supply power to the loads, and it effectively reduced the power outage loss. Zhang et al. (2022) proposed a multi-objective cluster partition method considering the uncertainty of sources and loads and constructed a multi-objective cluster partition model with cluster economic cost, net power complementarity, control dimension, and corresponding constraints, which rationalized resource allocation and reduced economic costs.
From the abovementioned studies, the existing DG planning is mainly aimed at economy and reliability, and the planning context usually applies to a situation where each line is intact. Fewer studies have been conducted on power location deployment with the goal of load restoration levels in the case of line damage where power cannot be resupplied within a short period of time. Similarly, as a common recovery strategy, the parallel partitioning strategy also does not consider how to partition when the power output of each subnetwork is less than the load after a disaster. Finally, in this context, there are fewer studies on combining load zoning strategies with power supply planning to accelerate load recovery efficiency while planning power supply locations to achieve higher levels of load recovery. Thus, DG cannot be effectively used to achieve rapid system recovery, which is not conducive to extreme disaster resilience of the system.
In response to the abovementioned shortcomings, this article proposes a distributed power planning method based on the coordinated recovery of load partitioning under extreme weather. Firstly, the distributed power output and line damage probability are determined by the type of disaster, and a series of disaster scenarios are generated through Monte Carlo simulation. Then, considering the uncertainty of DG and load, an optimal subnetwork screening robust optimization model is established with the objective of maximizing the recovered load in the system. Then, the DG node location optimization model is established considering the load importance, recovery path security, rapidity, and coordination of load recovery in each partition. The model aims to maximize the recovery value from each unit to be recovered to the black-start power source and from each load to the unit. Finally, a two-stage planning method for DG is developed based on load partitioning coordinated recovery under extreme weather. The method can be used to optimize the location of DG to enhance the level of resilience of the power system. The key contributions of this article are summarized as follows, firstly, considering the uncertainty of power and load output, a robust optimization model for optimal subnetwork is established to maximize the sum of the recovered load in each subnetworks; it screens the most suitable subnetwork for deploying DG under the worst-case scenario of power and load output in each subnetwork; and the uncertainty of DG and load output is represented by the set of scenarios containing the uncertainty intervals.
Secondly, the partitioning strategy, which includes unit grouping and load partitioning, is improved to ensure recovery speed, safety, and coordination of loads; it is partitioned based on the maximum recovery value of the unit and load while considering the matching of unit generation and load.
Thirdly, in order to improve the level and efficiency of load recovery, an optimization model for the node location of DG is established; it determines the optimal deployment node for distributed power by comparing the recovery value of distributed power when deployed at different nodes.
The focus of this article is on the urban grid containing WT and PV distributed power sources, and the scenario in this study is a situation where WT, PV, and lines are damaged in extreme weather and the damage cannot be repaired in the short term. The main models constructed in this section include the line fault probability model, distributed wind power, and PV power output model.
The failure probability of the lines and power output of DG vary between different disasters (Li et al., 2016). In this study, only typical typhoons and heavy rainfall are considered in extreme weather, and the line and unit output data under the corresponding weather are generated by the line fault probability model and unit output model. DGs used in this study are distributed photovoltaic power (DPV), DWT, and conventional distributed generation (CDG). DG to be planned is CDG.
The fault probability vector of the line is defined as
where i represents the line number and
The power output vector of DPV at each node is defined as
where N1 represents the number of nodes and
The power output vector of DWT at each node is defined as
where
The power output vector of the CDG at each node is defined as
where
Differences in the type and level of extreme disasters play an important impact in the extent of damage to distributed power supplies (Wang et al., 2013; Li et al., 2015). In this study, it is assumed that all DWTs are damaged while DPVs are still partially generating electricity after typhoons; similarly, it is assumed that all DPVs are damaged while DWTs are still partially generating electricity after a stormy weather. In this way, the DG output model after a typhoon and rainstorm is established.
The damage rate of DPV under the different levels of a typhoon is defined as shown in Table 1.

TABLE 1. DPV survival rate under different levels of typhoon.
The output of the distributed PV under the different levels of a typhoon is calculated by Eq. 5 as
where
The damage rate of a DWT under the different levels of a typhoon is defined as shown in Table 2.

TABLE 2. DWT survival rate under different levels of stormy weather.
The power output of the DWT can be calculated by Eq. 6 as
where
The probability of line failure varies with the type and level of disaster. The probability of line failure under different levels of typhoons and rainstorms can be calculated according to Eq. 7 as
where
Monte Carlo simulations (Zhang et al., 2007) are performed based on the statistical data under different disasters, and the number of simulations is set to M.
Finally, the fault state vector S of all lines is obtained as shown in Eq. 9. Then, the nodes and lines contained in each subnetwork are obtained based on the line status.
In this study, we propose a two-stage planning model (Ma et al., 2021; Ma et al., 2022) for distributed power considering the coordinated recovery of load zoning, consisting of an optimal subnetwork screening model and an optimal node location planning model; the type of DG to be planned is conventional distributed power and the planned quantity is
The first stage is to screen the subnetworks for DG deployment with the objective of maximizing the overall system load level, and the objective function is shown in Eq. 14 and the decision variable is the deployment selection of the subnetworks. After the screening of the deployment subnetwork is completed in the first stage, the second stage further selects specific nodes within the subnetwork for distributed power deployment with the objective of maximizing the recovery value of each node within the subnetwork, and the objective function is shown in Eq. 13, which consists of two parts: the recovery value of the node of the unit to be recovered (as shown in Eq. 14) and recovery value of the load node (as shown in Eq. 19); the decision variables of the whole second-stage objective function are the locations of the distributed power deployment nodes, the unit grouping method, and the load division method.
The model aims to recover as much load as possible by selecting the subnetworks where distributed power is deployed, considering the load recovery coordination and robustness of each subnetwork. This optimization model is a mixed-integer linear program and can be expressed as follows:
where
The linearization procedure for the first equation in (11) is as follows:
where M represents very large positive numbers.
The magnitude and fluctuation of the power output of DPV and DWT vary under different disaster levels. Therefore, the fluctuation interval of DWT, DPV, and load under the current disaster scenario are characterized by
where
Based on the optimal subnetwork screened in Section 3.1, to ensure the recovery speed, safety, and coordination of units and loads, the model selects the node with the largest recovery value in the subnetwork to deploy distributed power sources; it mainly consists of a unit grouping planning model and load partitioning planning model, both of which are mixed integer linear optimization models.
The objective function of the node location optimization model is as follows:
where T represents the node set of the subnetwork; j represents the serial number of the subnetworks; t is the node deploying DG in the subnetwork.
With the objective of getting the maximum restoration value, we group DG and the units to be recovered; based on this grouping approach, the recovery value is calculated to obtain the optimal node when the distributed power supply is located at different nodes. This model can be expressed as follows:
where
The constraint of this model is formulated as follows:
Black-start power constraint (Liu et al., 2008; Sarmadi et al., 2011): comparing the number of black-start power and loads, the number of partitions in the subnetwork j is equal to the smaller one:
where
Unit grouping constraint: each unit to be recovered can belong to only one partition.
Unit start-up power constraint (Xueping et al., 2020): there is at least one unit to be recovered in the partition whose starting power is less than 70% of the rated power of the black-start unit.
where
In order to obtain the maximum recovery value, we partition the loads and units; based on this partitioning method, the recovery value is calculated to obtain the optimal node when DG is located at different nodes. This model can be expressed as follows:
where
The constraint of this model is formulated as follows:
Load Partition constraints: each load belongs to only one partition:
The minimum unit output constraint (Shu et al., 2013) is
where
The load coordination constraints are
where
The optimal subnetwork screening model and optimal node optimization model are solved, and the optimal node locations in all disaster scenarios are counted and sorted in the descending order by the number of each node; then, the node in the top of the ranking is taken as the optimal planning location for DG and is the number of distributed power sources to be planned. The planning flow chart is shown in Figure 1.
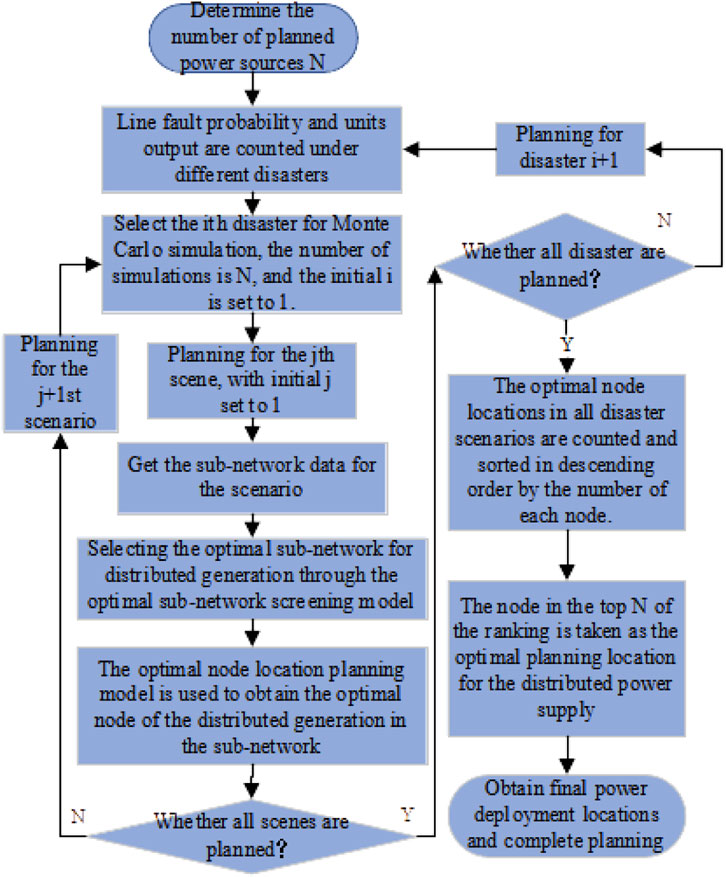
FIGURE 1. Planning flow chart of the proposed method.
After completing the power planning based on system partition recovery, the next step is to restore the power supply of critical loads in each partition; this phase aims to determine the priority of each load restoration and then restore the high-priority loads in the shortest time.
From Section 2.1, it is known that the output of generating units in each subnetwork may not meet the demand of all loads; it is therefore necessary to select the loads with higher importance to restore first. In a real implementation, the prioritization of loads is mainly based on the first-, second-, and third-level loads classified by the load level, importance of the load node, and size of the load value. Therefore, we propose a recovery load screening model:
where
The load recovery process refers to the islanding technique (Xin and Yuping, 2006) and has the following steps:
Step 1: the load obtained from the load screening model is the target load, which is sorted in the descending order based on the importance to obtain the sequence of load recovery.
Step 2: the optimal path from the black-start unit to the unit to be recovered is searched by the Dijkstra algorithm (Wang et al., 2011), and the recovery order of the units to be recovered is determined by the rapidity and security of their paths to the black-start units.
Step 3: after selecting the units that have to be prioritized for recovery, whether the recovery path contains the target load is judged: if yes, to go to the next stage; if no, to go to step 5.
Step 4: to determine if the black-start power can restore the unit to be recovered after restoring the load contained in the path: if yes, restore the load and then the unit to be recovered and go to step 6, if no, go to step 5.
Step 5: the unit to be recovered is started directly.
Step 6: the black-start power source, recovered units, and load are used as the new black-start power source. Repeat step 3 until all units to be recovered have been recovered.
Step 7: based on the method in steps 3–6, the load with the highest current recovery priority is recovered. Repeat this step until all loads are recovered.
The total recovery time, starting with the first load recovery and ending with the recovery of all loads, is calculated as follows:
where
The two-stage model solution in this study includes the solution of the optimal subnetwork screening model in the first stage and the solution of the optimal node location planning model in the second stage.
The one-stage optimal subnetwork screening model belongs to the max–min model, whose model can be simplified and summarized as follows:
where x denotes the one-stage decision variable,
Then, the duality of the inner layer problem is solved to turn the optimization directions of the two layers to be the same, and the transformed problem is as follows:
The contained objective function of the pairwise problem is a non-linear term. Setting
At this point,
Ultimately, the abovementioned Eqs 45–47 can be simplified as
where H, T, and R represent the constraint matrix of Eq. 45.
Up to this point, the objective function (48), constraints (41–44), and (49–50) constitute the new problem. The optimal subnetwork deployment location is obtained by solving the model with the Gurobi solver.
Based on the optimal subnetwork obtained in the first stage, the second stage optimization is performed within this subnetwork. The two-stage optimal power supply location planning model can also be simplified and summarized as follows, where
The final node location of DG is obtained by completing the abovementioned two stages of solution.
Case studies have been conducted on a modified 30-bus test system to demonstrate the advantages of the proposed two-stage planning method. The diagram and detailed information about the modified 30-bus system is given in Figure 2; Table 3 and Table 4. The case assumes that there are two CDG to be planned as black-start power and the context is a two-level storm disaster.
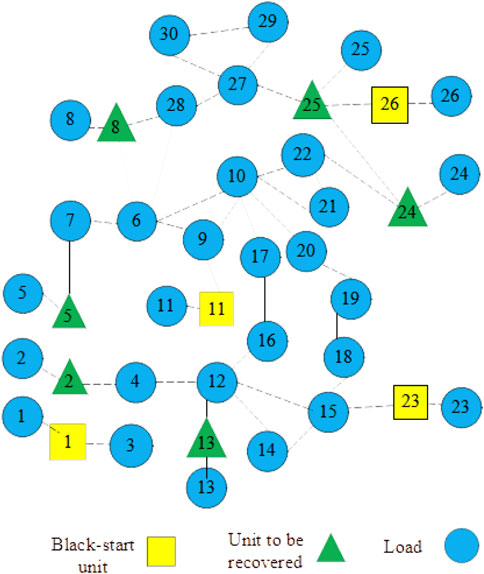
FIGURE 2. Modified IEEE 30-bus system.
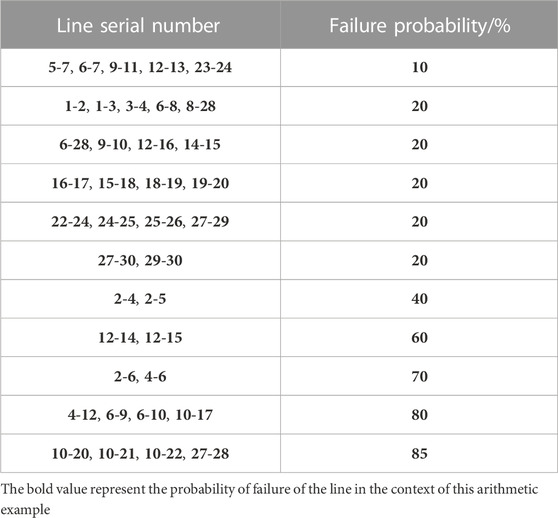
TABLE 3. Line fault probability.
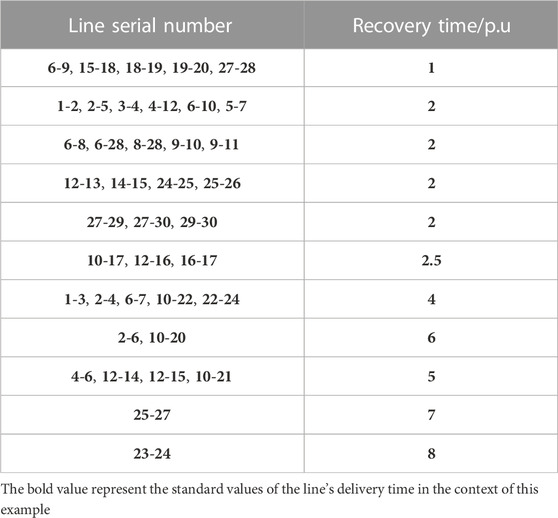
TABLE 4. Line recovery time.
According to Section 2.2 power output model and Section 2.3 line fault probability model, the power output and line fault probability under the two-level storm disaster are obtained; the line cracking scenario after the disaster is generated by the Monte Carlo simulation method given in Section 2.3 that is shown in Figure 3.
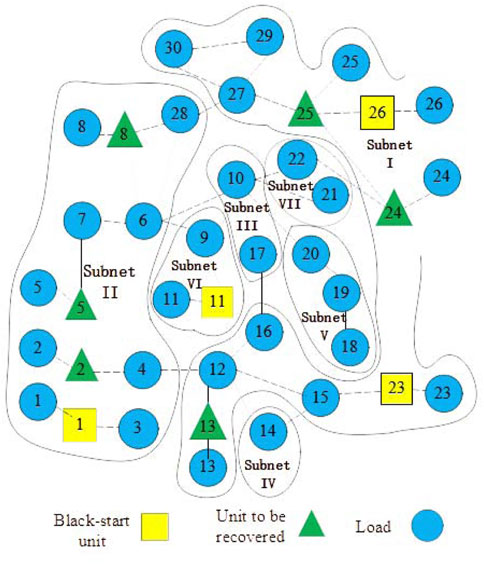
FIGURE 3. Post-disaster line cracking scenario.
From Figure 3, the power system is cracked into seven subnetworks after the disaster, and the optimal subnetworks screening model shows that the recovered load is the largest when DG is deployed in subnetworks I and V. The load recovery values of each subnetwork at this time are shown in Table 5.
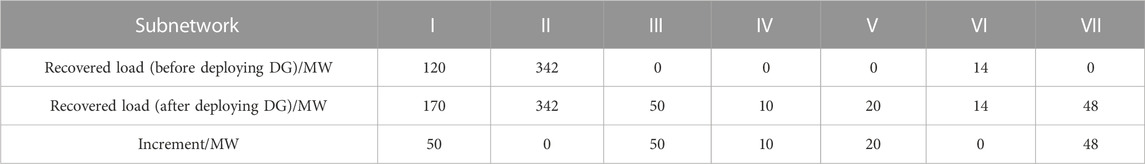
TABLE 5. Load recovery value.
As seen from Table 5, the recovered load is enhanced after deploying distributed generation in subnetworks I, III, IV, V, and VII, and the most significant enhancement is achieved in I and III.
At the same time, based on the same data, the node locations are planned using the model in this study without considering the case of disasters leading to grid splitting, and the maximum recovering value of load is obtained when the nodes are deployed at nodes 6 and 12, at which time, the recovered load of each subnetwork is as shown in Table 6.
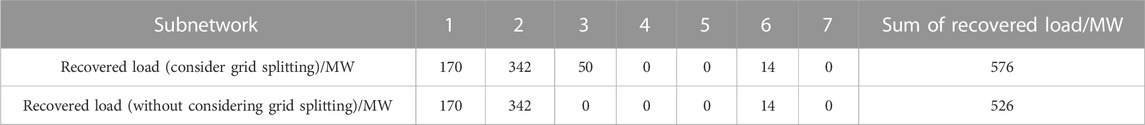
TABLE 6. Comparison of load recovery values.
As seen from Table 6, the load recovery value of the grid is significantly reduced due to the planning of power supply without considering the grid splitting under disasters and is not conducive to the resilience of the grid.
After obtaining the optimal deployment subnetworks, the optimal nodes for deploying distributed power are obtained in these subnetworks by a node location optimization model.
Subnetwork I: there are two original black-start powers and three units to be recovered in subnetwork I; the DGs are deployed at different load nodes in order and compared for the maximum recovery value of the subnetwork; the results obtained are shown in Table 7.
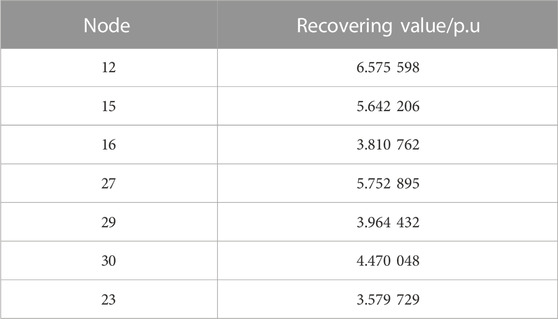
TABLE 7. Maximum recovery value of subnetwork.
From the table, it can be seen that the recovery value is the greatest when DG is deployed at node 12, whose unit grouping and load partitioning are shown in Figure 4.
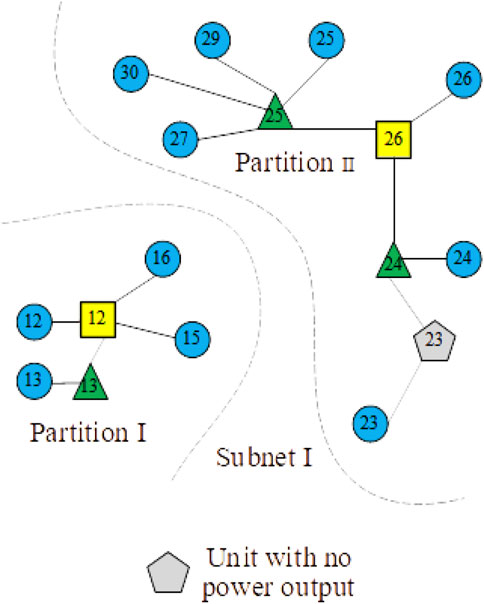
FIGURE 4. Group diagram and partition diagram of subnet Ⅰ.
Two partitions exist in subnetwork I: before and after the adoption of the improved load partitioning strategy; the comparison of generation and load values during the two partitions is shown in Table 8.
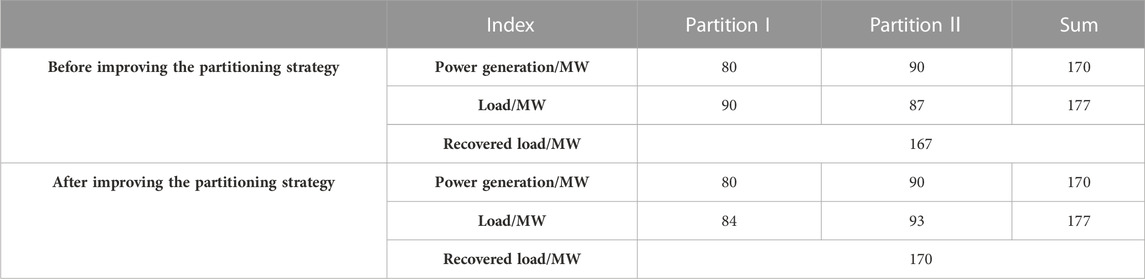
TABLE 8. Generation and load values for each partition.
The traditional partitioning strategy (Lin et al., 2009; Guangqi et al., 2019) usually does not consider scenarios where lines are severely damage after a disaster and cannot be recovered in a short period of time. Due to the damage to lines, insufficient power supply occurs in the partitions and the power balance constraints cannot be met. Based on the improved partitioning strategy, critical loads can be assigned to the units with the closest path and highest recovery security. Based on the generation value of each partition, the load distribution ratio is adjusted, therefore the generation capacity of each partition is not wasted and the load recovery value is increased.
Subnetwork III: there is no black-start power and units to be recovered in subnetwork 3. Under the deployment constraint of the distributed power, there is no need to group the units and partition the load; the black-start power can be deployed sequentially in different nodes to obtain the maximum recovery value of the subnetwork as shown in Table 9.

TABLE 9. Maximum recovery value of subnetwork.
From the table, it can be seen that the recovery value is the greatest when DG is deployed with node 10, whose unit grouping and load partitioning are shown in Figure 5.
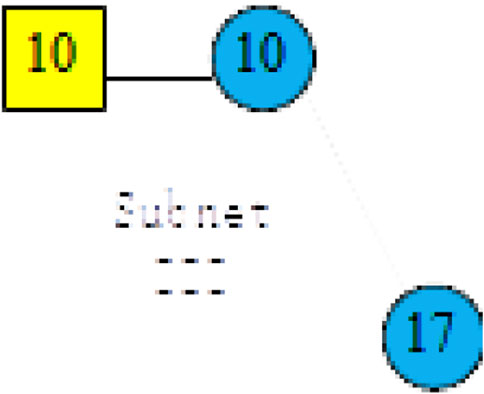
FIGURE 5. Group diagram and partition diagram of subnet Ⅲ.
After partitioning is completed, the model with high importance is selected for priority recovery by the load screening model. The priority recovery nodes of load in subnetworks I and III are shown in Table 10.

TABLE 10. First and third priority recovery load nodes of subnetworks.
Before and after deploying DG in subnetworks I and III, the recovery times are shown in Table 11.

TABLE 11. Recovery time of each partition of subnetworks I and III.
Before and after deploying DG in subnetwork I, the load recovery values at different moments are shown in Figure 6.
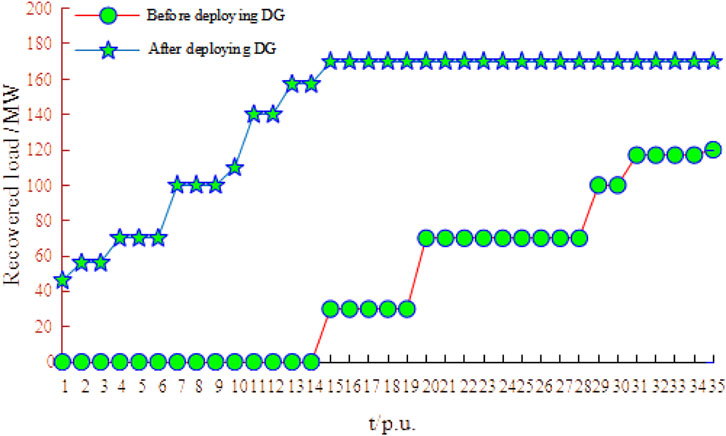
FIGURE 6. Recovered load curve.
From Figure 6 and Table 10, after and before deploying DG, the load recovery time and load recovery value of subnetwork I was 35 and 120 MW, while the load recovery time and load recovery value in the case of DG deployment were 17 and 170 MW, respectively, corresponding to a 42.85% reduction in recovery time and a 41.6% increase in the load recovery value. Therefore, after deploying DG at subnetwork I and using the zonal recovery not only improved the load recovery value and accelerated the load recovery speed but also resulted in a significant increase in load recovery efficiency. Similarly, when compared to the inability to recover the load before deploying distributed power, the recovery efficiency of subnetwork III was also improved after the deployment of distributed power.
The optimal nodes of the subnetworks in all different disaster scenarios are counted; the number of each node and its percentage are calculated; the top two nodes with the highest number are the optimal black-start power deployment nodes; the statistics are shown in Table 12 and Figure 7.
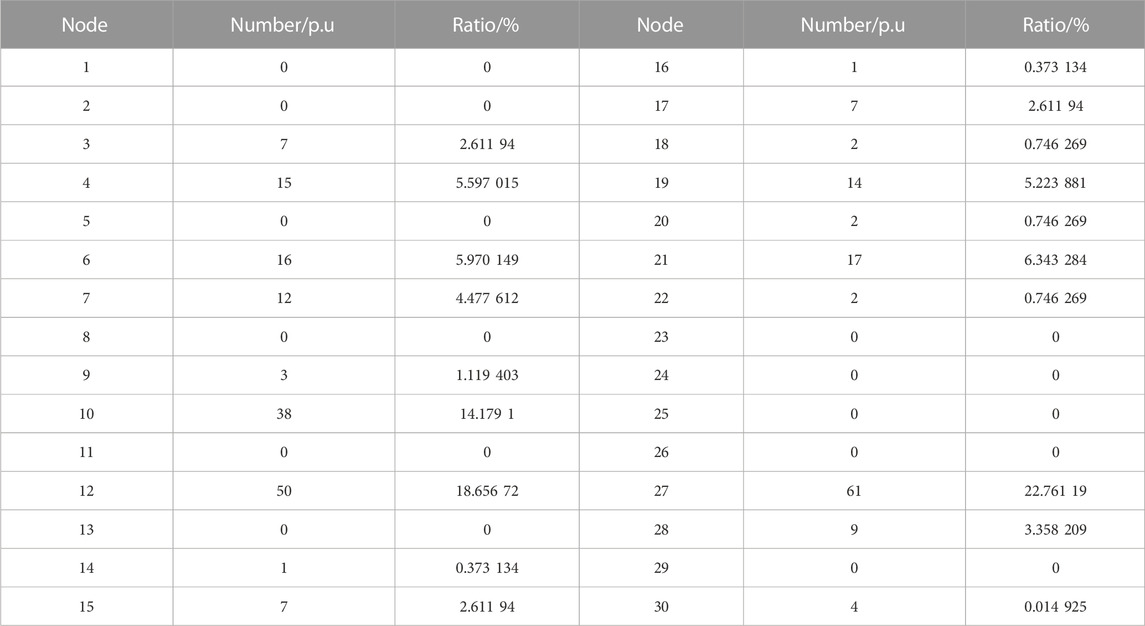
TABLE 12. Frequency and proportion of each node as the optimal node.
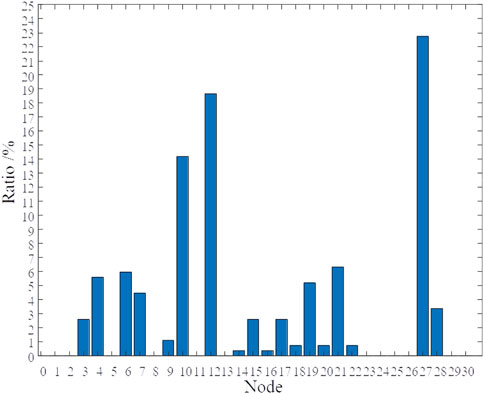
FIGURE 7. Recovered load curve.
Since this study uses the number of simulated scenarios to represent the probability of an event occurring, the higher the percentage of nodes, the more often it is used as the best deployed node in the scenario. From Table 11 and Figure 7, it is seen that nodes 27 and 12 are the nodes with the highest number, and their percentages are 22.761% and 18.657%, respectively. This example sets the number of power supplies to be deployed as 2, therefore prioritizing the deployment of distributed power at this location is most beneficial to the load recovery of the power system after disasters. All of this demonstrates the effectiveness of deploying DGs on power system resilience improvement.
Meanwhile, the research method proposed in this study still has some limitations
Firstly, the line fault model in this study has to obtain the historical base fault probability of the line and then derive the fault probability of the line under different disasters based on this. When the base historical failure probability is inaccurate or incomplete, the model cannot effectively quantify the line status for different levels of extreme weather. Secondly, this study lacks the historical probability data for different levels of extreme weather, therefore the accuracy of the final power deployment location will be affected, and this location is determined by the probability of each extreme weather and the optimization results under that weather.
This study proposes a two-stage planning method for DG based on the coordinated recovery of load partitioning under extreme weather conditions. The method plans the location of DG by establishing the optimal subnetwork screening model and the node location optimization model. Analyzing the modified IEEE 30-bus system, we obtain the following conclusions:
By deploying distributed generation at the optimal nodes of the optimal subnetwork, the load recovery level and the load recovery efficiency of the system can be effectively improved, and the improved zoning strategy within the subnetwork can not only improve the load recovery efficiency but also ensure the priority recovery of important loads. In addition, the research methodology of this study relies heavily on line historical basic fault probability data and extreme weather occurrence probability data, therefore the completeness and accuracy of the data will significantly affect the final power deployment results.
The original contributions presented in the study are included in the article/supplementary material; further inquiries can be directed to the corresponding author.
Conceptualization: JG; methodology: JG and SW; software: SW; validation: JG and SW; formal analysis: JG; investigation: JG; data curation: JG; writing—original draft preparation: JG; writing—review and editing: JG and YO; supervision: JG. All authors have read and agreed to the published version of the manuscript.
This work is supported by the Science and Technology Project of State Grid Zhejiang Electric Power Co., Ltd. (No. 2021ZK30).
JG was employed by the Power Economic Research Institute, State Grid Zhejiang Electric Power Company.
The remaining authors declare that the research was conducted in the absence of any commercial or financial relationships that could be construed as a potential conflict of interest.
The authors declare that this study received funding from State Grid Zhejiang Electric Power Co., Ltd. The funder had the following involvement in the study: Conceptualization, methodology, validation, formal analysis, investigation, data curation, writing—original draft preparation, writing—review and editing, supervision.
All claims expressed in this article are solely those of the authors and do not necessarily represent those of their affiliated organizations, or those of the publisher, editors, and reviewers. Any product that may be evaluated in this article, or claim that may be made by its manufacturer, is not guaranteed or endorsed by the publisher.
Ali, A., Keerio, M. U., and Laghari, J. A. (2020). Optimal site and size of distributed generation allocation in radial distribution network using multi-objective optimization. J. Mod. Power Syst. Clean Energy 9 (2), 404–415. doi:10.35833/mpce.2019.000055
Ali, A., Keerio, M. U., and Mugheri, N. H. (2020). Constrained composite differential evolution search for optimal site and size of distributed generation along with reconfiguration in radial distribution network. Mehran Univ. Res. J. Eng. Technol. 39 (4), 705–718. doi:10.3316/informit.459004632600951
Bie, Z., Lin, C., Li, G., and Qiu, A., (2020). Development and prospect of resilient power system in the context of energy transition[J]. Proc. CSEE 40 (9), 2735–2745. doi:10.13334/j.0258-8013.pcsee.191705
Chang, Z., and Liu, Y. (2021). Analysis on Brazilian power grid restoration after “March 21” blackout[J]. Power Syst. Technol. 45 (3), 1078–1088. doi:10.13335/j.1000-3673.pst.2020.0571
Chen, G., Dong, Y., and Liang, Z. (2020). Analysis and reflection on high-quality development of new energy with Chinese characteristics in energy transition[J]. Proc. CSEE 40 (17), 5493–5505. doi:10.13334/j.0258-8013.pcsee.200984
Ding, M., Fang, H., Bi, R., Liu, X., Pan, J., Zhang, J., et al. (2019). Optimal siting and sizing of distributed PV-storage in distribution network based on cluster partition[J]. Proc. CSEE 39 (8), 2187–2201. doi:10.13334/j.0258-8013.pcsee.180757
Geng, L. U., Jing, D., Yuhong, W., Jing, C., and Yunfeng, Y., (2021). Analysis of power system affected by extreme weather and its adaptive strategy[J]. Power Gener. Technol. 42 (6), 751. doi:10.12096/j.2096-4528.pgt.21059
Gu, X. P., Han, Z. H., and Liang, H. P. (2009). Optimization of parallel restoration through power system partitioning after blackout[J]. Proc. CSEE 29 (10), 41–46. doi:10.1109/MILCOM.2009.5379889
Guangqi, Z., Xueping, G. U., and Shiying, M. A. (2019). Restoration subsystem division based on integer linear programming and compre-hensive evaluation of dividing schemes[J]. Electr. Power Autom. Equip. 39 (1), 91–98. doi:10.16081/j.issn.1006-6047.2019.01.014
Li, C., Zhang, P., Xu, Y., He, J., Ni, P., Feng, L., et al. (July 2018). Development of parallel restoration strategy for chongqing power system in China[C]//Proceedings of the 2018 IEEE 8th annual international conference on CYBER Technology in automation, control, and intelligent systems (CYBER). IEEE, 1200–1204. Tianjin, China. doi:10.1109/CYBER.2018.8688155
Li, G., Qiu, A., and Huang, G. (2019). New challenges and future research prospects in power system against to extreme events[J]. Smart Power Secur. 47 (8), 1-7. doi:10.3969/j.issn.1673-7598.2019.08.001
Li, J., Xiao, Q., He, G., and Fu, Y. (2021). Distribution network island partition and black-start based on distributed generation Journal of physics: Conference series. IOP Publ. 1871 (1), 012044. doi:10.1088/1742-6596/1871/1/012044
Li, P., Guan, X., Wu, J., and Zheng, H., (2015). Analyzing characteristics of aggregated wind power generation based on weather regime classification[J]. Power Syst. Technol. 39 (7), 1867–1872. doi:10.13335/j.1000-3673.pst.2015.07.016
Li, S., Shi, Q., and Zhao, W. (2016). A multi-objective optimization based bidding model with vehicle-to-grid reserve provision considered[J]. Automation Electr. Power Syst. 40, 77–83. doi:10.7500/AEPS20150209011
Lin, Z. Z., Wen, F. S., and Zhou, H. (2009). A new algorithm for restoration subsystem division based on community structure of complex network theory[J]. Automation Electr. Power Syst. 33 (12), 12–16. doi:10.3321/j.issn:1000-1026.2009.12.003
Liu, Y., Wu, W., and Feng, Y. (2008). Black-start zone partitioning based on ordered binary decision diagram method[J]. Proceedings-chinese soc. Electr. Eng. 28 (10), 26. doi:10.3321/j.issn:0258-8013.2008.10.005
Ma, S., Chen, B., and Wang, Z. (2016). Resilience enhancement strategy for distribution systems under extreme weather events. IEEE Trans. Smart Grid 9 (2), 1442–1451. doi:10.1109/TSG.2016.2591885
Ma, Y., Xie, K., Zhao, Y., Yang, H., and Zhang, D., (2021). Bi-objective layout optimization for multiple wind farms considering sequential fluctuation of wind power using uniform design[J]. CSEE J. Power Energy Syst. 23, doi:10.17775/CSEEJPES.2020.03350
Ma, Y., Xu, W., Yang, H., and Zhang, D. (2022). Two-stage stochastic robust optimization model of microgrid day-ahead dispatching considering controllable air conditioning load. Int. J. Electr. Power and Energy Syst. 141, 108174. doi:10.1016/j.ijepes.2022.108174
Qing, Z., Nanhua, Y., Wen, S., Xudong, S., Chunfang, L., Han, Z., et al. (2014). Distribution generation programming and economical analysis of active distribution network[C]. Proc. CSU-EPSA 26 (11), 82–86. doi:10.3969/j.issn.1003-8930.2014.11.017
Sarmadi, S. A. N., Dobakhshari, A. S., Azizi, S., and Ranjbar, A. M. (2011). A sectionalizing method in power system restoration based on WAMS. IEEE Trans. Smart Grid 2 (1), 190–197. doi:10.3969/j.issn.1005-2992.2013.01.004
Shi, L. B., Chi, D. Y., Yao, L. Z., and Ni, Y. X., (2011). Intelligent optimization strategy for load restoration considering power grid partitioning[J]. Power Syst. Prot. Control 39 (2). doi:10.3969/j.issn.1674-3415.2011.02.001
Shi, L., Zhao, B. B., Xu, X. M., and Wang, Y. (2018). Influence of distributed generations on calculation of reasonable power loss benchmark in regional distribution system[C]. Proc. CSU-EPSA 30 (10), 136–142. doi:10.19635/j.cnki.csu-epsa.000065
Shu, H., Gao, L., Duan, R., Cao, P., and Zhang, B., (2013). A novel hough transform approach of fault line selection in distribution networks using total zero-sequence current[J]. Dianli Xit. Zidonghua Automation Electr. Power Syst. 37 (9), 110–116. doi:10.7500/AEPS201206098
Sun, L., Zhang, C., and Lin, Z. (2015). Two-step strategy for black-start zone partitioning of power system after blackout[J]. Electr. Power Autom. Equip. 35 (9), 14–21. doi:10.16081/j.issn.1006-6047.2015.09.003
Tan, Y. J., Wu, J., and Deng, H. Z. (2006). Evaluation method for node importance based on node contraction in complex networks[J]. Syst. Engineering-Theory Pract. 11 (11), 79–83. doi:10.3321/j.issn:1000-6788.2006.11.011
Ummenhofer, C. C., and Meehl, G. A. (2017). Extreme weather and climate events with ecological relevance: A review. Philosophical Trans. R. Soc. B Biol. Sci. 372 (1723), 20160135. doi:10.1098/rstb.2016.0135
Wang, F., Mi, Z., Zhen, Z., Yang, G., and Zhou, H., (2013). A classified forecasting approach of power generation for photovoltaic plants based on weather condition pattern recognition[J]. Proc. CSEE 33, 75–82. doi:10.13334/j.0258-8013.pcsee.2013.34.013
Wang, H., Yu, Y., and Yuan, Q. (July 2011). Application of Dijkstra algorithm in robot path-planning[C]//Proceedings of the 2011 second international conference on mechanic automation and control engineering. IEEE, 1067–1069. doi:10.1109/MACE.2011.5987118Hohhot
Wang, X., Leng, M., Fu, W., Wang, H., Xue, Y., Xiong, H., et al. (September 2021). Research on regional renewable sources planning model based on improved ant colony algorithm, 2881–2885. Proceedings of the 2021 4th International Conference on Information Systems and Computer Aided Education. doi:10.1145/3482632.3487533Dalian China
Xin, Y., and Yuping, L. (2006). Islanding algorithm of distribution networks with distributed generators[J]. Power syst. Technology-beijing- 30 (7), 50. doi:10.3321/j.issn:1000-3673.2006.07.011
Xueping, G., Xinjun, L., and Chao, Y. (2020). Black-start scheme considering wind power participation[J]. Electr. Power Autom. Equip. 1, 31–37. doi:10.16081/j.epae.201912018
Yida, T., Zhi, W., and Wei, G. (2020). Research on active distribution network fault recovery strategy based on unified model considering reconstruction and island partition [J]. Power Syst. Technol. 44 (7), 2731–2737. doi:10.13335/j.1000-3673.pst.2019.1483
Yin, M., Li, K., and Yu, J. (2022). A data-driven approach for microgrid distributed generation planning under uncertainties. Appl. Energy 309, 118429. doi:10.1016/j.apenergy.2021.118429
Zhang, F., Xu, J. P., Hu, L. M., Xiu, C. H., and Sun, J. M., (2007). Monte Carlo simulation result for the pulsed neutron-neutron logging method[J]. Chin. J. Geophys. 50 (6), 1925–1931. doi:10.3321/j.issn:0001-5733.2007.06.037
Zhang, X. H., Yan, P. D., Zhong, J. Q., and Lu, Z. G., (2015). Research on generation expansion planning in low-carbon economy environment under incentive mechanism of renewable energy sources[J]. Power Syst. Technol. 39 (3), 655–662. doi:10.13335/j.1000-3673.pst.2015.03.011
Zhang, Y., Zhong, X., Wang, L., Liu, W., Zhu, K., Lu, Y., et al. (August 2022). Multi–objective cluster partition method for distribution network considering uncertainties of distributed generations and loads[C]//Proceedings of the 2022 power system and green energy conference (PSGEC). IEEE, 926–932. Shanghai, China, https://ieeexplore.ieee.org/abstract/document/9881118.
Keywords: distributed generation, extreme weather, load recovery, power supply planning, robustness, black-start, optimal node
Citation: Gu J, Wang S and Ou Y (2023) Two-stage planning method of distributed generation for improvement of resilience in extreme weather based on load partition coordinated recovery. Front. Energy Res. 11:1136753. doi: 10.3389/fenrg.2023.1136753
Received: 03 January 2023; Accepted: 22 March 2023;
Published: 11 April 2023.
Edited by:
Haoming Liu, Hohai University, ChinaReviewed by:
Yongxi Zhang, Changsha University of Science and Technology, ChinaCopyright © 2023 Gu, Wang and Ou. This is an open-access article distributed under the terms of the Creative Commons Attribution License (CC BY). The use, distribution or reproduction in other forums is permitted, provided the original author(s) and the copyright owner(s) are credited and that the original publication in this journal is cited, in accordance with accepted academic practice. No use, distribution or reproduction is permitted which does not comply with these terms.
*Correspondence: Shuai Wang, NzkyMzc0NDkxQHFxLmNvbQ==
Disclaimer: All claims expressed in this article are solely those of the authors and do not necessarily represent those of their affiliated organizations, or those of the publisher, the editors and the reviewers. Any product that may be evaluated in this article or claim that may be made by its manufacturer is not guaranteed or endorsed by the publisher.
Research integrity at Frontiers
Learn more about the work of our research integrity team to safeguard the quality of each article we publish.