 Liu Yishan
 Zu Lin2
 Lei Zhengdong
- 1Research Institute of Petroleum Exploration and Development, PetroChina, Beijing, China
- 2Research Institute of Exploration and Development of Daqing Oilfield Company Ltd., PetroChina, Daqing, Heilongjiang, China
- 3NO 2 Oil Production Plant Daqing Oilfield Company, PetroChina, Daqing, Heilongjiang, China
- 4CNOOC Research Institute Ltd., Beijing, China
- 5State Key Laboratory of Petroleum Resources and Prospecting, China University of Petroleum, Beijing, China
Based on the tight oil reservoir conditions of Lucaogou Formation in Jimusar Sag, Xinjiang, this paper conducts a full-scale characterization experiment of pore structure and designs the optimization numerical simulation of the development scheme based on the geological model combination with the fluid occurrence state. A comparative study on the development methods of tight reservoirs shows that the enhanced oil recovery effect of CO2 flooding is obviously better than that of CH4 flooding and water flooding. When the production bottom hole pressure is lower than the formation fluid saturation pressure, changing the production bottom hole pressure has little impact on the productivity of CO2 flooding in tight reservoirs. The recovery factor increases with the increase of injection rate, but when the injection rate is higher than 15,000 m³/d, the increase of oil recovery and the oil change rate decrease obviously; The complex fractures near the well can help to increase the swept volume of CO2 flooding, while the complex fractures far away from the well will cause channeling, which is not conducive to production. Combined with the occurrence state of the fluid, it is obtained that in the process of CO2 displacement, when the adsorption is considered, when the adsorption components are the same, with the increase of the adsorption capacity, the recovery factor decreases; When the adsorption capacity is constant, the higher the proportion of heavy components is, the lower the recovery factor is; With the increase of adsorption capacity, the permeability decreases more. The fluid occurrence state in tight oil reservoirs is very different from that in conventional reservoirs, and the adsorption phase accounts for a larger proportion, which seriously affects the flow capacity of the fluid during the development process. However, conventional numerical simulation rarely considers the influence of fluid occurrence state.
1 Introduction
The main difference between tight reservoir and conventional reservoir is that it is generally tight, resulting in poor physical properties. The specific performance is as follows: low matrix permeability, large variation range of reservoir porosity, complex pore throat structure, micro nano scale reservoir units and flow channels in the reservoir, and strong heterogeneity (Hu et al., 2010; Jarvie, 2010; Clarkson and Pedersen, 2011). At present, the production of tight oil requires targeted use of technologies such as manual transformation, massive drilling, multi branch wells or horizontal wells, The overall idea is to “artificially construct an oil flow channel with high conductivity and rely on the reservoir’s own energy for exploitation”, which can achieve high production in a short time, but cannot achieve stable production (Li and Zhang, 2011). Scholars have defined tight oil reservoirs according to permeability characteristics after long-term field investigation and experimental exploration: overburden permeability is less than 0.1 μm2 × 10−3 μm2 of tight sandstone, tight carbonate rock or mixed rock (Andrews, 2012; Jarvie, 2012; Liang et al., 2012). The depletion development capacity is extremely weak, and there is no possibility of high and stable production without artificial reservoir reconstruction (Kong et al., 2019). However, after fracturing, horizontal wells and other measures, the productivity has been improved to a certain extent (Jia et al., 2012; Tong, 2012; Hou et al., 2021). North America has made a double breakthrough in technology and production, enabling tight reservoirs to replace conventional reservoirs as the main source of oil resources (Lu et al., 2012; Montgomery and O’sullivan, 2017; Hou et al., 2022).
China is rich in tight oil resources (Li et al., 2020). In recent years, many tight oil reservoirs have been put into production, which can effectively supplement China’s oil resources. Taking Yanchang Formation of Ordos Basin as a typical representative (Zou et al., 2012; IEA, 2016), the first industrialized tight oil production area in China has been built (BP, 2016; Zhang et al., 2015). Tight oil in China reservoirs is characterized by deep burial depth, poor physical properties, micro nano scale pores, strong heterogeneity, poor fluid physical properties, and difficulty in producing (Tian et al., 2014; Shi et al., 2015; Yang et al., 2016). Before industrial production can be formed, a lot of research work needs to be carried out to solve problems such as fluid flow and reservoir reconstruction, and the goal of achieving high and stable production is a challenge (Du et al., 2014).
The Lucaogou Formation in Jimusar, Xinjiang, is a tight oil source reservoir with high organic carbon content, strong hydrocarbon generation capacity, stable distribution, and relatively concentrated vertical and wide horizontal distribution of tight oil desserts. The reservoir space is dominated by intergranular and intragranular dissolved pores. Microfractures are underdeveloped and only a small amount of them is developed in carbonate rocks. High pressure mercury injection data show that the reservoir is developed with nano pore throat, and the pore throat structure of the upper dessert body is superior to that of the lower dessert body. Dessert has good oil content and high saturation. The oil saturation is between 70% and 95%. The fluid property is poor. The density of the top “dessert” crude oil is 0.882 g/cm3, and the viscosity at 50°C is 50.27 mPa s. Studying the specific occurrence state of fluid in micro nano scale pores is the basis for its exploitation and can propose effective exploitation methods. The pore structure of tight reservoir is dense, usually micro nano level. The fluid adsorption layer formed due to adsorption will account for a large proportion and will also affect the effective diameter of pores. It is important to describe the fluid occurrence mechanism accurately and comprehensively. The occurrence state of tight oil will be comprehensively affected by temperature, pressure, pore size, pore mineral composition, fluid composition and other factors (Liu et al., 2020). For unconventional reservoirs such as tight oil, the occurrence state of fluid in reservoirs is quite different from that of conventional oil and gas reservoirs (Kong et al., 2021). At present, the occurrence state of pore fluid in tight oil reservoirs of Lucaogou Formation in Jimusar Sag, Xinjiang is unclear, the description of the availability of pore fluid is not accurate, and the development effect is not ideal.
At present, the effective development mode for tight reservoirs is depletion after fracturing and gas injection development. Therefore, this study combines the research results of fluid occurrence state and fluid availability, designs a targeted development plan and conducts numerical simulation research. By comparing and analyzing the effects of different development methods, bottom hole pressure, injection rate, occurrence state and fracture distribution on the development effect, the effective development methods for tight reservoirs are determined.
This study takes the Lucaogou Formation in Jimusar Sag as an example to carry out the feasibility of CO2 injection in typical work areas to improve the recovery rate and optimize the injection production and construction parameters to maximize the productivity. In this paper, a real reservoir geological model is established, and the effects of different development methods, production systems, oil occurrence state such as absorption and engineering factors on productivity are compared and discussed in combination with the actual situation, and the development parameters are optimized.
2 Reservoir geology and model establishment
First, based on the reservoir data of Lucaogou Formation in Jimusar Depression, Xinjiang, 42 (I) × 39 (J) × 8 (K), the top depth is 3,144.3 m. The fourth layer in the K direction adopts the reverse five-point method to arrange wells and establish the horizontal well in the J direction. By default, the length of the horizontal section of the injection well is 475 m, the length of the horizontal section of the production well is 275 m, the interval between the major fractures is 70 m, and which is 50 m in secondary fractures. There are six major fractures in the injection well, four major fractures in each production well, and four secondary fractures in each major fracture. To form an effective flow in the formation, the secondary fractures at the corresponding positions are interconnected. The formation and fracture parameters are shown in Table 1, and the geological model is shown in Figure 1.
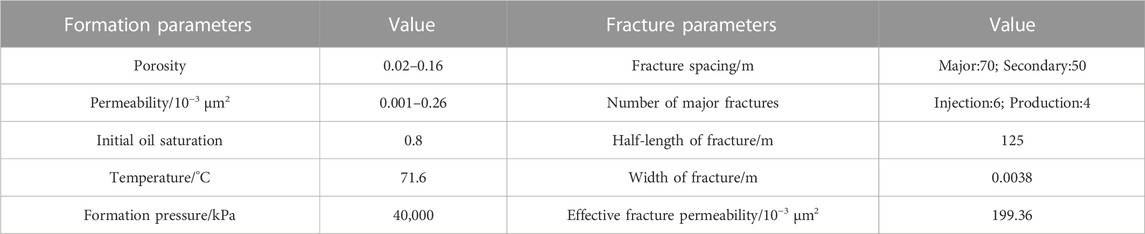
TABLE 1. Formation and fracture parameters.
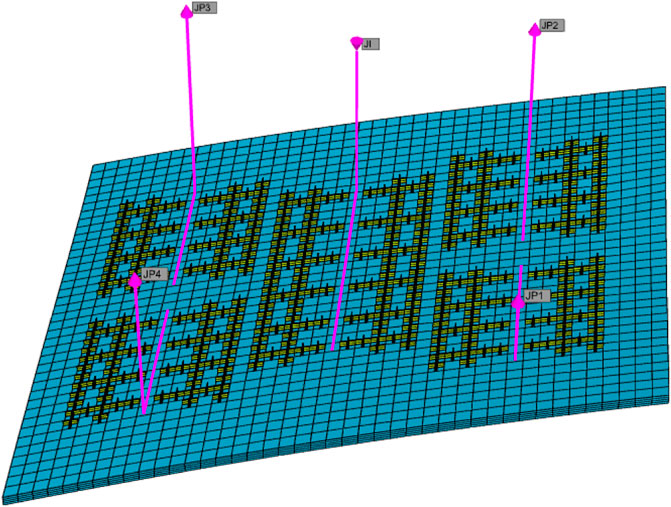
FIGURE 1. Geological model of target reservoir and distribution of fractures.
3 Establishment of numerical model and optimization of development mode
3.1 Establishment of numerical model
Carry out relative permeability test experiment with tight cores in the target block, obtain oil-water two-phase relative permeability curve and gas-liquid relative permeability curve, and apply the relative permeability curve to the numerical model, as shown in Figure 2. Crude oil composition is shown in Table 2.
FIGURE 2. Porosity distribution map of target reservoir.
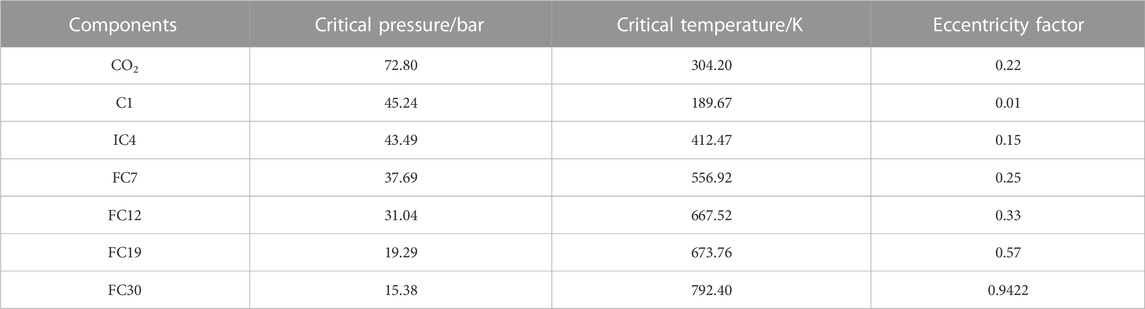
TABLE 2. Oil component parameters.
3.2 Feasibility analysis of development mode
Based on depletion development, this section has carried out water flooding, CO2 flooding and CH4 flooding, respectively. Simulation scheme is shown in Table 3. Compare and analyze the enhanced oil recovery range of each means and the composition of the fluid at the outlet end and discuss its applicability from the mechanism. The CMG numerical simulation software component model GEM module is used for this section and subsequent numerical simulation.
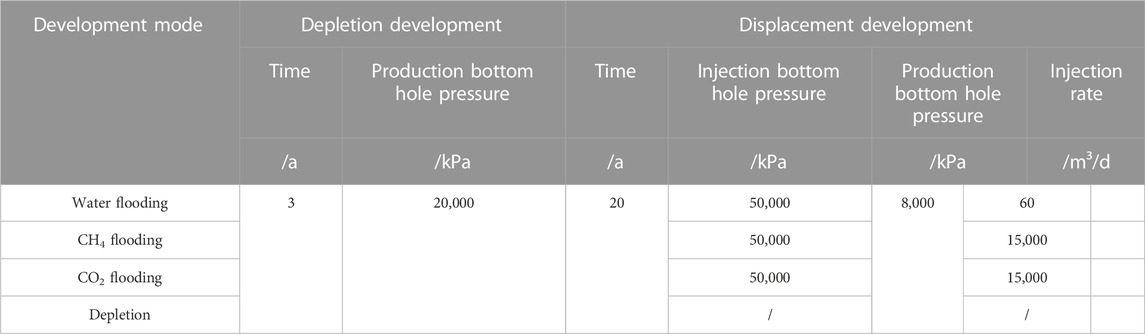
TABLE 3. Injection mode comparison scheme design.
The reason why the production bottom hole pressure in the depletion stage in the simulation scheme is set as 2 × 10⁴ kPa is that, considering that the real crude oil of the target reservoir contains a lot of dissolved gas, the production bottom hole pressure needs to be maintained at a high level in order to ensure that the formation fluid still has good fluidity after depletion development. CH4 and CO2 injection rate is set to 1.5 m³/d × 104 m³/d underground conditions. However, CH4 and CO2 have strong compressibility, and the injection amount converted according to the formation conditions is about 60 m³/d. However, the compressibility of displacement medium water can be ignored, so the injection rate of water flooding is set as 60 m³/d。
The enhanced oil recovery (Figure 3) and remaining oil saturation distribution (Figure 4) obtained by different development methods are compared and analyzed. It can be seen from Figure 3 that the enhanced oil recovery of CO2 flooding is much higher than that of water flooding and CH4 flooding. The enhanced oil recovery of CO2 flooding is 26.86%, that of CH4 flooding is 14.84%, that of water flooding is 13.92%, and that of pure depletion development is 13.25% after three years. At the initial stage of CO2 flooding, it can be found that the recovery factor has been significantly improved, and then the growth rate has decreased slowly. It can be seen from Figure 4 that CO2 flooding and CH4 flooding can effectively form a displacement channel to effectively use the crude oil within the well control range, while the water flooding has poor injectivity, and the oil saturation near the production well has not decreased, only relying on depletion development near the production well to maintain productivity.
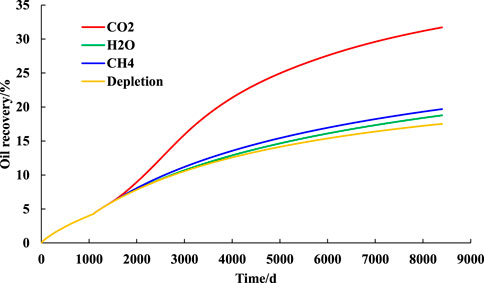
FIGURE 3. Recovery comparison of different development methods.
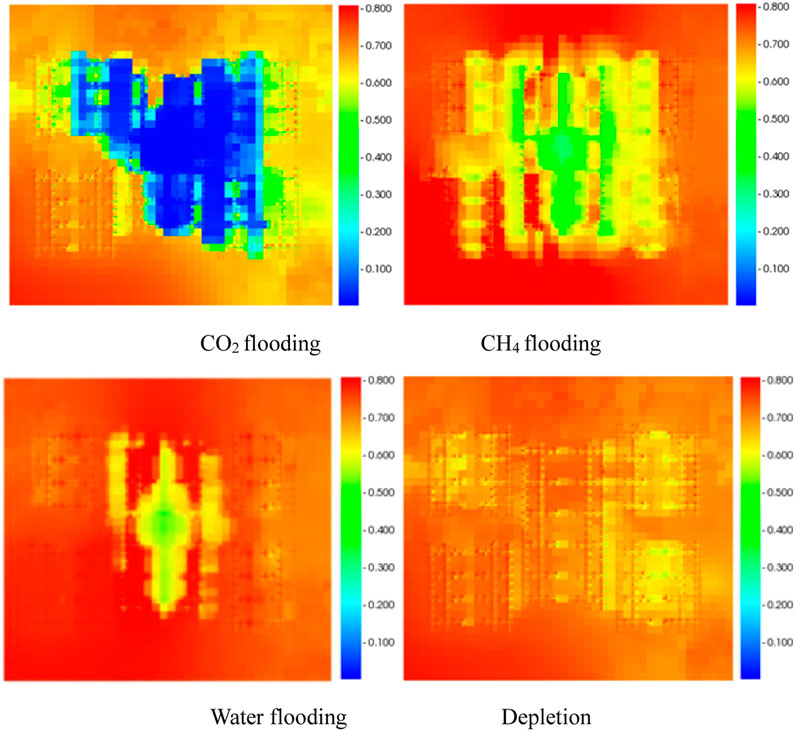
FIGURE 4. Distribution of remaining oil saturation in different development methods (the second layer).
4 Productivity sensitivity analysis of tight reservoirs
The development mode of five wells depletion + intermediate wells gas injection displacement is adopted, and the basic model parameters are formulated according to the domestic and foreign oilfield development experience. As shown in Table 4, the value ranges of different parameters are designed and different fracture distribution schemes of no fracture, no secondary fracture, one secondary fracture (in the middle of the main fracture), one secondary fracture (at the edge of the main fracture) and two secondary fractures are simulated to compare the effects of the location of the main fracture, secondary fracture and secondary fracture on the recovery and residual oil saturation. The fracture design scheme is shown in Table 5, and the fracture distribution is shown in Figure 5.

TABLE 4. Bottom hole pressure comparison scheme design.
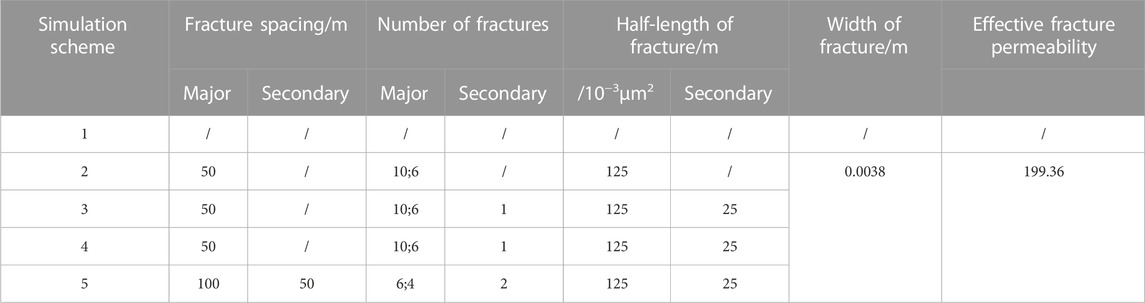
TABLE 5. Fracture parameter design.
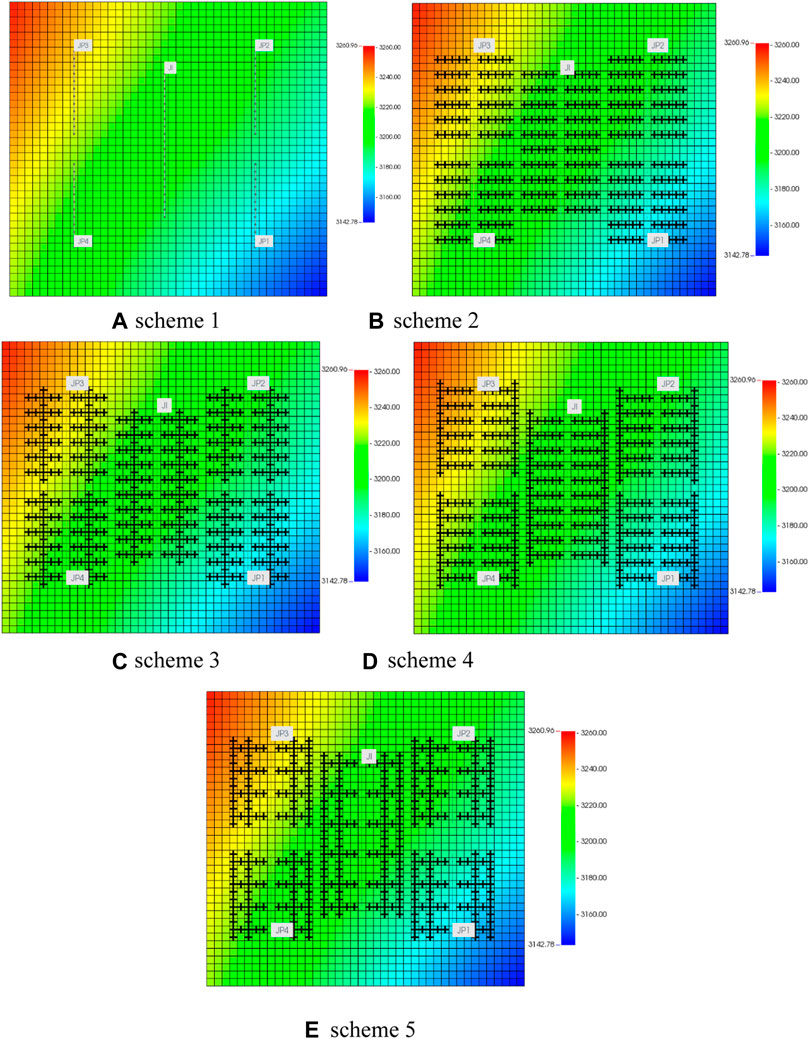
FIGURE 5. Fracture distribution of geological model in different scheme.
4.1 Analysis of bottom hole pressure influence
The influence of bottom hole pressure of production wells on productivity is compared and analyzed, and the results are shown in Figure 6. It can be seen from the figure that during the development process, with the development, the production bottom hole pressure will affect the productivity. In the first 12 years of CO2 injection, the lower the production bottom hole pressure, the greater the production pressure difference, and the higher the recovery factor. After 15 years of production, the production difference caused by the production pressure difference gradually decreases. At the end of production, the final recovery factors of the schemes with the production bottom hole pressure of 0.4 × 10⁴ kPa, 0.8 × 10⁴ kPa and 1.2 × 10⁴ kPa are very close, it is also higher than the development plan with the production well bottom pressure of 1.6 × 10⁴ kPa. When the production well bottom pressure is 2 × 10⁴ kPa, the recovery factor is the lowest.
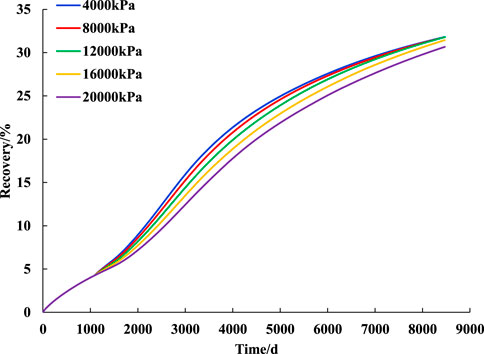
FIGURE 6. Effect of bottom hole pressure on recovery.
The reason why the impact of production pressure difference on productivity increases first and then decreases is that the crude oil in the target block contains a large amount of dissolved gas. At the initial stage of development, the formation pressure decreases slowly, the fluid phase does not change, and no dissolved gas is separated. With the development, the formation pressure gradually decreases and is lower than the bubble point pressure (the bubble point pressure of the crude oil measured by the high temperature and high pressure PVT experiment at the formation temperature is 15.3 MPa, and the minimum miscible pressure of the crude oil and CO2 calculated by the WINPROP component simulator is 18.75 MPa) Peng and Robinson, 1976, resulting in the release of dissolved gas, volume expansion, and the formation of dissolved gas flooding, thus making up for the lack of production pressure difference. However, when the production bottom hole pressure is 15.3 MPa higher than the bubble point pressure, such as 16 MPa and 20 MPa in the production plan, the dissolved gas cannot be separated and the dissolved gas flooding cannot be formed, so the final production capacity is lower than the other three plans. To screen more suitable bottom hole pressure of production wells, the production gasoline ratios of the three schemes are analyzed and compared, and the results are shown in Figure 7. It can be found that with the decrease of bottom hole pressure of production wells, the production gasoline ratio will increase. With the increase of production pressure difference, crude oil will be degassed seriously, which is not conducive to production. Therefore, in combination with oil production rate and gas oil ratio, 8000 kPa is selected as the best production well bottom hole pressure, which can not only consider efficiency, but also maintain a certain degree of stable production.
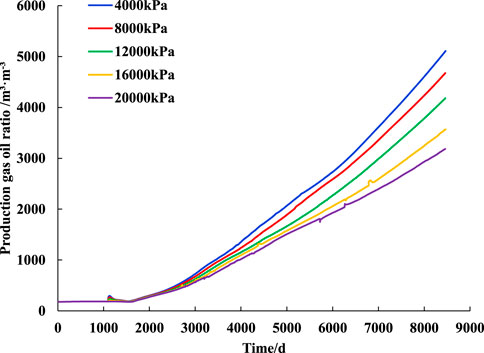
FIGURE 7. Effect of bottom hole pressure on gas oil ratio.
4.2 Analysis of injection rate
In the production process, due to the strong heterogeneity of tight reservoirs, it is not the more injection, the more production. There is a reasonable injection volume, which makes the injection and output have the best economic benefits. Therefore, this section compares and evaluates the injection volume of CO2 and optimizes the injection volume according to the proportion of injection and production.
The influence of different injection rates on productivity is analyzed and compared. The results are shown in Figure 8. It can be seen from the figure that in the early stage of displacement development, the injection rate has little impact on productivity. When the displacement development exceeds 3 years, the recovery factor increases with the increase of injection rate. When the injection rate increases from 0.5 m3/d × 104 m3/d to 1 m3/d × 104 m3/d, the recovery factor changes in the early and middle stages, while when the injection rate increases from 1 m3/d × 104 m3/d to 2 m3/d × 104 m3/d, the recovery factor is different in the late stage of development. Therefore, the greater the injection amount, the later the effective period. This is because the greater the injection amount will produce higher injection pressure. However, in the early stage of development, when the oil saturation is high, CO2 cannot effectively enter the formation, so it can only supplement the formation energy. With the development, the oil saturation decreases, the gas saturation of CO2 in the formation gradually increases, and the crude oil and CO2 are more in contact, at this time, the high oil carrying capacity of CO2 is reflected. On the contrary, with the decrease of oil saturation in the middle and later stages of development, the formation energy cannot be supplemented. The contact area between CO2 and crude oil is smaller than the large injection volume, and the recovery factor is significantly reduced.
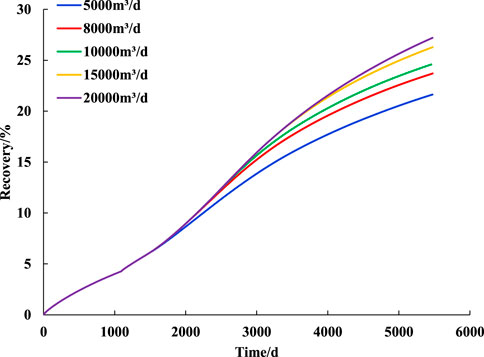
FIGURE 8. Effect of different injection rates on oil recovery.
According to the above results, it can be found that the greater the injection rate is, the higher the recovery factor is and the longer the high yield is maintained. However, it can be found that there is a difference between the enhanced oil recovery when the injection volume is increased from 1 m3/d × 104 m3/d to 1.5 m3/d × 104 m3/d and the enhanced oil recovery when the injection volume is increased from 1.5 m3/d × 104 m3/d to 2 m3/d × 104 m3/d. Therefore, by comparing the oil exchange ratio, the oil exchange ratio is defined as the ratio of the cumulative oil production volume to the cumulative gas injection volume to screen the best injection volume.
It can be seen from Figure 9 that with the increase of injection volume, the recovery factor increases and the oil exchange ratio decreases, which means that the CO2 required to obtain unit crude oil increases with the increase of injection volume and the recovery cost increases, but more crude oil can be obtained correspondingly. From the curve in the figure, it can be found that when the injection volume increases to 1.5 m3/d × 104 m3/d, the recovery factor increases slowly, and the oil exchange ratio decreases rapidly. Combined with the matching degree of recovery factor and oil exchange ratio, select 1.5 m3/d × 104 m3/d as the best injection rate.
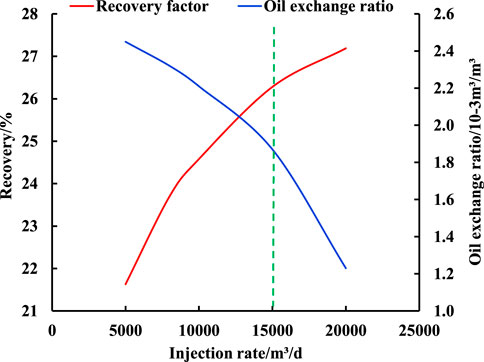
FIGURE 9. Comparison curves of oil recovery and oil exchange ratio with different injection rates.
4.3 Analysis of fractures
This section makes a comparative study on the distribution design of fractures. Artificial fractures are needed to form oil flow channels. This section makes a comparative analysis on the number and length of main fractures and the impact of secondary fractures on productivity.
Combined with the occurrence state of the fluid, it is obtained that in the process of CO2 displacement, the recovery factor decreases with the increase of the adsorption capacity, when the adsorption components are the same. The influence of different fracture distributions on oil recovery is compared and analyzed, and the results are shown in Figure 10. It can be found that the ultimate recovery factor of different fracture distributions from high to low is one secondary fracture (middle) > 2 secondary fractures > no secondary fractures > 1 secondary fracture (edge) > no fractures. The result is not as expected: The more secondary fractures, the better. This is because compared with the reservoir matrix, the fractures are high conductivity channels. Excessive infilling fractures will cause the formation of high permeability channels between injection and production wells, which is not conducive to the further spread of displacement phases. According to the experiment results, the effective permeability of the fracture is 200 mD, which is a high conductivity channel for CO2 because of its high flow ability, excessive infilling fractures will cause the connection of the fracture which make the CO2 flow in the fractures but not motivate the oil in the matrix. Therefore, the key to improve the recovery of tight reservoirs through fracturing is to conduct complex volume fracturing in the near well zone, while the fracturing effect in the far well zone is not ideal. By comparing the effect of fracture distribution on oil production rate, the existence of fractures has greatly improved the oil production rate in the short term. When the development time is long, the oil production rate of the non-fracture scheme is relatively higher, because fractures will induce the directional migration of displacement phase, so that the swept volume of the non-fracture scheme will be smaller, but more efficient. Combined with Figure 11, it can be found that Scheme 3 has the largest swept volume.
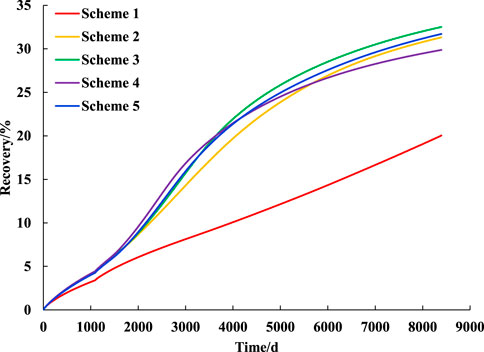
FIGURE 10. Effect of different fracture distribution on oil recovery.
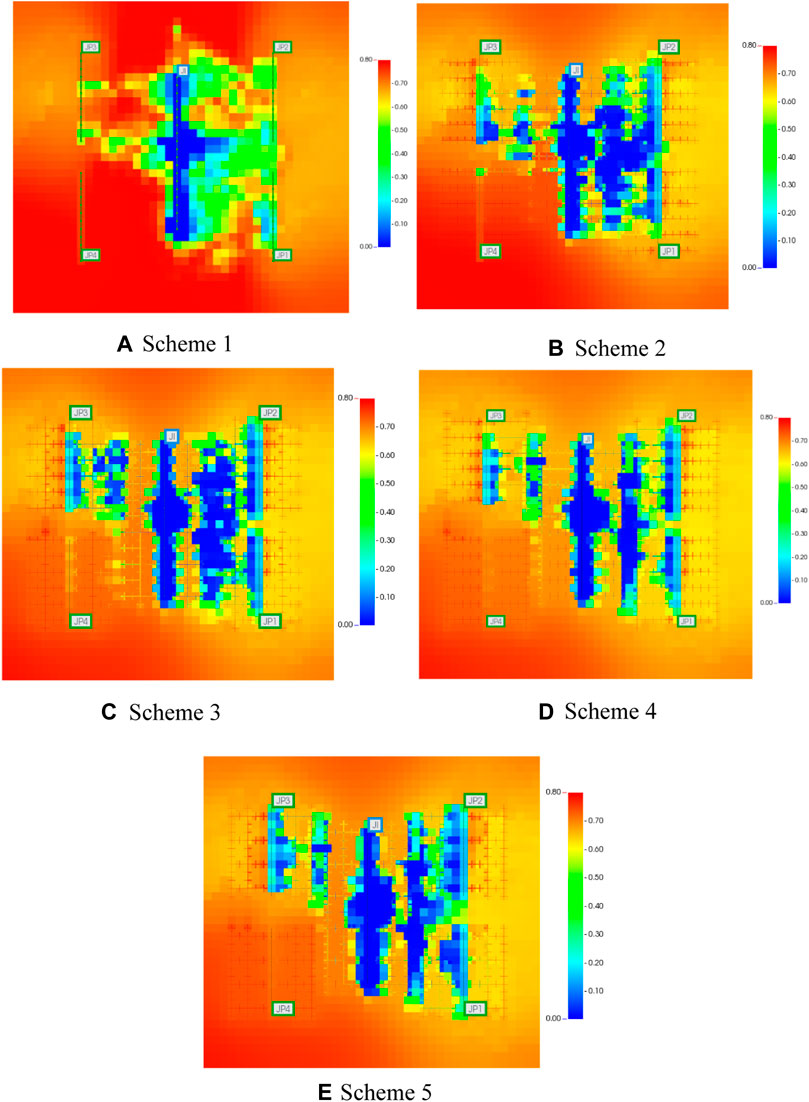
FIGURE 11. Distribution of remaining oil saturation with fracture distribution in different scheme.
5 Influence of oil occurrence state on production
5.1 Reservoir fluid occurrence characteristics
According to the previous research, reservoir fluids can be divided into three categories according to their occurrence state: body phase available crude oil, movable adsorption phase and immovable adsorption phase (Liu et al., 2021). This section makes a comparative analysis on the productivity considering adsorption.
Firstly, low-temperature liquid nitrogen adsorption experiment, high-pressure mercury intrusion porosimetry (MIP) and nuclear magnetic resonance experiment (NMR) were carried out, the obtained pore sizes were combined. According to the experimental principle of various test methods, the liquid nitrogen adsorption test was selected to obtain the interval with pore size less than 270 nm, the high-pressure mercury intrusion test was used to obtain the interval with pore size of 270 nm–1000 nm and the nuclear magnetic resonance test was used to obtain the interval with pore size greater than 1000 nm, as shown in Figure 12. To unify the standard, all experimental data are converted into cylindrical core with a diameter of 25 mm and a length of 20 mm, with a mass of about 10 g.
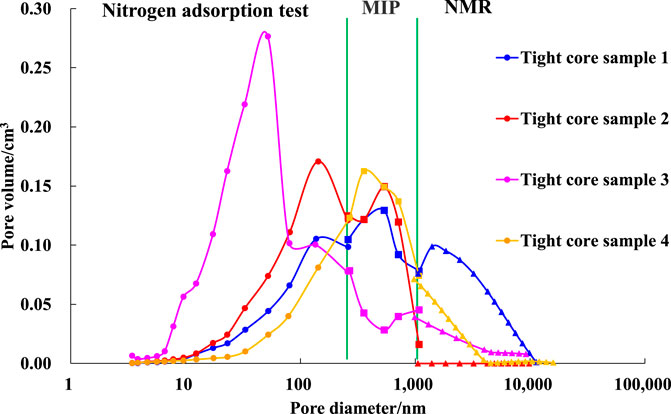
FIGURE 12. Full-scale pore size distribution of tight core samples.
According to the integration results, it can be obtained that the size distribution of compact core is within the range of 6.5 nm–19.2 μm, in which nano scale pores are dominant, while a small number of micro scale pores exist.
5.2 Simulation scheme design
According to the theoretical simulation of Dong et al. (2021). Based on the theoretical calculation of the matching relationship between adsorption capacity and pore size, it is preliminarily determined that the adsorption capacity is 3%–15%, and the oil recovery and reservoir physical property changes are compared. The specific simulation scheme is shown in Table 6.
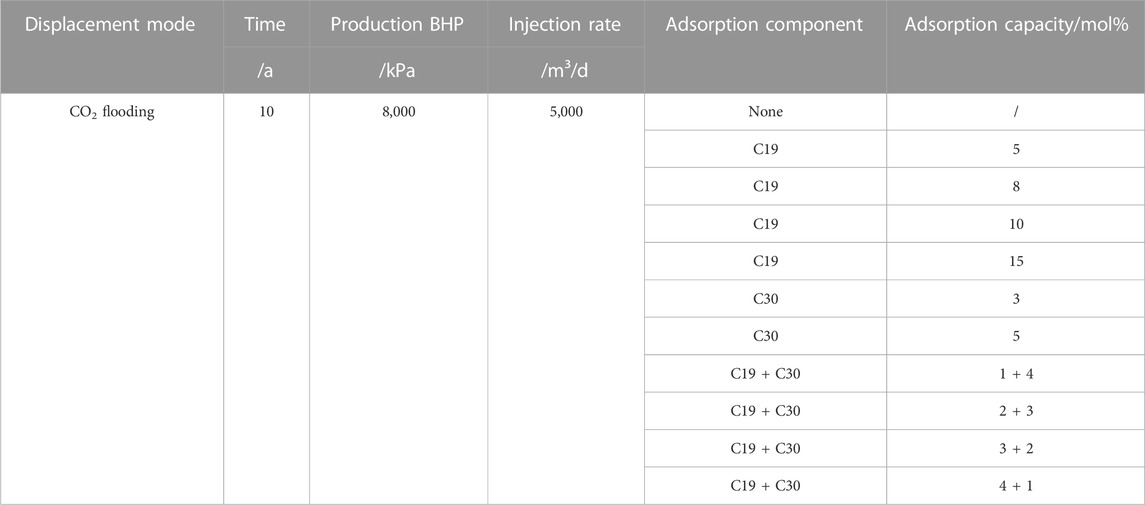
TABLE 6. Comparison scheme design considering adsorption.
Due to the consideration of adsorption, the amount of simulation calculation is greatly increased, so part of the geological model grid is intercepted, and the model size is 23 (I) × 19 (J) × 4 (K), the top depth is 3214 m. A single injection-production horizontal well group is established. The geological model is shown in Figure 13 and the physical properties of the model are shown in Table 7.
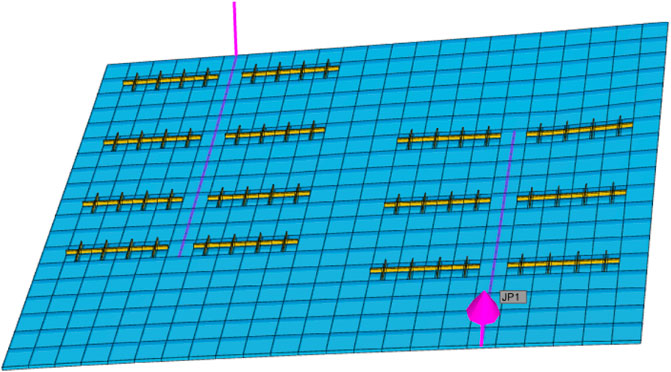
FIGURE 13. Part of geological model and distribution of fracture.
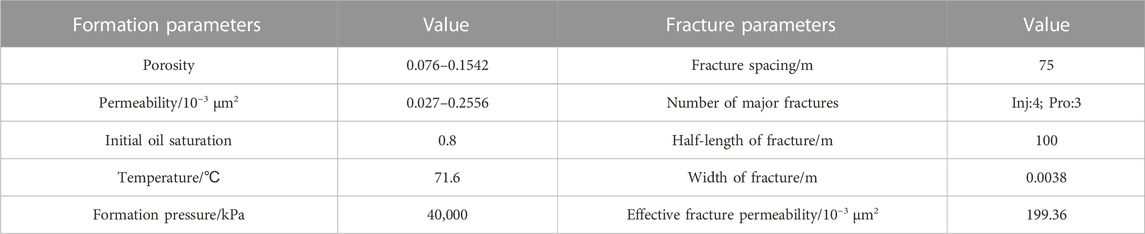
TABLE 7. Geological and fracture parameters.
5.3 Production conditions considering occurrence state
The effects of different adsorption capacity of single component on oil recovery (Figure 14) and the effects of the same adsorption capacity and different components on oil recovery (Figure 15) were analyzed respectively. The adsorption capacity is the mole fraction of the adsorption phase.
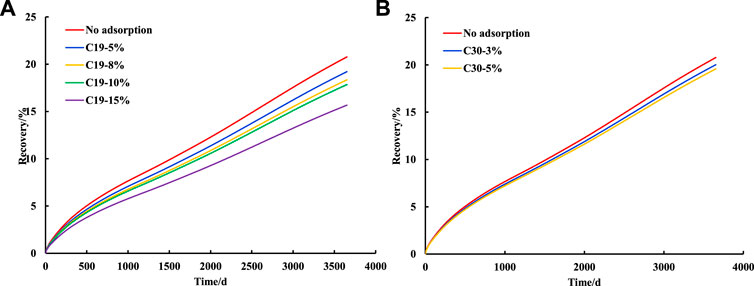
FIGURE 14. Effect of different adsorption capacity of single component on oil recovery (a.C19, b.C30).
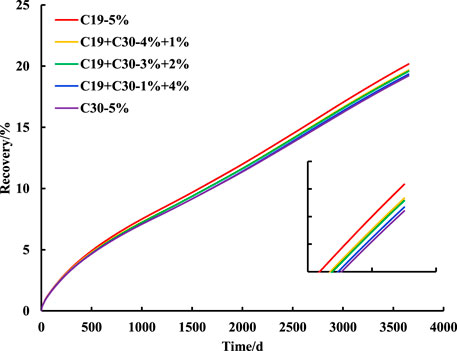
FIGURE 15. Effect of different components with the same adsorption capacity on oil recovery.
It can be seen from Figure 14 that with the increase of adsorption capacity, the recovery factor shows a downward trend. For C19 component, the recovery factor without adsorption is 20.78%; When the adsorption capacity is 5%, the recovery rate is 19.54%; When the adsorption capacity is 8%, the recovery rate is 18.34%; When the adsorption capacity is 10%, the recovery rate is 17.85%; The recovery rate is 15.67% when the adsorption capacity is 15%. At the same time, with the increase of adsorption capacity, the decline of oil recovery increases. Compared with no adsorption capacity, the adsorption capacity of 5% decreases the oil recovery by 1.24%; Compared with 5% adsorption, 10% adsorption decreased the recovery by 1.69%; Compared with 10% adsorption, 15% adsorption decreased the oil recovery by 2.18%. For C30 component, when the adsorption capacity is 3%, the recovery factor is 20.02%; When the adsorption capacity is 5%, the recovery factor is 19.58%.
It can be seen from Figure 15 that when the adsorption amount is the same, which is 5%. The more the heavy components are, the lower the recovery factor is. When the adsorption components are all C19, the recovery factor is 19.54%; The recovery factor is 18.77% when C19 accounts for 4% and C30 accounts for 1%; When C19 accounts for 3% and C30 accounts for 2%, the recovery factor is 18.66%; When C19 accounts for 1% and C30 accounts for 4%, the recovery factor is 18.33%; When all are C30, the recovery factor is 18.20%. According to the previous research results, the light components can be extracted by CO2 to further improve oil recovery, while the heavy components will be adsorbed on the pore surface and are difficult to use.
For the same grid on the mainstream channel at the same development time, the physical property analysis is carried out. The grid is selected as the second layer grid (12, 10, 2) (Figure 16). The physical property compared is the grid pressure (Figure 17).
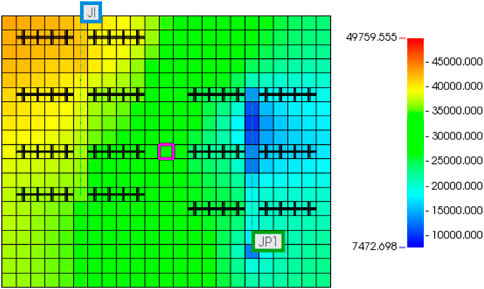
FIGURE 16. Model position of comparison grid.
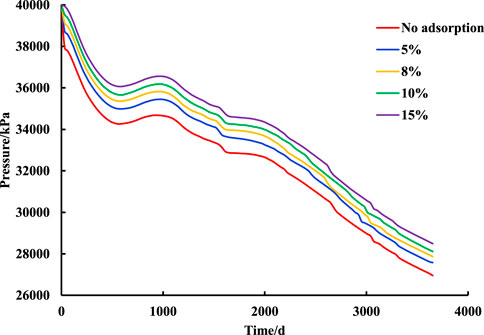
FIGURE 17. Influence of different adsorption capacity on grid pressure.
It can be seen from Figure 17 that with the increase of adsorption capacity, the pressure of the grid will also increase, indicating that the lower the permeability of the grid, the lower the effective pore size will be combined with the adsorption phase, which will result in the decrease of the permeability (Lei et al., 2020). Therefore, in the numerical simulation of unconventional tight oil, it is necessary to consider the reduction of effective permeability caused by adsorption, otherwise the simulation result will be higher than the actual value.
6 Conclusion
Conventional numerical simulation of different fractures rarely considers the influence of fluid occurrence state. The experiment shows that there are two parts of fluid in nano-porous: adsorption phase and bulk phase. This paper considers the influence of occurrence state on reservoir physical properties and fluid flow ability in numerical simulation for the first time.
1) The enhanced oil recovery effect of CO2 flooding is obviously better than that of CH4 flooding and water flooding, which are 26.86%, 14.84% and 13.92% respectively. The content of light components in CO2 flooding production fluid is higher than the average content of formation crude oil, which can effectively extract the light components in crude oil.
2) When the production bottom hole pressure is lower than the formation fluid saturation pressure, changing the production bottom hole pressure has little impact on the productivity of CO2 flooding in tight reservoirs. When it is higher than the formation fluid saturation pressure, the productivity decreases with the increase of the production bottom hole pressure, and the optimal production bottom hole pressure is 8,000 kPa.
3) The recovery factor increases with the increase of injection rate, but when the injection rate is higher than 1.5 m³/d × 104 m³/d, the increase of oil recovery rate is significantly slowed down, and the oil change rate is significantly reduced. According to the extent of enhanced oil recovery rate and the economic benefits of oil change rate × 104 m ³/d is the optimal CO2 injection amount.
4) The complex fractures in the near well zone help to improve the swept volume of CO2 flooding, while the complex fractures in the far well zone will cause gas channeling, which is not conducive to production.
5) When adsorption is considered, the recovery factor decreases with the increase of adsorption capacity; When the adsorption capacity is fixed, the recovery efficiency of the adsorbed heavy component is lower than that of the adsorbed light component. The adsorption can cause the permeability to decrease. With the increase of the adsorption amount, the permeability decreases.
Data availability statement
The original contributions presented in the study are included in the article/supplementary material, further inquiries can be directed to the corresponding author.
Author contributions
LY and ZL designed the research and write the manuscript; HY performed the research; SA and LY collected the data; DX analyzed data; TC and LZ contributed to the paper revisions. All authors have read and agreed to the published version of the manuscript.
Funding
This work was supported by the Chinese National Natural Science Foundation (No. 51774256), Chinese National Natural Science Foundation (No. 52004303) and Beijing Natural Science Foundation (3212020). This work was also done at the Beijing key laboratory of unconventional natural gas geological evaluation and development engineering.
Conflict of interest
LY, LYu, TC and LZ were employed by Research Institute of Petroleum Exploration and Development, PetroChina. ZL and SA were employed by Daqing Oilfield Company Ltd., PetroChina. SA was employed by NO 2 Oil Production Plant Daqing Oilfield Company, PetroChina. HY was employed by CNOOC Research Institute Ltd.
The remaining authors declare that the research was conducted in the absence of any commercial or financial relationships that could be construed as a potential conflict of interest.
Publisher’s note
All claims expressed in this article are solely those of the authors and do not necessarily represent those of their affiliated organizations, or those of the publisher, the editors and the reviewers. Any product that may be evaluated in this article, or claim that may be made by its manufacturer, is not guaranteed or endorsed by the publisher.
References
Andrews, T. (2012). Experiences in alberta's tight oil plays: Devonian to the cretaceous. Shale gas and oil symposium. Calgary: EIA.
Clarkson, C., and Pedersen, P. (2011). “Production analysis of Western Canadian unconventional light oil plays,” in Canadian unconventional resources conference (Calgary, Alberta, Canada: SPE).
Dong, X. H., Chen, Z. X., and Liu, H. Q. (2021). Mathematical modeling for occurrence state of hydrocarbon sin micro/nano-scale pores (in Chinese). J. China Univ. Petroleum (Edition). Nat. Sci. 45 (02), 87–95. doi:10.3969/j.issn.1673-5005.2021.02.010
Du, J. H., Liu, H., and Ma, D. S. (2014). Discussion on effective development techniques for continental tight oil in China (in Chinese). PETROLEUM Explor. Dev. 41 (2), 198–205. doi:10.1016/S1876-3804(14)60025-2
Hou, Y. N., Peng, Y., Chen, Z. X., Liu, Y., and Tian, Y. (2022). Investigating heterogeneous distribution of fluid pressure in hydraulic fractures during pulsating hydraulic fracturing. J. Petroleum Sci. Eng. 209, 109823. doi:10.1016/j.petrol.2021.109823
Hou, Y. N., Peng, Y., Chen, Z. X., Liu, Y., Zhang, G., Ma, Z., et al. (2021). Investigation on the controlling factors of pressure wave propagation behavior induced by pulsating hydraulic fracturing. SPE J. 26, 2716–2735. doi:10.2118/205384-pa
Hu, W. R., Zhai, G. M., and Li, J. M. (2010). Potential and development of unconventional hydrocarbon resources in China (in Chinese). Strategic Study CAE 12 (5), 25–29.
IEA (2016). World energy outlook 2016. IEA, Paris. Available at: https://www.iea.org/reports/world-energy-outlook-2016.
Jarvie, D. (2012). “Shale resource systems for oil and gas: part2-shale-oil resource systems,” in Shale Reservoirs-Giant Resources for the 21st century. 97, 89–119. doi:10.1306/M971332
Jarvie, D. (2010). Unconventional oil petroleum systems: Shales and shale hybrids. Calgary, Alberta: AAPG Conference and ExhibitionCanada, 12–15.
Jia, C. Z., Zou, C. N., and Li, J. Z. (2012). Assessment criteria, main types, basic features and resource prospects of the tight oil in China (in Chinese). Acta Pet. Sin. 33 (3), 343–350. doi:10.1016/0031-9384(73)90235-7
Kong, D. B., Gao, Y. B., Sarma, H., Li, Y., Guo, H., and Zhu, W. (2021). Experimental investigation of immiscible water-alternating-gas injection in ultra-high water-cut stage reservoir. Adv. Geo-Energy Res. 5 (2), 139–152. doi:10.46690/ager.2021.02.04
Kong, D. B., Li, Y. Q., Yu, M., Ma, R., Guo, H., Peng, Y., et al. (2019). Experimental investigation on block and transport characteristics of foam in porous media for enhanced oil recovery processes. Colloids Surfaces A Physicochem. Eng. Aspects 570, 22–31. doi:10.1016/j.colsurfa.2019.02.067
Lei, Z. D., Lai, L. B., Sun, Z., and Wu, K. (2020). Comprehensive model for oil transport behavior in nanopores: Interactions between oil and pore surface. Industrial Eng. Chem. Res. 59 (46), 20527–20538. doi:10.1021/acs.iecr.0c04025
Li, X., Li, C. L., and Li, B. (2020). Response laws of rock electrical property and saturation evaluation method of tight sandstone (in Chinese). PETROLEUM Explor. Dev. 47 (01), 202–212. doi:10.1016/S1876-3804(20)60020-9
Li, Y. X., and Zhang, J. C. (2011). Types of unconventional oil and gas resources in China and their development potential (in Chinese). Int. Pet. Econ. 34 (3), 61–67. doi:10.3969/j.issn.1004-7298.2011.03.011
Liang, S. J., Huang, Z. L., and Liu, B. (2012). Formation mechanism and enrichment conditions of Lucaogou Formation shale oil from Malang sag, Santang hu Basin (in Chinese). Acta Pet. Sin. 33 (4), 588–594. doi:10.7623/syxb201204007
Liu, Y. S., Dong, X. H., Chen, Z. X., Hou, Y., Luo, Q., and Chen, S. (2020). Pore-scale movability evaluation for tight oil enhanced oil recovery methods based on miniature core test and digital core construction. Industrial Eng. Chem. Res. 60 (6), 2625–2633. doi:10.1021/acs.iecr.0c04256
Liu, Y. S., Dong, X. H., Chen, Z. X., Hou, Y., Luo, Q., and Chen, Y. (2021). A novel experimental investigation on the occurrence state of fluids in microscale pores of tight reservoirs. J. Pet. Sci. Eng. 196, 107656. doi:10.1016/j.petrol.2020.107656
Lu, S. F., Huang, W. B., and Chen, F. W. (2012). Classification and evaluation criteria of shale oil and gas resources: Discussion and application (in Chinese). PETROLEUM Explor. Dev. 39 (2), 249–256. doi:10.1016/S1876-3804(12)60042-1
Montgomery, J. B., and O’sullivan, F. M. (2017). Spatial variability of tight oil well productivity and the impact of technology. Appl. Energy 195, 344–355. doi:10.1016/j.apenergy.2017.03.038
Peng, D. Y., and Robinson, D. B. (1976). A new two-constant equation of state. Ind. Eng. Chem. Fundam. 15, 59–64. doi:10.1021/i160057a011
Shi, L. Z., Wang, Z. Z., and Zhang, G. (2015). Distribution and formation of tight oil in Qijia area, Songliao Basin, NE China (in Chinese). PETROLEUM Explor. Dev. 42 (1), 44–50. doi:10.1016/S1876-3804(15)60005-2
Tian, J. C., Liu, W. W., and Wang, F. (2014). Heterogeneity of the paleozoic tight sandstone reservoirs in gaoqiao area of Ordos Basin (in Chinese). Oil Gas Geol. 35 (2), 183–189. doi:10.11743/ogg20140202
Tong, X. G. (2012). Genesis and distribution of unconventional oil (in Chinese). Acta Pet. Sin. 3 (S1), 20–26. doi:10.7623/syxb2012S1004
Yang, Z. F., Zeng, J. H., and Feng, X. (2016). Small-scaled heterogeneity of tight sandstone reservoirs and oil accumulation characteristics (in Chinese). J. China Univ. Min. Technol. 45 (01), 1–9. doi:10.13247/j.cnki.jcumt.000402
Zhang, G. Y., Wang, Z. Z., and Guo, X. G. (2015). Characteristics and ‘sweet spot’ prediction of dolomitic tight oil reservoirs of the Fengcheng Formation in Wuxia area, Junggar Basin (in Chinese). Oil Gas Geol. 36 (2), 219–229. doi:10.11743/ogg20150206
Keywords: tight oil reservoirs, occurrence state, gas injection development, numerical simulation, development effect
Citation: Yishan L, Lin Z, An S, Yanan H, Yuqi L, Changbing T, Xiaohu D and Zhengdong L (2023) Study on gas injection development effect of tight reservoir based on fluid occurrence state. Front. Energy Res. 11:1136020. doi: 10.3389/fenrg.2023.1136020
Received: 02 January 2023; Accepted: 20 January 2023;
Published: 16 February 2023.
Edited by:
Debin Kong, University of Science and Technology Beijing, ChinaReviewed by:
Wendong Wang, China University of Petroleum, Huadong, ChinaRuixue Li, Chengdu University of Technology, China
Copyright © 2023 Yishan, Lin, An, Yanan, Yuqi, Changbing, Xiaohu and Zhengdong. This is an open-access article distributed under the terms of the Creative Commons Attribution License (CC BY). The use, distribution or reproduction in other forums is permitted, provided the original author(s) and the copyright owner(s) are credited and that the original publication in this journal is cited, in accordance with accepted academic practice. No use, distribution or reproduction is permitted which does not comply with these terms.
*Correspondence: Hou Yanan, aG91eW4yQGNub29jLmNvbS5jbg==