 Diansheng Luo
 Wengang Chen2
 Jie Fang
- 1College of Electrical and Information Engineering, Hunan University, Changsha, China
- 2State Grid Jincheng Power Supply Company, Jincheng, China
Aiming at high accuracy of dissolved gas content prediction in transformer oil, a novel method based on gated recurrent unit and adaptive graph convolution network (GRU-AGCN) is proposed. For gated recurrent unit (GRU) can selectively choose the feature of time series, it is used to extract time series information of the gas content. Correlation among gases are extracted to improve the accuracy. The original adjacency matrix of the model is constructed according to the grey relational analysis (GRA), and the dynamic relation information between gases is extracted by adaptive graph convolution network (AGCN). The experimental result shows that the GRU-AGCN model can efficiently extract the temporal features and perceive the dynamic relationship of gases. The predictions error of the proposed method is lower than that of RNN, LSTM network and GRU network. The proposed method provides a reliable and accurate result for the prediction of dissolved gas content in transformer oil.
1 Introduction
Transformer is an important equipment in power system, which is related to the safety and stability of power system (Wu et al., 2021; Su et al., 2022). During the operation of the power transformer, several gases are generated in oil by the influence of life cycle, load, oil temperature and other factors. When the transformer overheats or discharges, there will be abnormal changes in gases (Gómez et al., 2014). Insulation will be broken down as the transformer fault develops, affecting the stability of the power system (Huang et al., 2021). Therefore, the state data of the power transformer can be obtained and its trend can be predicted by installing monitoring equipment on the transformer, which can provide a reliable judgment basis for the state maintenance of the transformer (Xie et al., 2020).
In recent years, a lot of research work has been done on the prediction of dissolved gas content in transformer oil. Chen et al. (2021) constructed an improved grey model for the time series prediction of gas in oil. K-nearest Neighbor was used to predict the furan level in transformers in (Shaban et al., 2016). In addition, many machine learning methods such as artificial neural networks (Ghunem et al., 2012) and support vector machines (Atherfold and van Zyl, 2020) are used for gas content prediction. The above methods process the data of each moment synchronously, so the feature significance of different moments cannot be considered, which means that their prediction accuracy is limited.
Recurrent neural network (RNN) extracts current and historical information by loop structure, which is suitable for processing time series. However, RNN is weak in learning information at too far time, which is called as “Long-term dependency problem.” The Long short-term Memory (LSTM) developed based on RNN introduces gating mechanism to alleviate the problem of RNN. Therefore, some prediction methods for gas content based on LSTM have been proposed (Lin et al., 2018b; Ma et al., 2021). But the complexity of LSTM leads to long training time. Gated Recurrent Unit (GRU) network was proposed as another variant of RNN, simplifies the gating mechanism, which can process long series efficiently and be trained fast (Minh et al., 2018).
There are complex dynamic relationships in gases in transformer oil (Fessler et al., 1989). When the hot spot temperature is low or the fault is slight, the insulating material produces hydrogen and alkanes through decomposition. When the fault is severe, the energy will be released by overheating or discharge, alkenes and alkynes will be produced by further decomposition. Therefore, the production of dissolved gases in oil has a certain correlation, and varies according to the fault type and development. Above methods are based on the prediction by single gas variable, which ignores the inherent correlations between gases, and the results are obtained with low accuracy and reliability. In the study of (Ma et al., 2021), temperature and seven gas content series were put into LSTM to predict gas content. Lin et al. (2018a) took the gas content and the ratios of various gas as the input features of neural network for the prediction. These methods consider the influence of various factors in the prediction, but the feature extraction methods of correlation factors are simple, and the promotion in prediction performance is limited.
For above problems, a content prediction method of gas in transformer oil based on gated recurrent unit and adaptive graph convolution network (GRU-AGCN) is proposed. GRU is used to extract time series information of gas content. To describe the correlation among gases, the original adjacency matrix of the model is constructed based on grey correlation analysis (GRA), and the adjacency matrix is real-time updated according to the input to ensure that the correlation obtained is accurate and reliable. The dynamic relation feature among gases is extracted by adaptive graph convolution network (AGCN). The accurate prediction of gas content can is achieved by integrating the historical information of gas itself and other relevant gas information.
2 Gated recurrent unit network
GRU network is one of the variants of RNN. In GRU, gating mechanism is introduced to RNN to selectively transmit temporal features.
The structure of GRU network is shown in Figure 1A. Data [x1, x2, …, xT] with length T are input into corresponding units chronologically. The structure of GRU is shown in Figure 1B. Take GRU of time t as an example (1 < t < T), the input of the unit includes current original data xt and hidden feature ht−1 output by the last unit. And the output of the unit is the hidden feature at time t denoted as ht. The workflow of GRU is as follows, Firstly, input is passed to reset gate and update gate to obtain reset state rt and update state ut. Secondly, the candidate hidden state
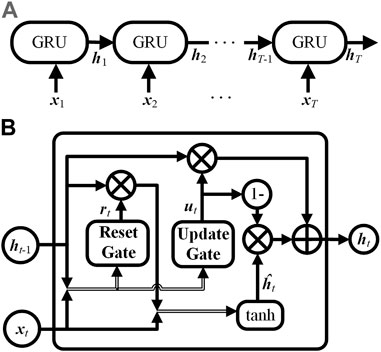
FIGURE 1. Structure of GRU network, (A) is GRU network overall structure, (B) is GRU internal structure.
In above equations, fsig(.) and ftanh(.) are sigmoid function and hyperbolic tangent function, Wr1 and Wr2 are the weight of the reset gate, Br is the bias of the reset gate, Wu1 and Wu2 are the weight of the update gate and Bu is the bias of the update gate. Wh1 and Wh2 are the weight and Bh is the bias in the candidate hidden state calculation. Hadamard Product operation is denoted as.
By above principle, historical information and current information can be filtered and processed flexibly in GRU network.
3 Adaptive graph convolutional network
3.1 Grey relational analysis of gases in transformer oil
GRA is an analysis method based on grey system theory, which judges the correlation degree among factors according to the similarity of the shape of the factor curves. Therefore, the historical data of gas 1∼ n with length M are analyzed by GRA.
Historical data for gas i is used as a reference sequence, which is denoted as
coeffij(t) is the correlation coefficient of reference sequence and comparison sequence at time t, the minimum and maximum values of the absolute difference between the reference sequence and other comparison sequences are denoted as
If the grey relational degree greyij∈(0, 1) obtained is close to 1, it indicates that gas j and gas i have a strong correlation. Otherwise, the correlation between gas j and gas i is weak. GRA preliminarily determined the correlation information among gases in oil.
3.2 Graph convolutional network
Graph convolutional network is designed to realize information fusion and feature extraction of graph data with complex association by means of adjacency matrix and graph kernel. Therefore, in this paper, the gas in oil is taken as the graph node, the result of GRA constitute edges, and the weighted gas adjacency matrix A0 is constructed based on the grey relational degree to extract the gas correlation features.
Traditional adjacency matrix can only describe the connection between nodes, that is, if there is an edge between node i and node j, the element aij in adjacency matrix is 1, otherwise, it is 0, which cannot express the strength of connections. Based on the results of GRA in the last section, the element aij of gas adjacency matrix is redefined as follows,
The gas original adjacency matrix A0 (dimension n × n) is obtained by above equation.
To make the gas node introduce its own features in the graph convolution operation, self-loop is added to the gas node in the graph, and the graph convolution network is as follows,
Where H (dimension n × Chidden) is the input feature of gas node 1∼n, denoted as H = [h1, h2, …, hn], WG (dimension Chidden × Cout) is the graph convolution kernel, BG (dimension n × Cout) is the graph convolution bias, and D (dimension n × n) is degree matrix, which is the diagonal matrix composed of the number of edges of gas node 1∼ n in the graph with self-loop. The self-loop refers to the edge where node links to itself, which avoid the omission of node itself caused by only extracting neighbor node information in feature update. In gas prediction, the self-loop enables the model to consider the original features of the gas when extracting related gas features.
3.3 Reconstruction of adjacency matrix and adaptive graph convolution networks
To capture real-time dynamic gas state information, the original graph convolution algorithm is improved. In the improved model, the original static adjacency matrix A0 is modified to a variable that changes adaptively according to the input feature H. A learnable distance measure is introduced into the adjacency matrix. The distance distij between input feature hi (dimension 1×Chidden) of gas node i and input feature hj (dimension 1 × Chidden) of gas node j is proposed as follows,
Where Wd (dimension Chidden × Chidden) is a learnable weight matrix.
Gaussian function could improve data differentiation, map distance distij non-linear to [0,1], and enhance the expression ability of gas correlation. Here, Gaussian function is used to process distance measurement, and reconstructed adjacency matrix elements are obtained. Specific formula is as follows,
In the formula, exp(.) is an exponential function based on the constant e, σ is a bandwidth, which adjusts the influence range of the Gaussian.
The reconstructed adjacency matrix Arec (dimension n × n) is obtained by above steps, which is expressed as:
The reconstructed adjacency matrix Arec is introduced into the graph convolution formula, which is used as a modification to the original adjacency matrix A0, and adaptive graph convolution network formula is shown as follows:
Where Aadapt = I + A0 + Arec. It means that the model can learn the current optimal gas relationship from the gas relationship information obtained by GRA. For the learning range is small, the model converges quickly through the training.
4 Realization of GRU-AGCN model for gas content prediction
4.1 GRU-AGCN model design
Traditional methods focus on the single gas sequence but concerns little on the correlation information among gases, and their ability to perceive transformer operation status is limited. In addition, some prediction models with multiple gases also lack effective ways to analyze and extract correlation information of input features. The above problems lead to low stability and reliability of gas content prediction in transformer oil.
Therefore, a GRU-AGCN model for gas content prediction is designed in this paper. The model structure is shown in Figure 2. The model takes the content series of T time points of gas 1∼n as input, the temporal features of each gas are extracted through several parallel GRU networks. And temporal features of gases from GRU networks are input into AGCN to extract the gas dynamic correlation features. AGCN firstly calculates the distance measure between gases according to the time series features, and updates the adaptive adjacency matrix based on the original adjacency matrix obtained by GRA. Then, the updated graph adjacency matrix and temporal features are passed into the graph convolution for feature fusion and feature transformation. Finally, the predicted values of gas contents at time (T + 1) are output by linear layer and activation function.
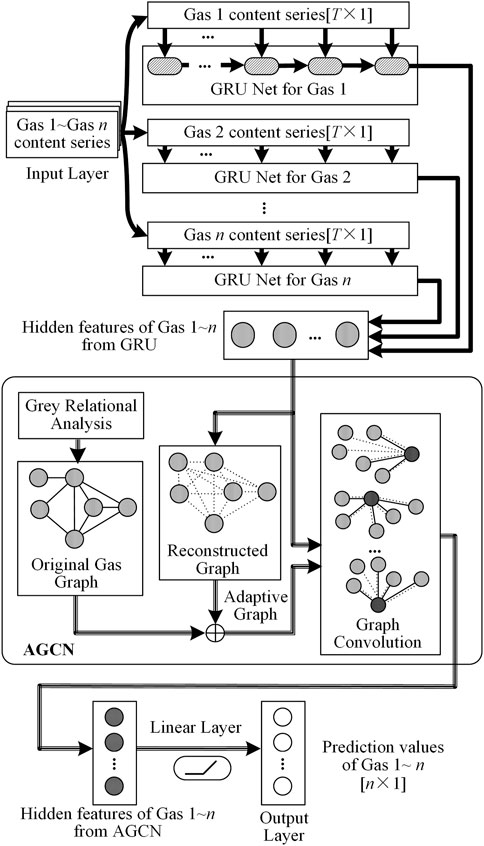
FIGURE 2. Structure of GRU-AGCN model for gas content prediction.
4.2 Prediction process based on GRU-AGCN model
Content prediction process of gases in transformer oil based on GRU-AGCN model are as follows,
1) Obtain historical data of gas content in transformer oil.
2) Remove the outliers in the gas content data and fill in the gaps by interpolation.
3) Normalize the content data of each gas.
4) The normalized data are rolled and intercepted into multiple groups of samples based on the time length T, and sample set is separated into training set and test set.
5) Based on the training set, the relational degrees of gases are obtained by GRA, and original gas topology and adjacency matrix A0 are constructed.
6) The smoothed mean absolute error is set to be loss function. And Adam optimization algorithm is used to make the model learn training samples. After several iterations of training and parameters adjusting, the prediction requirement could be satisfied by the model.
7) The test set samples are input to model obtained in Step (6) for prediction test, and the predicted results are analyzed.
5 Analysis of experimental examples
To verify the superiority of the proposed model, a GRU-AGCN model is built by Python language based on Spyder platform and PyTorch library.
Mean absolute error (MAE) and mean absolute percentage error (MAPE) are used to evaluate the prediction performance of the model. Suppose that gas content series in time 1∼t is used for prediction, denoted as X = [x1, x2, …, xt], the corresponding predicted value series is denoted as Y = [y1, y2, …, yt]. The MAE and MAPE are calculated as follows:
A converter transformer in Henan Province is taken as the research object. It was put into operation in 2014 and has been operating normally ever since. Dissolved gases monitored include hydrogen (H2), methane (CH4), ethane (C2H6), ethylene (C2H4), acetylene (C2H2), carbon monoxide (CO) and carbon dioxide (CO2), and their content is within the normal range stipulated by IEC. Eight hundred and twenty sets of data of the transformer from May to October 2019 were selected for the experiment. The time period is 4 h. The content of C2H2 is always 0 in the monitoring interval, which is not used as model input. The input of the model is set as the content series of six gases in 20 consecutive time points, and the output is set as the predicted value of gases at the next time point. The original gas content data are processed according to the above steps and 800 groups of samples were obtained. The size of training set and test set are divided by 3:1. The first 600 groups are set as the training set, and the last 200 groups are the test set.
The grey relational degree table of six gas content is obtained by GRA. As shown in Table 1, the correlations rang is distributed in [0.634, 1.000], which indicates that there are clearly exists correlations among six gases, but their intensity are different. Regardless of the self-correlation, CO and CO2 are the most correlated, while the correlation between H2 and CO2 is the weakest.
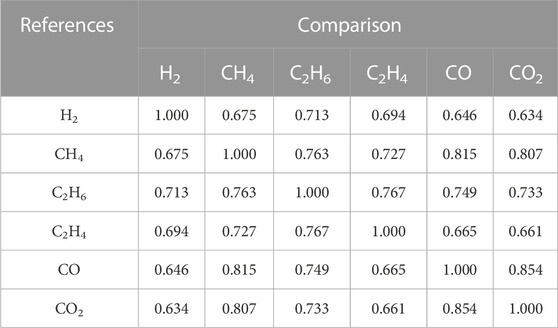
TABLE 1. Grey relational degree of gases in transformer oil (α = 0.5).
Based on Table 1, the correlation degrees are introduced into AGCN of the model as original adjacency matrix. And parameter σ2 in the AGCN is set to 0.5, because it achieves the best result in model training.
Then, GRU-AGCN model is trained for 200 times, and the initial learning rate is set to 0.0005. The sample loss curve in Figure 3 is obtained. As shown in Figure 3, the model parameters converge to the global optimum quickly and smoothly during training.
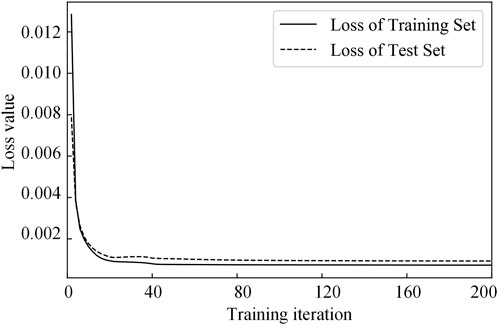
FIGURE 3. Loss curve in training.
To verify the accuracy and reliability of the proposed model in gas content prediction task, the GRU-AGCN model and other traditional models are used for single-step prediction experiment. The models used for comparison include RNN and its variants GRU Net and LSTM Net. In addition, original GCN is introduced into GRU Net and LSTM Net to form new models, denoted as GRU-GCN and LSTM-GCN respectively. Specific parameter settings of models are shown in Table 2.
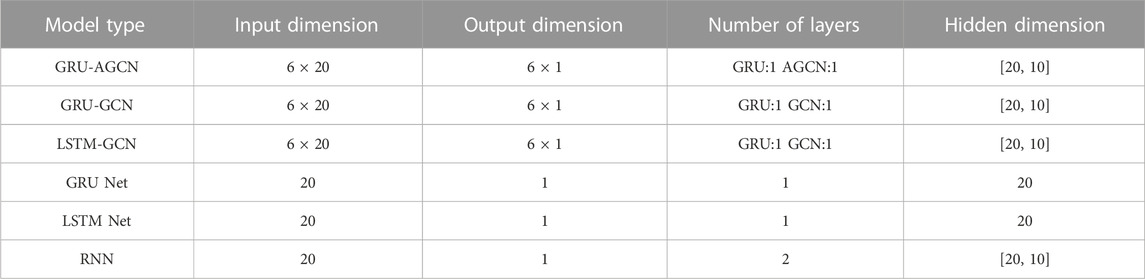
TABLE 2. Parameters of prediction models.
Except for the model proposed in this paper and models introduced GCN, all other models are designed for univariate prediction. The input time scale, prediction range and training conditions of all models remained consistent. Hidden features of models are output through a linear layer and ReLU activation function. All models were trained 200 times.
Limited by space, this section mainly analyzes the result of CO2 content prediction experiment. Table 3 records the training time and prediction effect of CO2 content prediction by above models.
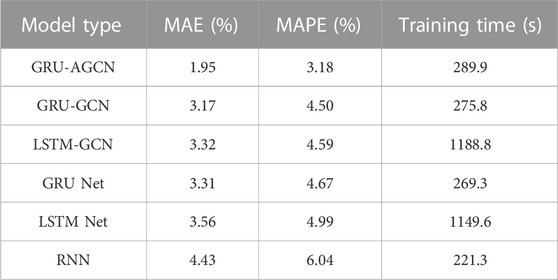
TABLE 3. Effects of models on CO2 content prediction.
Firstly, RNN and its variants GRU Net and LSTM Net are compared. Obviously, RNN has the fastest training, but its prediction accuracy is far lower than other networks. Both GRU Net and LSTM Net introduce gating mechanism, which selectively extract features at different moments. Compared with RNN, MAE percentage of the two models decreased by 1.12 and 0.87 respectively. However, the training time of LSTM Net is much longer than that of GRU Net. It is proved that GRU Net can extract temporal features of gas content efficiently and is easier to train than LSTM Net.
Then, GRU Net and LSTM Net are compared with GRU-GCN and LSTM-GCN respectively. The prediction accuracy of model introduced GCN is significantly higher than the original model. The reason lies in that the information of the related gases has been used for the prediction by GRU in GRU-GCN model and LSTM-GCN model.
Finally, GRU-AGCN model is compared with GRU Net and GRU-GCN model. The prediction result by above models are shown in Figure 4. Based on the analysis of Figure 4 and Table 3, it can be found that GRU Net model only accurately predict the stable development of CO2, as shown in 1st∼125th point of Figure 4, which shows a poor prediction effect on series with large fluctuation. The GRU- GCN utilized the correlations between the gases. But the model cannot obtain satisfactory prediction effect in long time span, because the real-time changes in gas relationships cannot be represented by static adjacency matrices. The proposed GRU-AGCN model has the smallest MAE and MAPE in prediction, which is only 20.6 s slower than GRU Net during the training. The proposed method obtains the best effect with an acceptable time cost. The reason is that GRU part of the proposed model can efficiently extract the temporal features of gas series, while the AGCN part adaptively adjust the graph adjacency matrix and dynamically acquire the gas relationship from learning samples, which makes the prediction result more accurate and reasonable than other models. The proposed model keeps high accuracy and reliability for series in stable situation or large fluctuations.
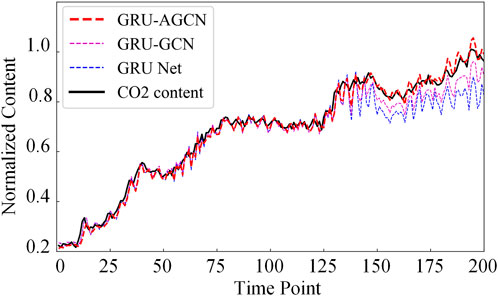
FIGURE 4. The effect of three models on CO2 content prediction.
6 Conclusion
The change of gas content in transformer oil reflects the health status of transformer, which needs to consider both the temporal information from gas itself and the dynamic correlation information from related gases. Base on above two aspects, a prediction method based on GRU-AGCN model is proposed. From the experiment comparison and analysis, it can be concluded that:
1) GRU Net can extract key information of important moments from gas series, and its prediction is more accurate than RNN. Compared with LSTM Net, GRU Net is simpler, training faster, and extraction efficiency for the temporal features is higher.
2) Compared with the single gas variable prediction model, the multi-gas variable combined prediction model with GCN consider the correlation between gases, which significantly improves the prediction accuracy.
3) The AGCN proposed in this paper extracts the gas relations dynamically, which makes the prediction result more accurate and reasonable. The proposed model can maintain high accuracy for different time period.
Data availability statement
The original contributions presented in the study are included in the article/Supplementary Material, further inquiries can be directed to the corresponding author.
Author contributions
DL and WC contributed to the development and design of the model. JF implemented the programming of the proposed model algorithm. JL collected experimental data. JY and KZ designed the experiment to prove the superiority of the proposed method. All authors wrote parts of the manuscript. All authors have read and agreed to the submission of the manuscript.
Funding
The research is supported by the Science and Technology Project of State Grid Shanxi Electric Power Co., LTD., China (No. SGSXJC00YCJS2100679).
Conflict of interest
Authors WC, JL, JY, and KZ were employed by State Grid Jincheng Power Supply Company.
The remaining authors declare that the research was conducted in the absence of any commercial or financial relationships that could be construed as a potential conflict of interest.
Publisher’s note
All claims expressed in this article are solely those of the authors and do not necessarily represent those of their affiliated organizations, or those of the publisher, the editors and the reviewers. Any product that may be evaluated in this article, or claim that may be made by its manufacturer, is not guaranteed or endorsed by the publisher.
References
Atherfold, J., and van Zyl, T. L. (2020). “A method for dissolved gas forecasting in power transformers using LS-SVM,” in 2020 IEEE 23rd international conference on information fusion (FUSION) (Rustenburg, South Africa, 1–8. 6-9 July 2020. doi:10.23919/FUSION45008.2020.9190216
Chen, X., Hu, Y., Dong, Z., Zheng, P., and Wei, J. (2021). Transformer operating state monitoring system based on wireless sensor networks. IEEE Sensors J. 21, 25098–25105. doi:10.1109/JSEN.2021.3050763
Fessler, W. A., Rouse, T. O., McNutt, W. J., and Compton, O. R. (1989). A refined mathematical model for prediction of bubble evolution in transformers. IEEE Trans. Power Deliv. 4, 391–404. doi:10.1109/61.19229
Ghunem, R. A., Assaleh, K., and El-hag, A. H. (2012). Artificial neural networks with stepwise regression for predicting transformer oil furan content. IEEE Trans. Dielectr. Electr. Insulation 19, 414–420. doi:10.1109/TDEI.2012.6180233
Gómez, N. A., Wilhelm, H. M., Santos, C. C., and Stocco, G. B. (2014). Dissolved gas analysis (DGA) of natural ester insulating fluids with different chemical compositions. IEEE Trans. Dielectr. Electr. Insulation 21, 1071–1078. doi:10.1109/TDEI.2014.6832250
Huang, K., Li, H., Wang, W., Zhang, L., Feng, A., and Li, X. (2021). Multi-field collaborative of oil-immersed transformer for distributed energy resources temperature rise considering the influence of heat transfer oil. Front. Energy Res. 9. doi:10.3389/fenrg.2021.701873
Lin, J., Sheng, G. H., Yan, Y. J., Dai, J. J., and Jiang, X. C. (2018a). Prediction of dissolved gas concentrations in transformer oil based on the KPCA-FFOA-GRNN model. ENERGIES 11, 225. doi:10.3390/en11010225
Lin, J., Su, L., Yan, Y. J., Sheng, G. H., Xie, D., and Jiang, X. C. (2018b). Prediction method for power transformer running state based on LSTM_DBN network. ENERGIES 11, 1880. doi:10.3390/en11071880
Ma, X., Hu, H., and Shang, Y. (2021). A new method for transformer fault prediction based on multifeature enhancement and refined long short-term memory. IEEE Trans. Instrum. Meas. 70, 1–11. doi:10.1109/TIM.2021.3098383
Minh, D. L., Sadeghi-Niaraki, A., Huy, H. D., Min, K., and Moon, H. (2018). Deep learning approach for short-term stock trends prediction based on two-stream gated recurrent unit network. IEEE Access 6, 55392–55404. doi:10.1109/ACCESS.2018.2868970
Shaban, K. B., El-Hag, A. H., and Benhmed, K. (2016). Prediction of transformer furan levels. IEEE Trans. Power Deliv. 31, 1778–1779. doi:10.1109/TPWRD.2016.2521320
Su, L., Huang, H., Qin, L., and Zhao, W. (2022). Transformer vibration detection based on YOLOv4 and optical flow in background of high proportion of renewable energy access. Front. Energy Res. 10. doi:10.3389/fenrg.2022.764903
Wu, Z., Zhou, M., Lin, Z., Chen, X., and Huang, Y. (2021). Improved genetic algorithm and XGBoost classifier for power transformer fault diagnosis. Front. Energy Res. 9. doi:10.3389/fenrg.2021.745744
Keywords: power transformer, dissolved gas, time series prediction, gated recurrent unit, graph convolutional network
Citation: Luo D, Chen W, Fang J, Liu J, Yang J and Zhang K (2023) GRU-AGCN model for the content prediction of gases in power transformer oil. Front. Energy Res. 11:1135330. doi: 10.3389/fenrg.2023.1135330
Received: 31 December 2022; Accepted: 27 March 2023;
Published: 05 April 2023.
Edited by:
Jian Zhao, Shanghai University of Electric Power, ChinaCopyright © 2023 Luo, Chen, Fang, Liu, Yang and Zhang. This is an open-access article distributed under the terms of the Creative Commons Attribution License (CC BY). The use, distribution or reproduction in other forums is permitted, provided the original author(s) and the copyright owner(s) are credited and that the original publication in this journal is cited, in accordance with accepted academic practice. No use, distribution or reproduction is permitted which does not comply with these terms.
*Correspondence: Diansheng Luo, bGh4MjAwNzAzMjJAc2luYS5jb20=