 Ji Wang
 Hongbin Wang
 Jinbiao Xiong
94% of researchers rate our articles as excellent or good
Learn more about the work of our research integrity team to safeguard the quality of each article we publish.
Find out more
ORIGINAL RESEARCH article
Front. Energy Res., 16 March 2023
Sec. Nuclear Energy
Volume 11 - 2023 | https://doi.org/10.3389/fenrg.2023.1130459
This article is part of the Research TopicComplex Flow and Heat Transfer in Advanced Nuclear Energy systemsView all 6 articles
High-speed laser interferometry is synchronized with a high-speed camera to visualize the dynamic microlayer behavior during bubble growth in a pool boiling under pressures from 0.1 to 0.3 MPa. An Indium–Tin-Oxide (ITO) film coated on sapphire is employed as the heating unit to provide the nominal surface heat fluxes in the range from 90 to 150 kW/m2. Based on the instantaneous microlayer thickness and photographed bubble images, microlayer formation and depletion and their relationship with bubble growth are analyzed. Appreciable effects of pressure on microlayer dynamics and bubble growth have been observed. At higher pressure, the microlayer existence time decreases and consequently, the contribution of the microlayer evaporation becomes less important. At elevated pressure, the effects of liquid subcooling and surface heat flux on bubble growth become more pronounced. The dimensionless instantaneous maximum microlayer thickness,
During nucleate boiling, a thin liquid layer, i.e., the microlayer, is generated beneath the bubble during the early stage of growth, as shown in Figure 1. Generation and extinction of the microlayer has been investigated as an important mechanism contributing to nucleated bubble growth and boiling heat transfer (Zhao et al., 2002; Colombo and Fairweather, 2015). Early experimental investigation on the microlayer was indirect and mainly based on the measurement of instantaneous surface temperature. Based on the observation of the occasional drop in boiling surface temperature, Moore and Mesler (1961) proposed the hypothesis of the microlayer. Based on the deduction of the measured instantaneous wall temperature, Cooper and Lloyd (1969) obtained the microlayer thickness (6–30 μm) in toluene and the contribution of microlayer evaporation to bubble growth. They concluded that the influence of the microlayer evaporation was overwhelming in the saturated pool boiling and became less important in the case of high subcooling. Cooper and Lloyd (1969) also derived the first correlation of the initial microlayer thickness based on the theoretical analysis and measured microlayer thickness.
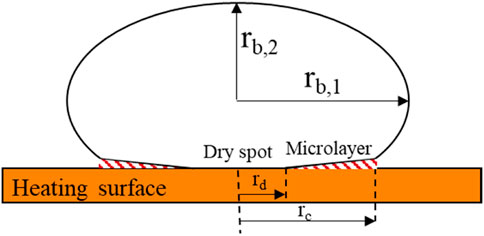
FIGURE 1. Structure of the microlayer.
Demiray and Kim (2004) investigated the FC-72 nucleating bubble growth over a constant temperature microheater array at two different subcoolings and concluded that the microlayer and contact line heat transfer were not significant. Kenning et al. (2001); Kenning and Bustnes (2007) employed liquid crystal thermography to measure the surface temperature and found that the microlayer beneath sliding bubbles can be as thick as 40–70 μm on the inclined surface in saturated water. They found that heat transfer through a microlayer contributed less than 35% of the heat required for the initial rapid growth of a bubble nucleated on the plate. Myers et al. (2005) investigated the transient temperature variation on a 10 × 10 array of constant heat flux heaters with nucleate boiling of FC-72 and stated that the microlayer evaporation contributes to no more than 23% of the total heat transferred from the surface. Yabuki and Nakabeppu (2014) employed the micro-electro-mechanical system (MEMS) sensor to measure the instantaneous wall temperature beneath a growing water bubble and found that about 50% of bubble growth resulted from the microlayer evaporation in the saturated pool boiling. Gerardi et al. (2010) employed a high-speed infrared camera to visualize the temperature variation induced by nucleating water bubbles on an Indium–Tin-Oxide (ITO) heater and analyzed the influence of microlayer on bubble growth.
The laser extinction method and laser interferometry method have been developed to directly measure the microlayer thickness. Utaka et al. (2014) measured the local microlayer thickness beneath the nucleated bubble in water and ethanol utilizing the laser extinction method in which the microlayer thickness was obtained based on the analysis of attenuated laser signal. They stated that the contribution of microlayer evaporation to bubble growth (15%–70%) increases linearly with the bubble inception wall superheat.
Sharp (1964) pioneered the interferometry measurement of microlayer thickness and obtained the interference fringe of the microlayer beneath a nucleating bubble using monochromatic and white light. Later, Voufsinos and Judd (1975) studied the growth and evaporation of the microlayer under a bubble forming on a glass heater surface with laser interferometry and high-speed photography. They found that microlayer evaporation contributed to 25% of the total nucleate boiling heat transfer rate. Utilizing laser interferometry, Koffman and Plesset (1983) studied the microlayer formation and evaporation for nucleate boiling in water and ethanol under atmospheric pressure. They found that the microlayer thickness in ethanol is 1.6 times of that for water.
Gao et al. (2013) employed a He-Ne laser to generate interference fringe for the microlayer beneath a growing ethanol bubble on an ITO heater under atmospheric pressure and obtained a dynamic change of microlayer volume and micro-contact angle. Chen et al. (2017) studied the microlayer beneath a water bubble nucleated on a glass heated with a nitrogen jet from the opposite side. They found a crest-like structure at the edge of the microlayer in the late stage. Based on the same methodology, Utaka et al. (2018) found that the microlayer evaporation contributed to the total evaporation, approximately 39% for ethanol and 14%–44% for water.
Jung and Kim (2018); Jung and Kim (2019) employed laser interferometry for microlayer thickness measurement and a high-speed infrared camera for surface temperature measurement. They found that the heat flux through the microlayer can be reasonably derived based on heat conduction and that the initial microlayer thickness in the outer region decreases because of microlayer evaporation. More recently, Narayan and Srivastava (2021) synchronized laser interferometry and rainbow schlieren deflectometry to measure the microlayer thickness and thermal field around a nucleated bubble in a saturated water pool. They concluded that the contribution of microlayer evaporation to bubble volume is less than 15%.
In the above-mentioned experiment, the microlayer beneath the nucleated bubble under atmospheric pressure or even lower pressure has been investigated. The pressure effects on microlayer dynamics have not been well investigated (2020, 2021) (Kossolapov et al., 2020; Kossolapov et al., 2021). During the actual reactor operation, the pressure reaches 15.5 MPa and it is difficult to carry out visual experiments at such high pressure. The method of the dimensionless parameter is used to reduce the high-pressure working condition to low pressure for the experiment. The similarity criterion is the dimensionless number, such as Re, Bo. It can not only ensure the accuracy of the results but also reduce the difficulty of the experiment. The bubble size in wall boiling and the microlayer contribution to the bubble growth are both greatly affected by the physical properties, especially the pressure. In order to reveal the growth mechanism of bubbles under different pressures, the laser interferometry and high-speed camera are synchronized to simultaneously visualize the microlayer dynamics and bubble growth behavior in a water pool boiling at different pressures in this paper. The effects of pressure, subcooling, and surface heat flux on the microlayer formation, depletion, and bubble growth will be discussed.
As shown in Figure 2, the experimental apparatus is a cubic stainless vessel with an inner dimension of 200 mm × 200 mm × 200 mm. Four vertical 450 W Joule heating rods are utilized to adjust the subcooling of the water pool. Eight thermocouples are located at four elevations to measure water temperature. A pressure gauge is installed on the top of the vessel to monitor the pressure in the vessel. The uncertainty of the thermocouple is ± 0.5°C. Illumination and photograph windows are fabricated on the opposite vertical walls of the vessel. The illumination light source is a LED panel. The bubble growth process is photographed using a Phantom V710 high-speed camera (HSC) with a frame rate of 7,500 Hz at the full resolution, i.e., 800 × 1280 px2. The bubble diameter or radius is determined based on the pixel analysis of high-speed images. Blurring leads to an uncertainty of 5 pixels while positioning the bubble surface in the bubble images, which is equivalent to the uncertainty of 0.1 mm in the bubble radius.
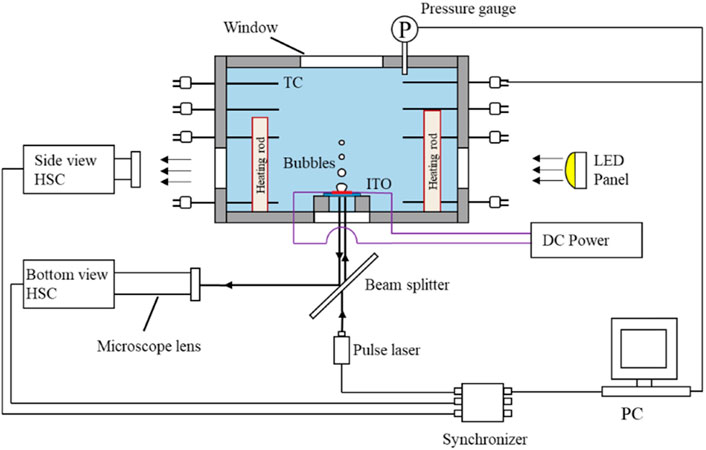
FIGURE 2. Schematic of the experimental system.
In order to facilitate visualization of interference fringe from the bottom of the heating surface, the transparent indium tin oxide (ITO) film, 650 nm in thickness, is deposited onto a cylindrical sapphire substrate, as shown in Figure 3. The deposited ITO film is etched into the H shape to assure the high heat flux appears in the center of the plate. Consequently, early bubble nucleation occurred over the narrow band of the ITO film. The static contact angle of the ITO surface is about 101.5 under the working condition of the atmospheric pressure of 20°C, as shown in Figure 3C. A gold film, 100 nm in thickness, is sputtered onto the ITO film to serve as the two terminals of the heating element. The substrate is 30 mm in diameter and 1.1 mm in thickness. The transparent heating unit is installed on a Teflon platform which is mounted over the hole on the bottom of the stainless vessel. A high-accuracy DC power unit is employed to adjust the heating power of the ITO film. The heating power supplied to the ITO heater is determined based on the current and voltage. The relative error of current and voltage measurement is ±0.1 A and ±0.01V, respectively. Assuming the uniform current density through the narrow band of ITO film, the nominal heat flux is defined and utilized in this paper. Before the experiment, the deionized water is degassed via argon injection and pre-boiling. The subcooling of the liquid is measured by two K-type thermocouples, which are arranged closer to the heating surface.
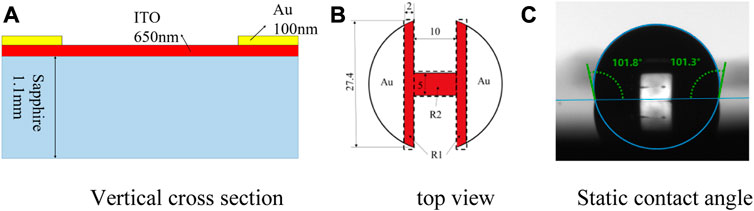
FIGURE 3. Schematic diagram of the heating unit.
The principle of laser interferometry for microlayer thickness measurement is shown in Figure 4. Reflection of incident laser occurs at the ITO top surface and the liquid microlayer surface. The two reflected laser beams interfere with each other. The phase difference of the laser beams is determined by the microlayer thickness. Hence, variation of microlayer thickness in the order of laser wavelength can be deduced based on the interval of interference fringe. At the center of dark fringes, the two reflected laser beams are in opposite phases with the corresponding microlayer thickness
where λ is the laser wavelength in the air; n is the reflective index of the microlayer, n = 1.32 is utilized in this study; m is the order of the dark fringe from center to the periphery, m = 0 is defined for the central dark spot which corresponds to the dry patch. At bright fringes, the two laser beams are in phase with the corresponding microlayer thickness
where m is the order of the bright fringe from the center to the periphery, and m = 1 is defined for the first inner fringe.
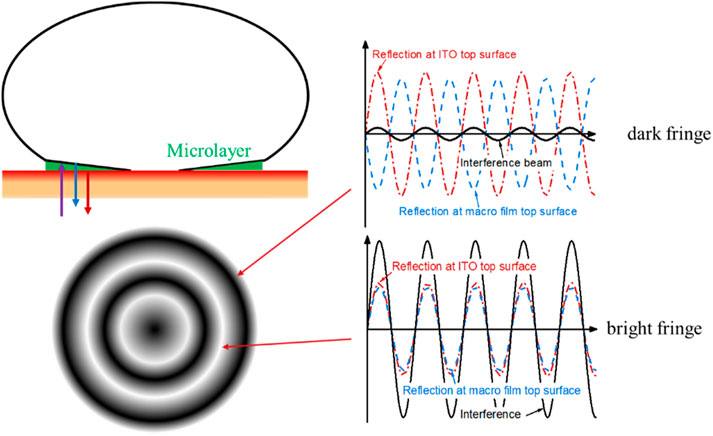
FIGURE 4. Principle of film thickness measurement with laser interferometry.
The CAVILUX pulsed diode laser with the wavelength λ = 640 nm is employed for illumination. As shown in Figure 2, the laser head is installed beneath the heating unit to illuminate from the bottom. In the experiment, the laser pulse duration is 100 ns at a frequency of 10 kHz. A beam splitter is placed between the laser head and the heating unit. The bottom-view high-speed camera (Phantom V710) with a microscopic lens is installed horizontally. The magnification factor of the microscopic lens is 7, which allows for high-resolution measurement of interference fringe. A synchronizer is utilized to synchronize the laser and the two HSCs. The synchronization time sequence is shown in Figure 5.
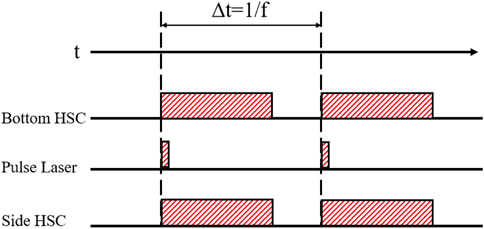
FIGURE 5. Synchronization time sequence.
In order to enhance the accuracy of microlayer thickness measurement, the background noise is subtracted from the original bottom HSC images. The centers of dark and bright fringes are localized in the enhanced images based on the grey scale. With the position of dark and bright fringes, the distribution of microlayer thickness can be determined based on Eqs 1, 2. Figure 6A shows the fringes of one frame of the post-processed images. Correspondingly, the profiles of bright fringes indicating the microlayer thickness along
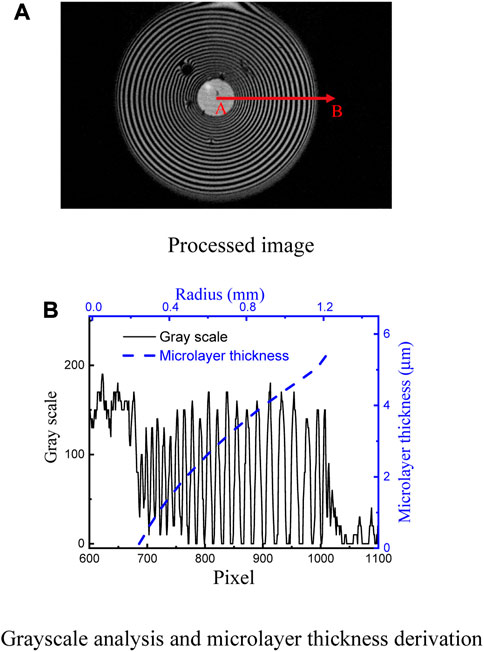
FIGURE 6. An example of fringe image processing.
The relative error of the microlayer thickness results mainly from the error of laser wavelength and the error in fringe position determination which was a result of image processing. The wavelength error of the CAVILUX pulsed diode laser is ±10 nm. According to Eqs 1, 2, the relative error of microlayer thickness equals that of laser wavelength, i.e., ±1.56%. The relative error in positioning the dark and bright fringe center is in the order of ±1 pixel in the image of the bottom HSC, which is equivalent to ±3 μm.
The defects on the edges of the etching pattern are natural nucleation points. Although the growth process of a single bubble is selected to be studied under the condition of low heat flux, without bubble overlap there can also be some interaction between the center bubble and the edge bubble. When the center bubble grows, the edge can generate bubbles at the same time. The edge bubble size is small since it mostly grows at the edge of the ITO and the heat flux is lower. Through the comparison of the images, it is found that in the initial stage of the growth of the central bubble, the edge bubble does not influence it due to the small volume of both of them. In the late stage of the growth of the central bubble, its volume is larger and it will interact with the small edge bubbles and the shape will be deformed. However, the interaction process often occurs in the center bubble departure period, and the microlayer has been evaporated totally. That is to say the small edge bubbles have no effect on the microlayer behavior but have some effect on the bubble departure morphology. Its influence on the deformed bubble is approximately 8% by analyzing the shape of the center bubble.
The measurement is carried out under eight test conditions, as shown in Table 1, which allows for the investigation of pressure, subcooling, and surface heat flux effect. The test pressure ranges from 0.1 to 0.3 MPa, while the subcooling ranges from 2°C to 7°C. The microlayer depletion time,
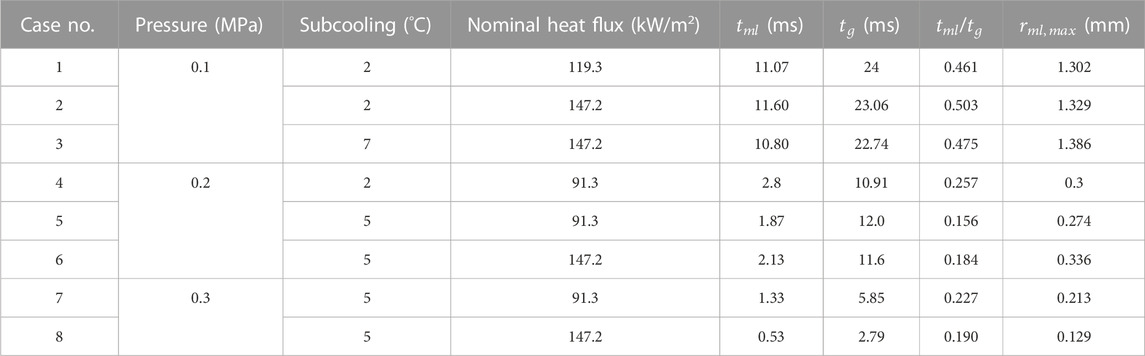
TABLE 1. Parameter configuration of the test matrix.
Shown in Figure 7 are the synchronized images of microlayer interference fringe and bubble side view obtained in case No. 1. As can be seen in Figure 7A, the inception of bubble nucleation is accompanied by the formation of the microlayer. At the same time, a dry spot or patch, i.e., the bright spot, appears in the center of the interference fringe. In the early stage of bubble growth, the bubble is semi-elliptical, and the interference fringes are concentric rings expanding rapidly in the radial direction, as shown in Figure 7B. As the fringes expand outwards, the spacing between neighboring fringes becomes non-uniform, i.e., the inner fringe spacing is dense, while the outer fringes distribute coarsely. Good concentricity of inner fringes indicates the effect of force balance at the triple-phase line. The outer fringes distort appreciably. Such distortion is a result of the asymmetricity of bubble growth which is weak and can hardly be observed from the side-view image. The dry spot grows relatively slowly. Finally, all the microlayer-covered surface becomes dry as the microlayer depletes. The dry spot remains at the maximum radius for a certain period during which the bubble starts to rise away from the surface. In the final stage, the dry patch shrinks as the bubble departs from the surface.
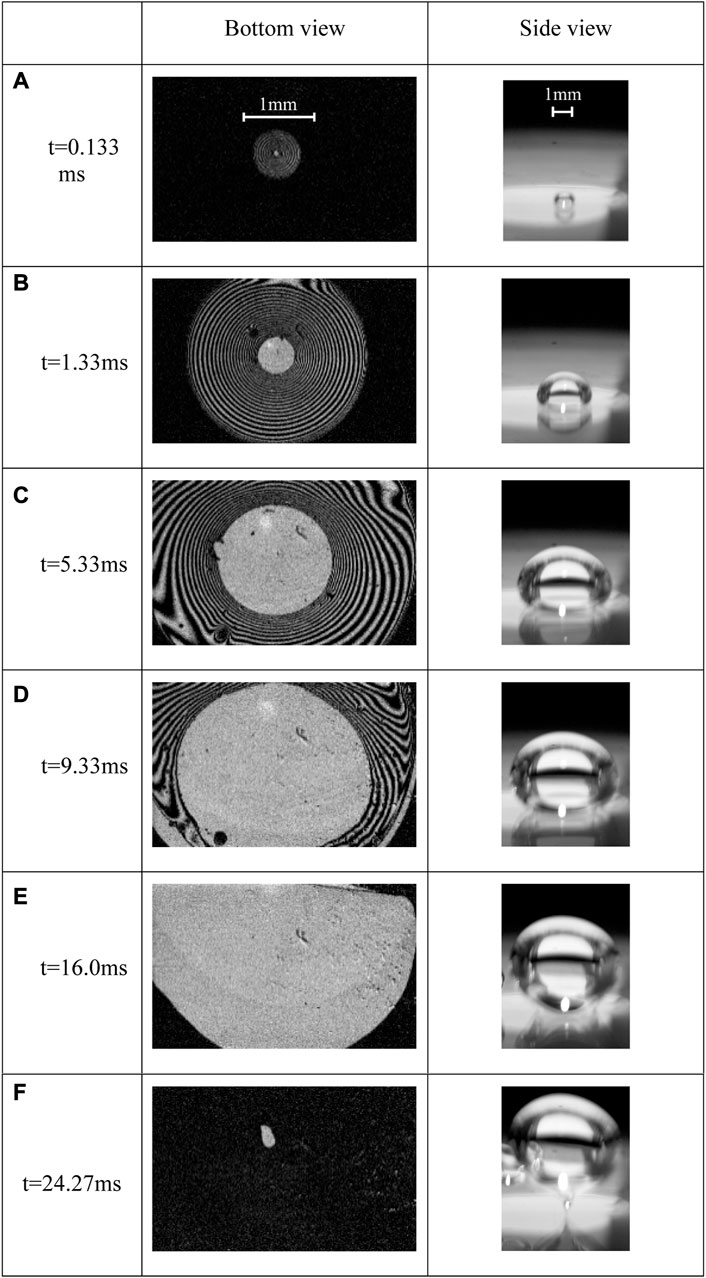
FIGURE 7. Interference fringes (left) and bubble side views (right) in case No. 1.
In Figure 8, the bubble radius, dry spot radius, and contact radius are quantitatively compared for the test cases at p = 0.1 MPa. In order to facilitate the comparison, in the abscissa of Figure 8, the time scale is normalized by the microlayer depletion time, i.e.,
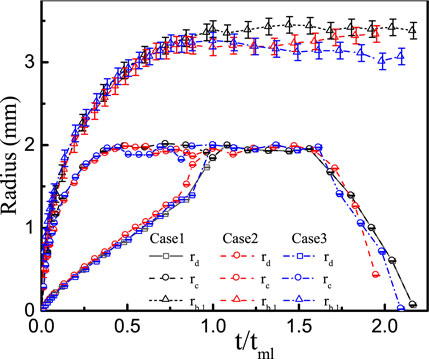
FIGURE 8. The evolution of dry spot radius, contact radius, and bubble radius.
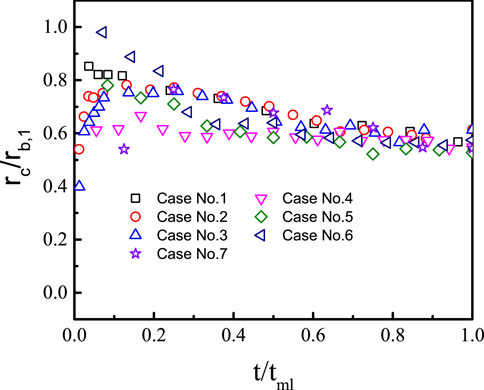
FIGURE 9. The profile of ratio rc/rb,1 under different pressures.
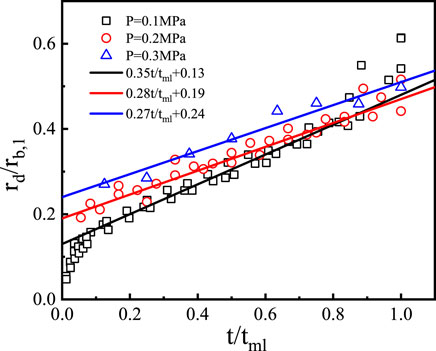
FIGURE 10. The profile of ratio rd/rb,1 under different pressures.
The coefficients
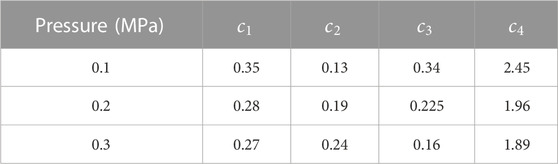
TABLE 2. Coefficients in correlations of the dry spot radius and the microlayer thickness.
Similar observations were reported by Duan et al. (2013) for saturated water pool boiling with surface heat flux of 28.7 kW/m2, by Jung and Kim (2014) for water pool boiling (
The instantaneous profiles of microlayer thickness obtained in case No.1 are shown in Figure 11. The maximum microlayer thickness,
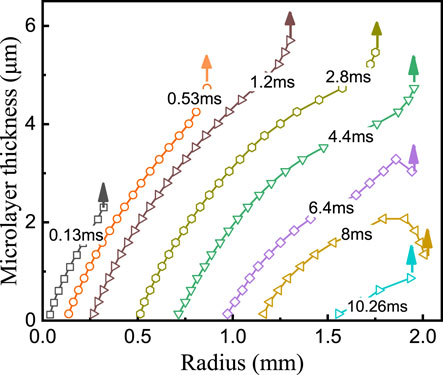
FIGURE 11. Microlayer thickness in the growth period in case No. 1
The initial microlayer thickness,
When
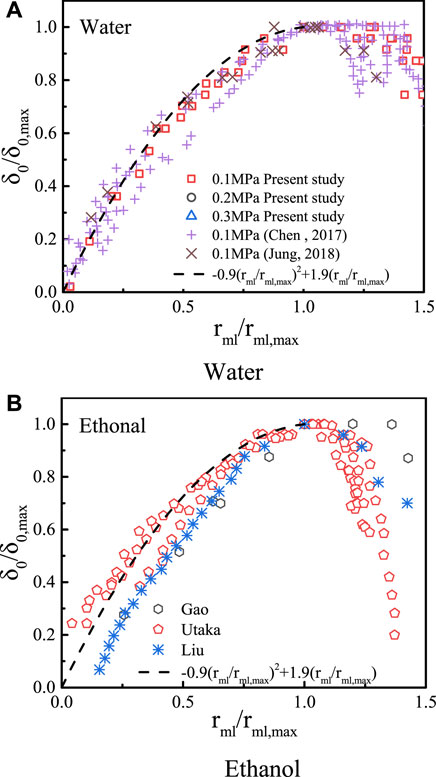
FIGURE 12. Normalized initial microlayer thickness in the pool boiling at atmospheric pressure.
As shown in Figure 12A, we can see that at atmospheric pressure, the profile of the normalized initial microlayer thickness is in a consistent form and our data correlated well with other experimental data collected from the studies shown in Table 3. However, the data of ethanol have little difference from water. The maximum radius is smaller and the initial thickness decreases more after reaching the maximum value. For water, the initial thickness distribution is consistent, despite the different working conditions of each experiment.
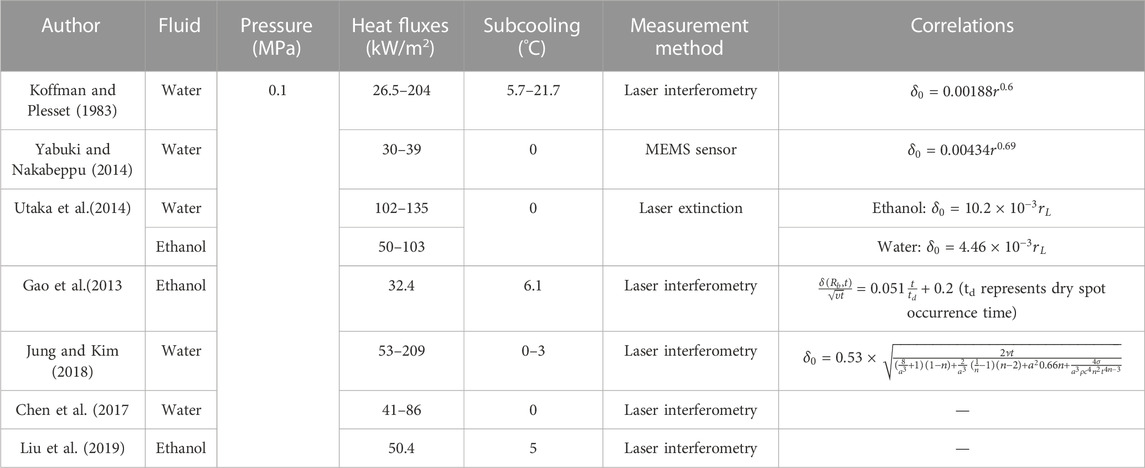
TABLE 3. Previous experimental studies for the initial microlayer thickness.
Previous experimental studies for the initial microlayer thickness are summarized in Table 3. The studies used different technologies and covered different fluids, i.e., water and ethanol, heat fluxes, and subcooling, but all of these were carried out at atmospheric pressure. Various initial microlayer thickness models were proposed. The comparison between the initial thickness distribution in the present study and these models is shown in Figure 13. In these models’ prediction results, the result of Koffman and Plesset (1983) are all smaller than those of others. For the present data, when r < 1.25 mm, the data are in good agreement with the predicted results of Yabuki and Nakabeppu (2014) and Utaka et al. (2014). However, when 1.25 < r < 2.0, the experimental values are lower than the predicted values. Besides, when r > 1.8 mm, the experimental values even decrease. This is due to the rapid growth of the bubble and the small amount of evaporation inside in the initial stage. As the bubble size increases, internal evaporation becomes stronger. Due to the depletion of the microlayer by evaporation, the initial thickness is lower than predicted by the linear model in the late period. Yabuki and Nakabeppu (2014) also suggested that the increase rate of the initial microlayer thickness is gradually slowed down, which is consistent with the observations of this experiment. However, the model of Yabuki and Nakabeppu (2014) still overestimates the initial microlayer thickness.

FIGURE 13. Comparison of experimental data with the models.
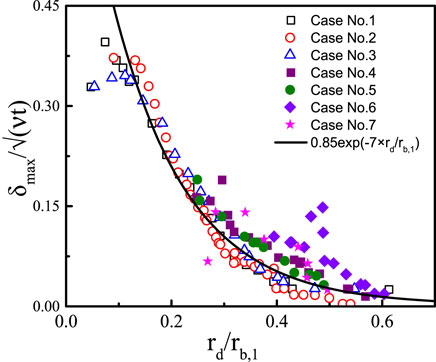
FIGURE 14. Relation between maximum thickness and ratio rd/rb,1.
Substituting Eq. 3 into Eq. 5, the maximum thickness can be correlated as
The coefficients
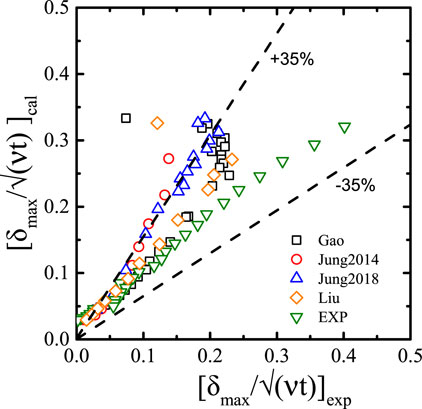
FIGURE 15. Comparison between the experimental data and the prediction with Eq. 6.
In order to intuitively study the influence of pressure on the microlayer thickness, the distribution of the dimensionless thickness under different pressure is compared and shown in Figure 16, where the microlayer thickness is normalized with its maximum value, and the radial position is normalized with the maximum contact radius, e.g., rc,max. Due to a relatively short microlayer depletion time at the pressure 0.3 MPa, the first appearance of the interference fringe is
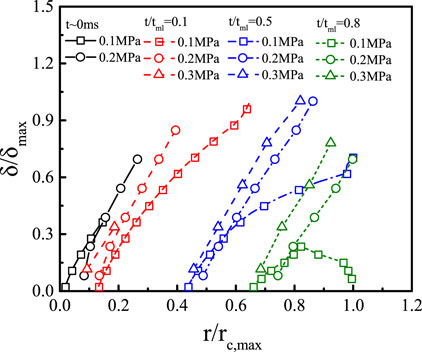
FIGURE 16. Comparison of microlayer under different pressures.
3/6/2023 In order to investigate the bubble shape during bubble growth, the ratio

FIGURE 17. Axis ratio rb,1/rb,2 under different pressures.
The mechanism of microlayer depletion results from the evaporation and hydrodynamic flow of the microlayer. If we assume the frozen state of the microlayer, evaporation is the sole mechanism for microlayer depletion; the local microlayer evaporation rate can be estimated based on the reduction of the microlayer thickness. The evaporated microlayer volume during the time interval between frame i and i+1,
where
In order to evaluate the instantaneous bubble volume, the coordinates of the bubble edge
In Figure 18, the bubble volume calculated with Eq. 9 and the bubble volume corresponding to the microlayer evaporation estimated with Eq. 8 are compared for the test cases at the pressure of 0.1 and 0.2 MPa. Besides, the appreciable effect of pressure on the bubble size and the contribution ratio of microlayer evaporation to bubble growth is sensitive to pressure. At atmospheric pressure, the microlayer shows an overwhelming impact on bubble growth. As we can see, at the very beginning of bubble nucleation, the estimated bubble size with Eq. 8 is larger than the bubble size measured, i.e.,
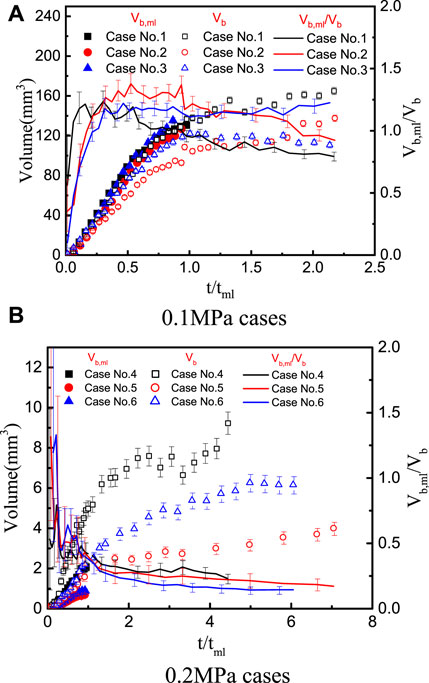
FIGURE 18. The relation between microlayer evaporation and bubble growth.
The dominance of heat flux on bubble growth is observed during the initial phase of bubble growth for all pressures. For example, similar bubble growth is observed in cases No. 1 and 2 and No. 4 and 5, when
In Figure 19, the instantaneous microlayer thickness at selected radial positions is shown for cases No. 1 and 4. It is found that at the same radial position, the microlayer depletes linearly. When moving outwards, the magnitude of
where
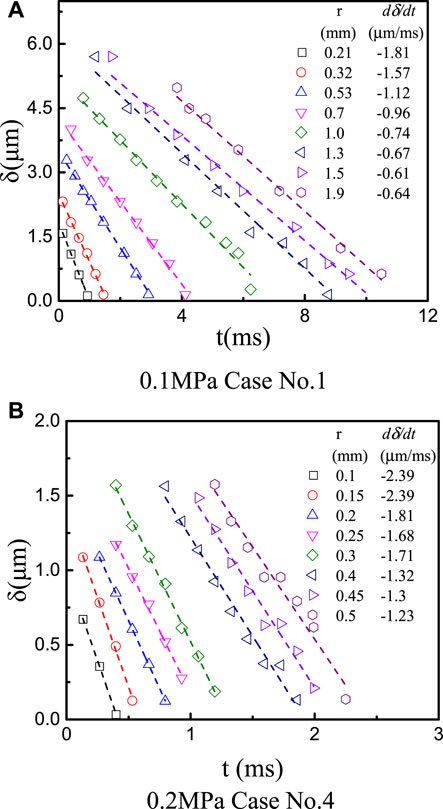
FIGURE 19. Profile of microlayer thickness depletion in cases No. 1 and 4
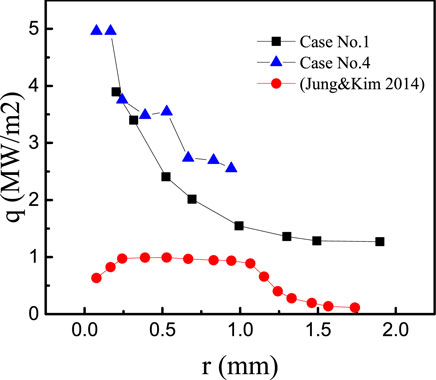
FIGURE 20. Derived local heat flux assuming that evaporation is the only mechanism for microlayer depletion.
The equivalent bubble radius is calculated based on the bubble volume and shown in Figure 21 for the cases at the pressure of 0.1 and 0.2 MPa. The cases at the pressure of 0.3 MPa are not included here due to comparably large relative uncertainty. The bubble growth rate resulting from microlayer evaporation is formulated by Cooper and Lloyd (1969).
where c = 0.8 is taken and the microlayer Jakob number is defined by
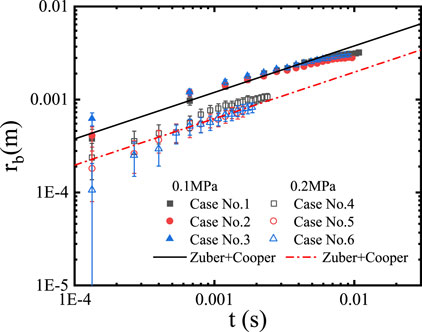
FIGURE 21. Evaluation of bubble growth models.
Forster and Zuber (1954) model was proposed to consider bubble growth by the evaporation of superheated fluid around the bubble. The corresponding growth rate is defined by
In the superheated layer, the characteristic temperature is taken as
According to Gerardi et al. (2010), Duan et al. (2013), Yabuki and Nakabeppu (2014), and Sato and Niceno (2015), it is fair to take
With Eqs 13, 15, the above equation can be further written as
Increasing pressure reduces the Prandtl number and, consequently, increases the ratio of the microlayer and superheated layer contribution to bubble growth. Based on the Cooper-Lloyd model and the Zuber model, the microlayer evaporation contributes to 68.1% and 70.1% of bubble growth, at 0.1 and 0.2 MPa, respectively, which is not consistent with what is shown in Figure 18. Another fact demanding caution in bubble growth modeling is that the microlayer evaporation contributes to bubble growth in the early phase, while the superheated layer evaporation becomes important in a later phase. The current models do not seem capable to account for such a fact. Hence, more extensive investigation on microlayer evaporation under diverse conditions is still desired to achieve mechanistic prediction of bubble growth.
The laser interferometry and high-speed camera are synchronously employed to measure the microlayer behavior and bubble growth in pool boiling under pressure from 0.1 to 0.3 MPa. Based on the comprehensive analysis of the formation and depletion of the microlayer and the bubble growth, the following conclusions are reached.
• Pressure shows a significant influence on microlayer formation and depletion, as well as bubble growth. At higher pressure, the duration with the microlayer is comparably short and, consequently, the contribution of microlayer evaporation becomes less important. Compared with heat flux, the subcooling shows a more appreciable effect on bubble growth. The effect of liquid subcooling and surface heat flux on bubble growth is more pronounced at elevated pressure.
• The analysis of microlayer depletion shows that the dimensionless instantaneous maximum microlayer thickness,
• The local microlayer thickness decreases linearly with time. The assumption of the negligible hydrodynamic flow of the microlayer leads to an overestimation of surface heat flux based on the sole depletion mechanism, i.e., evaporation. The hydrodynamic flow of the microlayer cannot be neglected and not all the microlayer is evaporated for the bubble growth.
• Combining the Cooper-Lloyd model and the Zuber model, the measured bubble growth can be roughly predicted, though the contribution portion of the microlayer and superheated layer to bubble growth predicted by the models is not consistent with the experimental observation.
The original contributions presented in the study are included in the article/supplementary material, further inquiries can be directed to the corresponding author.
JW: Investigation, methodology, data curation, software, and writing—original draft. HW: Investigation, validation, and formal analysis. JX: Supervision, investigation, resources, writing-original draft, writing-review and editing, and funding acquisition.
The authors are grateful for the financial support of the National Natural Science Foundation of China (Grant No. 52076132).
The authors declare that the research was conducted in the absence of any commercial or financial relationships that could be construed as a potential conflict of interest.
All claims expressed in this article are solely those of the authors and do not necessarily represent those of their affiliated organizations, or those of the publisher, the editors and the reviewers. Any product that may be evaluated in this article, or claim that may be made by its manufacturer, is not guaranteed or endorsed by the publisher.
Chen, Z., Haginiwa, A., and Utaka, Y. (2017). Detailed structure of microlayer in nucleate pool boiling for water measured by laser interferometric method. Int. J. Heat Mass Transf. 108, 1285–1291. doi:10.1016/j.ijheatmasstransfer.2017.01.003
Colombo, M., and Fairweather, M. (2015). Prediction of bubble departure in forced convection boiling: A mechanistic model. Int. J. Heat Mass Transf. 85, 135–146. doi:10.1016/j.ijheatmasstransfer.2015.01.103
Cooper, M., and Lloyd, A. J. P. (1969). The microlayer in nucleate pool boiling. Int. J. Heat Mass Transf. 12 (8), 895–913. doi:10.1016/0017-9310(69)90154-9
Demiray, F., and Kim, J. (2004). Microscale heat transfer measurements during pool boiling of FC-72: Effect of subcooling. Int. J. Heat Mass Transf. 47 (14-16), 3257–3268. doi:10.1016/j.ijheatmasstransfer.2004.02.008
Duan, X., Phillips, B., McKrell, T., and Buongiorno, J. (2013). Synchronized high-speed video, infrared thermometry, and particle image velocimetry data for validation of interface-tracking simulations of nucleate boiling phenomena. Exp. Heat. Transf. 26 (2-3), 169–197. doi:10.1080/08916152.2012.736837
Forster, H. K., and Zuber, N. (1954). Growth of a vapor bubble in a superheated liquid. J. Appl. Phys. 25 (4), 474–478. doi:10.1063/1.1721664
Gao, M., Zhang, L., Cheng, P., and Quan, X. (2013). An investigation of microlayer beneath nucleation bubble by laser interferometric method. Int. J. Heat Mass Transf. 57 (1), 183–189. doi:10.1016/j.ijheatmasstransfer.2012.10.017
Gerardi, C., Buongiorno, J., Hu, L. w., and McKrell, T. (2010). Study of bubble growth in water pool boiling through synchronized, infrared thermometry and high-speed video. Int. J. Heat Mass Transf. 53 (19-20), 4185–4192. doi:10.1016/j.ijheatmasstransfer.2010.05.041
Jung, S., and Kim, H. (2014). An experimental method to simultaneously measure the dynamics and heat transfer associated with a single bubble during nucleate boiling on a horizontal surface. Int. J. Heat Mass Transf. 73, 365–375. doi:10.1016/j.ijheatmasstransfer.2014.02.014
Jung, S., and Kim, H. (2018). Hydrodynamic formation of a microlayer underneath a boiling bubble. Int. J. Heat Mass Transf. 120, 1229–1240. doi:10.1016/j.ijheatmasstransfer.2017.12.098
Jung, S., and Kim, H. (2019). Observation of the mechanism triggering critical heat flux in pool boiling of saturated water under atmospheric pressure. Int. J. Heat Mass Transf. 128, 229–238. doi:10.1016/j.ijheatmasstransfer.2018.08.128
Kenning, D. B. R., and Bustnes, O. E. (2007). Liquid crystal studies of sliding vapour bubbles. Heat Mass Transf. 45 (7), 867–880. doi:10.1007/s00231-007-0262-7
Kenning, D. B. R., Kono, T., and Wienecke, M. (2001). Investigation of boiling heat transfer by liquid crystal thermography. Exp. Therm. Fluid Sci. 25, 219–229. doi:10.1016/s0894-1777(01)00070-x
Koffman, L. D, P. M. S., and Plesset, M. S. (1983). Experimental Observations of the Microlayer in vapor bubble Growth on a heated solid. J. Heat Transf. 105 (3), 625–632. doi:10.1115/1.3245631
Kossolapov, A., Chavagnat, F., Nop, R., Dorville, N., Phillips, B., Buongiorno, J., et al. (2020). The boiling crisis of water under exponentially escalating heat inputs in subcooled flow boiling at atmospheric pressure. Int. J. Heat Mass Transf. 160, 120137. doi:10.1016/j.ijheatmasstransfer.2020.120137
Kossolapov, A., Phillips, B., and Bucci, M. (2021). Can LED lights replace lasers for detailed investigations of boiling phenomena? Int. J. Multiph. Flow 135, 103522. doi:10.1016/j.ijmultiphaseflow.2020.103522
Liu, J.-n., Gao, M., Zhang, L. s., and Zhang, L. x. (2019). A laser interference/high-speed photography method for the study of triple phase contact-line movements and lateral rewetting flow during single bubble growth on a small hydrophilic heated surface. Int. Commun. Heat Mass Transf. 100, 111–117. doi:10.1016/j.icheatmasstransfer.2018.12.005
Moore, F. D., and Mesler, R. B. (1961). The measurement of rapid surface temperature fluctuations during nucleate boiling of water. AIChE J. 7 (4), 620–624. doi:10.1002/aic.690070418
Myers, J. G., Yerramilli, V. K., Hussey, S. W., Yee, G. F., and Kim, J. (2005). Time and space resolved wall temperature and heat flux measurements during nucleate boiling with constant heat flux boundary conditions. Int. J. Heat Mass Transf. 48 (12), 2429–2442. doi:10.1016/j.ijheatmasstransfer.2004.12.050
Narayan, L. S., and Srivastava, A. (2021). On the identification and mapping of three distinct stages of single vapor bubble growth with the corresponding microlayer dynamics. Int. J. Multiph. Flow 142, 103722. doi:10.1016/j.ijmultiphaseflow.2021.103722
Sato, Y., and Niceno, B. (2015). A depletable micro-layer model for nucleate pool boiling. J. Comput. Phys. 300, 20–52. doi:10.1016/j.jcp.2015.07.046
Utaka, Y., Kashiwabara, Y., Ozaki, M., and Chen, Z. (2014). Heat transfer characteristics based on microlayer structure in nucleate pool boiling for water and ethanol. Int. J. Heat Mass Transf. 68, 479–488. doi:10.1016/j.ijheatmasstransfer.2013.09.063
Utaka, Y., Hu, K., Chen, Z., and Morokuma, T. (2018). Measurement of contribution of microlayer evaporation applying the microlayer volume change during nucleate pool boiling for water and ethanol. Int. J. Heat Mass Transf. 125, 243–247. doi:10.1016/j.ijheatmasstransfer.2018.04.044
Voufsinos, C. M., and Judd, R. L. (1975). Laser interferometric investigation of the microlayer evaporation phenomenon. J. Heat Transf. 97, 88–92. doi:10.1115/1.3450295
Yabuki, T., and Nakabeppu, O. (2014). Heat transfer mechanisms in isolated bubble boiling of water observed with MEMS sensor. Int. J. Heat Mass Transf. 76, 286–297. doi:10.1016/j.ijheatmasstransfer.2014.04.012
Zhao, Y.-H., Masuoka, T., and Tsuruta, T. (2002). Unified theoretical prediction of fully developed nucleate boiling and critical heat flux based on a dynamic microlayer model. Int. J. Heat Mass Transf. 45 (15), 3189–3197. doi:10.1016/s0017-9310(02)00022-4
cp specific heat
D diameter
f frequency of camera
Ja jakob number
n refractive index
Pr prandtl number
r radius
rL distance between bubble site and measurement position
rml,max distance from bubble inception site when microlayer first reached its maximum value
t time
tg bubble growth time
tml microlayer depletion time
V volume
xe bubble edge
ye bubble edge
△T the wall superheat
δ0 initial microlayer thickness
θ angle
λ wavelength of laser
ρ the density of fluid or gas
0 initial
b bubble
b,1 the horizontal radius
b,2 the vertical radius
c contact
d dry spot
f fluid
g gas
i,j time
max the maximum value
mic-gas the microlayer evaporation amount
ml microlayer
sup superheat
total the total amount
w wall
Keywords: laser interferometry, microlayer dynamics, pool boiling, visualization, pressure effect
Citation: Wang J, Wang H and Xiong J (2023) Experimental investigation on microlayer behavior and bubble growth based on laser interferometric method. Front. Energy Res. 11:1130459. doi: 10.3389/fenrg.2023.1130459
Received: 23 December 2022; Accepted: 20 February 2023;
Published: 16 March 2023.
Edited by:
Wei Ding, Helmholtz Association of German Research Centres (HZ), GermanyReviewed by:
Wan Sun, Chongqing University, ChinaCopyright © 2023 Wang, Wang and Xiong. This is an open-access article distributed under the terms of the Creative Commons Attribution License (CC BY). The use, distribution or reproduction in other forums is permitted, provided the original author(s) and the copyright owner(s) are credited and that the original publication in this journal is cited, in accordance with accepted academic practice. No use, distribution or reproduction is permitted which does not comply with these terms.
*Correspondence: Jinbiao Xiong, eGlvbmdqaW5iaWFvQHNqdHUuZWR1LmNu
Disclaimer: All claims expressed in this article are solely those of the authors and do not necessarily represent those of their affiliated organizations, or those of the publisher, the editors and the reviewers. Any product that may be evaluated in this article or claim that may be made by its manufacturer is not guaranteed or endorsed by the publisher.
Research integrity at Frontiers
Learn more about the work of our research integrity team to safeguard the quality of each article we publish.