
94% of researchers rate our articles as excellent or good
Learn more about the work of our research integrity team to safeguard the quality of each article we publish.
Find out more
ORIGINAL RESEARCH article
Front. Energy Res., 10 March 2023
Sec. Sustainable Energy Systems
Volume 11 - 2023 | https://doi.org/10.3389/fenrg.2023.1130339
This article is part of the Research TopicEnabling technologies and business models for energy communitiesView all 15 articles
 Zexia Zhao1*†
 Peiqiong Wang2*†
Climate risk to human survival and progress can no longer be disregarded, nor can the reduction of carbon emissions be postponed. How can economic progress and carbon emission reduction be reconciled? This research studied the relationship between managerial skill and carbon emission performance. We used the Shanghai and Shenzhen A-shares data of Chinese heavy polluters from 2014 to 2019 to assess the impact of managerial competency on business carbon emission performance using a temporal and individual fixed effects model. We discovered that management competency can greatly contribute to the enhancement of carbon emission performance inside corporations. The stepwise regression technique was then utilized to examine the mediating influence of financing limitations and financial status. This study validated the threshold effect of internal pay equity among corporate managers using a threshold regression model.
The average global temperature has grown by 1.1°C since the beginning of the industrial revolution. And the temperature of the Earth continues to rise. Environmental pollution poses a grave threat to human existence and progress, according to the Intergovernmental Panel on Climate Change (IPCC), which forecasts that the Earth’s temperature will rise by 1.5°C by 2052 compared to pre-industrial revolution levels (Ginglinger and Moreau, 2019). The EU was one of the early organisations to focus on the issue, and they launched a series of early programmes to promote the transformation of the industry (Streimikiene et al., 2022). As the largest emitter of carbon in the world and a responsible power, China has been actively involved in carbon reduction. At the 75th session of the United Nations General Assembly, President Xi Jinping established a target for China to reach “peak carbon” by 2030 and “carbon neutrality” by 2060. The Fifth Plenary Session of the 19th Central Committee of the Communist Party of China advocated for speeding green and low-carbon development, and the 20th National Congress of the Communist Party of China proposed once again to pursue “carbon peaking” and “carbon neutrality” aggressively. Carbon emissions are primarily caused by carbon dioxide emitted during human production and daily life, and are intimately tied to economic growth. While establishing the goals of “carbon peaking” and “carbon neutrality,” we should not suffocate on them and consider economic growth. Carbon reduction requires the involvement of all aspects of society (Stankuniene et al., 2020). As the core of the economy, firms are responsible for achieving the “carbon peaking” and “carbon neutrality” goals through lowering emissions at their source. The coordination of economic development and carbon emission reduction is consistent with the national goal of sustainable development and plays a crucial role in the green transformation of businesses.
The Chinese government and official organizations have initiated a series of environmental protection measures. The Chinese government issued the Announcement on Corporate Environmental Information Disclosure in 2003 to encourage corporations to disclose environmental information voluntarily. And in 2012, the CBRC issued the Green Credit Guidelines, urging financial institutions to strengthen credit management of corporate pollution and requiring lending companies to strengthen environmental information disclosure. To promote the green development of the financial system, the Bank of China, the Ministry of Finance, and other departments issued the “Guidelines for Building a Green Financial System” in 2016. In 2016, the Industrial and Commercial Bank of China led the way in conducting environmental risk stress tests based on the thermal power and cement industries, followed by the Bank of China, China Construction Bank, and additional financial institutions. In 2021, Bank of China became an official TCFD supporting institution.
Concerning the calculation of carbon emission performance, neoclassical economic theory employs SBM-DEA to calculate total factor productivity from the perspective of supply and output, with total factor productivity becoming an increasingly significant indicator of economic development (Young, 1995). To compensate and repair the ecological damage caused by environmental pollution, however, a certain level of capital and human input is required; therefore, total factor productivity without environmental pollution consideration would overestimate the level of economic development (Xiao-yu and Zi-xuan, 2022). Green total factor productivity is a more precise indicator of production efficiency. Later, Afsharian and Ahn, 2015 subdivided pollutants into carbon dioxide emissions and utilized this information to calculate the carbon performance of companies.
However, for calculation and data collection purposes, academics typically base their calculations on regions and rarely consider microeconomic enterprises. Based on a country-level analysis of 88 economic agents from 1975 to 2013, Bai et al. (2019) determined that developed countries have significantly higher carbon emission performance than developing countries. Li and Wang (2019) conducted an empirical study utilizing regional data and discovered that the carbon emission performance of cities in central and western China grew more slowly than that of developed eastern coastal provinces and cities. In contrast, Dong et al. (2018) conducted an empirical study from 1992 to 2012 using data from China’s construction industry and other industries to identify industries with relatively low carbon emission intensity. Ioanna et al. (2022) also base their projections on national and regional levels. Due to the limitations of carbon emission detection technology, measuring the carbon emissions of businesses is indeed challenging. However, abandoning the research would result in a dearth of microeconomic agent-level literature. More reasonable measurement methods can help government departments to introduce adaptive policies and the business sector to choose viable development strategies (Sebos et al., 2020). Therefore, this study will examine the carbon emission performance of individual businesses from the perspective of microeconomic agents. What factors affect the performance of carbon? The process of economic development generates carbon emissions invariably, but once the economy reaches a certain size, both society and the individual economy have the motivation and capacity to reduce carbon emissions (Zhao et al., 2020). Even more literature exists on the effect of technological innovation on carbon emission performance. Technological innovation can enhance a company’s carbon performance by transforming its carbon assets (Liu et al., 2023). Technological innovation can improve the efficiency of energy use to reduce carbon emissions from the demand side in terms of energy consumption (Xu et al., 2021). On the output side, technological innovation can reduce carbon emissions and increase profits (Gu and Su, 2018). Current research on the economic repercussions of managers focuses on corporate finance, investment and financing, and the quality of corporate accounting data. Strong managers typically have a clear understanding of the company’s financial situation and can avoid tax risks to some extent (Koester et al., 2017). With information asymmetry, managers may also engage in surplus management for private gain, resulting in degraded accounting information for the company (Call et al., 2014). Managers with strong competencies also integrate the company’s resources effectively, mitigating underinvestment caused by information asymmetry (Chen S. et al., 2021). However, how does managerial competence affect a company’s carbon performance? There is an absence of pertinent research. This study will investigate the impact of managerial capability on the carbon performance of firms, as well as the transmission mechanism in terms of the degree of external financing constraints and the internal financial position of firms.
The first part is an introduction. The second part is a literature review. The third part introduces the theory used in this paper and formulates the hypothesis, while the research design is then based on the research hypothesis. The fourth part is the empirical analysis. Part V is further research. The sixth part is the conclusion.
Due to the requirements of the DEA calculation method for balanced panel data and the lack of certain data in the China Statistical Yearbook, the sample for this study was comprised of Chinese Shanghai and Shenzhen A-share heavy polluters from 2014 to 2019. After testing, we employed individual and time dual fixed effects models to examine the association between manager competency and carbon emission performance. The transmission pathway between the degree of external financing constraints and the internal financial position of firms was then validated using a series of tests. The incentive effect of internal pay equity was finally examined using threshold regression.
The following are the marginal contributions of this study: 1) this study proposed a method to measure corporate carbon performance based on prior research; 2) this study is the first to examine the role of corporate managers’ ability on carbon performance, thereby enriching the literature on carbon performance; and 3) this study took the degree of external financing constraints and internal financial status as the transmission path, thereby expanding the scholars’ understanding of the carbon emission performance transmission mechanism.
When measuring relative efficiency using multiple inputs and multiple outputs, scholars mostly use data envelopment analysis (DEA). Traditional DEA models include CCR and BBC models, which are measured from both radial and angular directions (Chen W. et al., 2021). Tone and Sahoo (2004) conducted data envelopment analysis from non-radial and non-angular directions and proposed SBM model, which takes into account the variation of the relaxation degree. As for the application to carbon emission performance, Zhou et al. (2012) defined carbon emission performance as the ratio of potential carbon emission intensity to actual carbon emission intensity. And Zhang and Choi, 2013 considered CO2 as a non-desired output and used the non-radial Malmquist index to calculate carbon emission efficiency. While the Malmquist index cannot have intersection with the production Frontier surface along the direction of the direction vector in period t+1, the problem of infeasible solution appears. Pastor and Lovell (2005) proposed Global Malmquist to solve it. In this study, the SBM-DDF model is used to calculate the carbon performance of a firm by combining the Global Malmquist index, where labor, capital and energy are considered as inputs and operating income and CO2 emissions are considered as outputs.
What factors affect the performance of carbon? Innovation in technology is one of them. Technological innovation can help firms increase their productivity (Wang et al., 2021; Desalegn and Tangl, 2022; Li J. et al., 2022), and when firms have more advanced technology, they can often obtain higher returns with fewer inputs of production materials, thereby increasing the output desired by their business activities (Sun et al., 2021). As for green technology innovation, green technology innovation requires more investment on the short term (Acemoglu et al., 2012). By utilizing clean energy and green innovation technologies, businesses can optimize their energy mix and reduce carbon emissions at the source (Liu et al., 2022a; Yang and Nie, 2022). Even if firms continue to use non-clean energy after the introduction of green technology, the energy use efficiency is improved, which indirectly reduces the firm’s carbon emissions (Liu et al., 2022b), thereby reducing the undesirable output of the firm’s production activities. Secondly, the economic situation. The unstable financial situation of businesses will cause panic among stock market investors, and the cost of using capital will rise as a result of the “financial accelerator” resulting in a vicious cycle of increasing external financing constraints and escalating financial difficulties (Candian and Dmitriev, 2020). As a result, firms’ business decisions may change, and they may become “short-sighted” in selecting projects with high short-term returns in order to signal good business on the capital market (Chiarini et al., 2022; Nicolas, 2022). As for technological innovation, it is difficult to have positive feedback on short-term financial performance (Acemoglu et al., 2012), and even if it is in line with sustainable development and can contribute to the achievement of the “carbon peaking” and “carbon neutrality” goals, companies will to some extent ignore it in their actual operations. Therefore, the financial market can be expanded to improve the financial situation of businesses in order to promote innovation in green technology (Liu et al., 2022c). Third, the regional situation. If there are a large number of “zombie enterprises” in the economic environment surrounding enterprises that rely on debt to continue operations, their carbon emission performance may be affected. Because the “pool of capital” is limited, “zombie enterprises” occupy an excessive amount of capital in the financial market for an extended period of time, but their output is less efficient, which can “crowd out” the financial market (Du and Li, 2019). Businesses that could have used these funds for technological innovation would have missed out on the chance to reduce their carbon emissions. Fourthly, the government’s policy guidance will affect businesses’ carbon performance. Improving the carbon performance of businesses will affect their pursuit of benefits in the short term, but the production and operation of businesses must be subject to the rules of society, and businesses must obtain “legitimacy” by complying with mandatory rules (Chen et al., 2022). After the government enacts relevant laws and regulations, enterprises will actively pay for the policy and regulations in order to gain social reputation in order to adhere to the law. As is the case with the pursuit of carbon performance, the purpose of businesses is to obtain profits. However, because the negative effects of pollution are socially shared, businesses could have ignored the carbon emission situation. However, under the pressure of stakeholders and government concern, businesses will focus on their own social ethical situation and assume a degree of social responsibility by reducing carbon emissions (Luo and Tang, 2021).
The role of managers in the production and operation of businesses is not “homogeneous,” but rather varies based on the internal and external environments in which they operate. So that various managers make varied decisions (Kathuria and Porth, 2003). Due to the bias of managers’ personal interests and external capital market pressures, firms may become myopic from the perspective of technological innovation (Mishra et al., 2022). In other words, technological innovation with a lengthy payback period is not favored by firms that are overly risk-averse. However, competent managers also have a tendency to be forward-looking and immune to short-term vested interests (del Mar Alonso-Almeida et al., 2017). In order to achieve a balance between the company’s current performance and its sustainable development. They recognize the impact of advanced technology on the enterprise’s overall growth over time. Therefore, in the context of “dual carbon,” capable managers will choose to support carbon reduction while ensuring the enterprise’s smooth operation in the current period. In terms of corporate capital flow, managers with strong capabilities are frequently able to integrate the available or potential resources in an efficient manner (Yakob, 2020). These businesses are frequently better able to respond to threats, seize opportunities, and maintain sufficient cash flow to ensure their survival and growth. Indicating that the company has prospects, managers who respond effectively to threats and opportunities can also give the capital market a “cardiac stimulant.” Thus relieving the company of its financial constraints (Freel et al., 2014.; Park and Ryu, 2022). From an active social responsibility perspective. Under China’s “carbon peaking” and “carbon neutrality” objectives, improving the carbon performance of enterprises is a requirement of the Chinese government, a requirement of the enterprises’ stakeholders, and the enterprises’ own responsibility. If businesses take responsibility for reducing carbon emissions, they can obtain political resources like tax incentives (Lin, 2021). And build a positive corporate image so that they can obtain more benefits in the future from their stakeholders (Godos-Díez et al., 2011). In contrast, corporate managers with only operational rights may also prioritize social responsibility in their business decisions for the purpose of enhancing their personal image and social standing (Galaskiewicz, 1997). That is, utilizing their talents to assist businesses in enhancing their carbon performance and societal standing.
Figure 1 is a mechanistic transmission diagram of the impact of managerial competencies on corporate carbon performance.
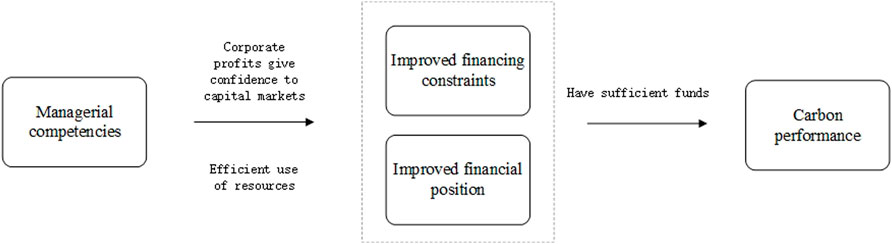
FIGURE 1. Mechanism conduction diagram.
After the separation of the two powers, the owners of the company hire individuals with specific competencies to serve as managers, and these managers assume operational control. Upper Echelons Theory posits that managers’ knowledge of the market is necessarily limited due to the environment’s complexity, and the decisions they make at this time will vary depending on the manager (Hambrick and Mason, 1984). This study categorizes outputs into desired and undesirable outputs when measuring carbon performance, allowing the effect of managerial competence on a company’s carbon performance to be studied separately for these two aspects. Greater managerial competence contributes positively to a company’s operating income (Herrmann et al., 2003). Managers with strong competencies can integrate the necessary resources for the company’s growth in a more timely manner. They are able to capitalize on potential opportunities and avoid potential threats within the organization. Regarding the reduction of carbon emissions, managers are also conscious of the problems caused by their own production and emissions (Esmaeilifar et al., 2020). Capable managers are aware of the damage to the company’s reputation and other aspects of the temporary carbon emission issue. They will be able to balance the investment in carbon emission reduction with the company’s normal production growth. Therefore, we propose the first hypothesis.
H1:. Other things being equal, good managerial competence can help firms improve their carbon performance.
With the widespread danger of global warming and the political orientation of “carbon peaking” and “carbon neutrality,” the concept of carbon reduction is deeply ingrained in people’s minds, and according to the expectation theory, businesses have sufficient motivation to take social responsibility (Tsai et al., 2016). Even if they have the desire to be socially responsible, they must consider their actual capabilities. In the short term, firms that invest in carbon reduction activities do not experience immediate revenue growth, putting pressure on their cash flow and posing a threat to their survival (Tsai, 2008). Effective management skills can signal the market and inspire investor confidence to alleviate external financing constraints (Peng et al., 2022). And business managers who run their companies more effectively will also benefit from a stronger financial position. Generally, organizations with greater cash flow achieve superior operating results. A sufficient cash flow can assist businesses in weathering unforeseeable crises. In the event of opportunities, adequate cash flow enables businesses to make the necessary production adjustments in a shorter period of time (So and Zhang, 2022). With sufficient cash flow, businesses can make decisions with lower short-term returns but long-term benefits for society and the business, and they can increase their cash investments in projects that contribute to “carbon reduction” with confidence (Safiullah et al., 2021). The following hypothesis is therefore proposed.
H2a:. All else being equal, good managerial capacity can enhance the carbon performance of firms by alleviating the degree of external financing constraints.
H2b:. bOther things being equal, good managerial competencies can enhance firms to improve their carbon performance by improving their internal financial position.
Being involved in social responsibility and assisting other businesses in enhancing their carbon performance has a significant impact on the company’s reputation. However, it may not be particularly beneficial for the managers themselves. Especially when the manager has no strong ties to the company, the owner’s ability to rehire the manager frequently depends on the profitability of the company. Currently, the manager will prioritize the company’s earnings. Regarding the company’s reputation, managers may not be concerned. Optimal Salary Contract Theory posits that an increase in managerial compensation can enhance the manager’s sense of belonging to the organization, and that higher compensation can increase the manager’s commitment to assisting the organization in making decisions (Stevens and Thevaranjan, 2010). However, the company’s resources are limited, so their allocation should be based on the contributions of each manager. When individuals make decisions, the contractual reference effect considers the impact of the difference between actual profit and loss and expected value (Kahneman, 1979). According to the Pareto principle, corporate decisions are frequently made by a small number of managers, and if they are distributed equally, regardless of each manager’s contribution, it will result in the inefficiency of key managers (Carnahan, 1979). We therefore proposed the third hypothesis.
H3:. All other things being equal, the higher the proportion of key managers’ compensation, the more significant the effect of managers’ competence on corporate carbon performance
We have included at the end of the text a brief explanation of the variables that appear in the article, with the range of values for the variables shown in the descriptive statistics in 4.1.
This study utilizes data from 2014 to 2019 for Chinese heavy polluters listed on Shanghai and Shenzhen A-shares. Because using the SBM-DDF model in conjunction with the GML index necessitates balancing the panel data, which will result in a substantial loss of samples, the sample interval for this study is 2014–2019. Matlab 2020 was used to calculate the carbon emission performance from 2015 to 2019, after which pertinent financial data from the China Economic and Financial Research Database were selected (CSMAR). As for heavy polluters, China’s State Environmental Protection Administration proposed 13 categories of heavy polluting industries in 2003. While there have been some changes to China’s industry classification standards since then, the following industry codes will be considered heavy polluters: B6, B7, B8, B9, B10, B11, C15, C17, C18, C19, C22, C25, C26, C27, C28, C29, C30, C31, C32, and D44.
China Stock Market & Accounting Research Database (CSMAR), China Statistical Yearbook, and China Environmental Statistical Yearbook provided the data for this study. In addition, some indicators were manually compiled and calculated using EXCEL 2021, Matlab 2020, and Stata17, and data analysis was conducted using Stata17. The information was analyzed using Stata17. In addition, we performed a 10% winsorization to mitigate the impact of extreme values.
Please see Table 1 for the main variables used in this paper.
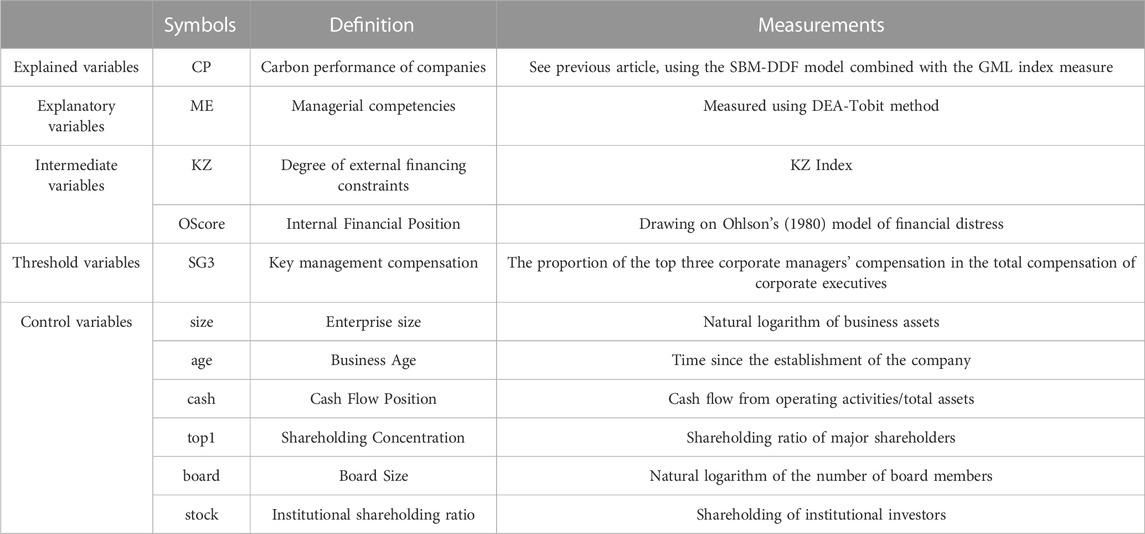
TABLE 1. Variable definitions.
Utilizing labor, stock capital, and energy consumption as input variables and regional GDP and pollution levels as output variables, scholars measure carbon emission performance at the province or city level (Liu et al., 2021). Fewer scholars assess firm-level carbon emission performance. This study utilizes Wang et al. (2021) to measure carbon emission efficiency. 1) The number of employees at the end of the year is utilized as the labor input variable. 2) The firm’s fixed asset stock is taken as the capital input variable, and the calculation formula is
There are some discrepancies between the financial statement requirements in China and international standards, which may cause some difficulties in the calculation of managerial competency indicators. We improved the managerial competency measure proposed by Demerjian et al. (2012) in the context of Chinese reality. Firstly, sales revenue (
The Tobit model is also used to regress measured firm productivity on firm size, market share, free cash flow, years on the market, and business complexity to obtain residuals as an indicator of firm managerial competency, with larger residuals indicating greater managerial competency. In order to reduce the impact of firm-level factors such as firm size on the measurement of managerial capability, we also control for industry and year fixed effects. Individual and annual clustering effects are also used to control for cross-sectional and temporal correlations.
To mitigate potential endogeneity issues associated with omitted variables, this study included firm size, firm age, and cash flow status as financial control variables. Additionally, we include equity concentration, board size, and institutional shareholding, which are control variables for corporate governance characteristics.
For hypothesis 1, this study constructs the following model. If
For hypothesis 2, this study uses a stepwise test to examine the mediating role of the degree of external financing constraints and the firm’s own financial position.
The descriptive statistics for this study are shown in Table 2. Carbon performance (CP) has a mean value of 1.143 and a median value of 1.080, which is less than the mean. Indicating that a small number of companies with high carbon performance account for the majority of the data. CP has a minimum value of 0.409 and a maximum value of 3.932, despite a standard deviation of 0.433. The mean and average values of ME are both less than 0, indicating that these companies need to improve their managerial capacity. Consistent with Campbell et al.'s research, there is a great deal of variation in the financing constraints faced by various businesses (2021). The descriptive statistics of the financial situation illustrate the substantial disparities between the financial situations of various businesses.
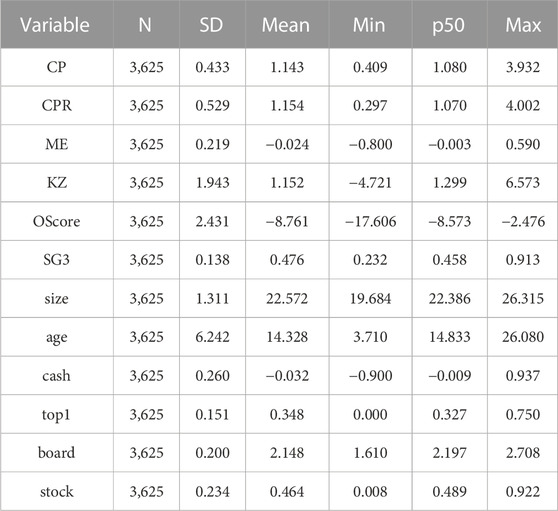
TABLE 2. Descriptive statistics.
In this study, correlation tests were conducted on the relevant variables, and the results are shown in Table 3. A significant positive correlation exists between managerial competence (ME) and corporate carbon performance (CP), and hypothesis H1 was initially tested. Table 2 demonstrates that managerial competence (ME) is significantly and negatively related to firms’ external financing constraints (KZ) and internal financial position (OScore), and that the latter is significantly and negatively related to firms’ carbon performance (CP). Hypothesis H2a and hypothesis H2b are initially tested.
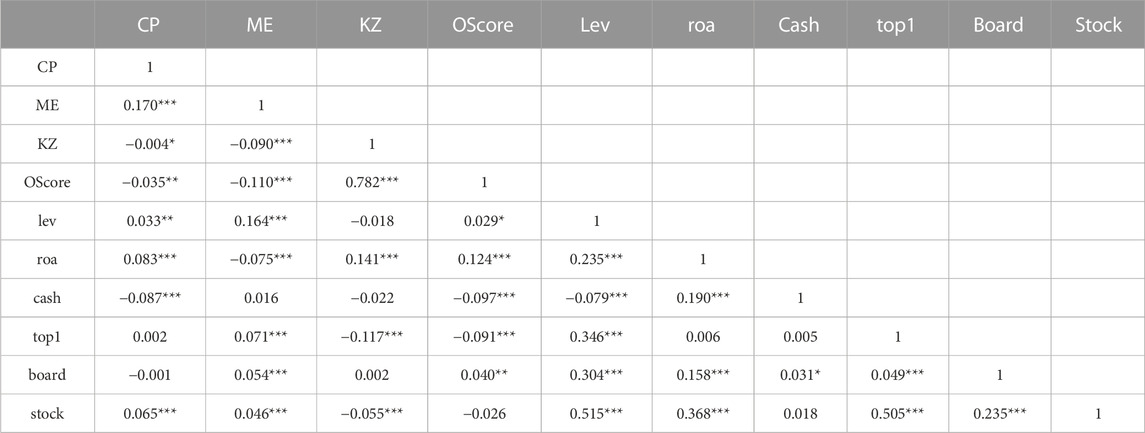
TABLE 3. Correlation analysis.
The results of the variance inflation factor test are displayed in Table 4 of this study. Each of the swelling factors is below 10. At first, it is determined that there is no covariance issue. The Hausman test was followed by the use of individual and time fixed effects, which can mitigate the endogeneity issue caused by the difference between groups.
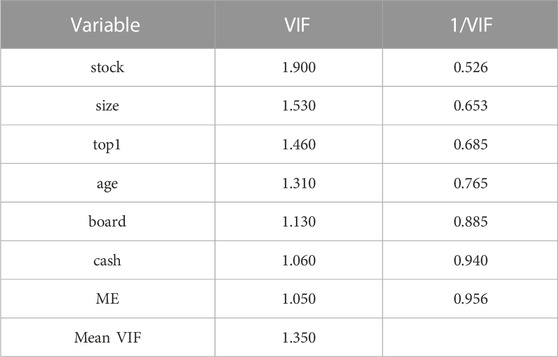
TABLE 4. Variance inflation factor.
Table 5 presents the baseline regression test for hypothesis H1 in this study. The coefficient of the effect of managerial competence (ME) on firm’s carbon performance (CP) is 0.583, which is significant at the 1% level, according to the results of the test conducted without the inclusion of control variables, as shown in column 1). The results of the test including firm size, firm age, and firm cash flow position, which are financial control variables, are displayed in column 2. The results of adding equity concentration, board size, and institutional shareholding, which are control variables relating to firm management characteristics, are displayed in column 3. The test results of adding the previously mentioned control variables are displayed in column 4). The addition of control variables can mitigate the endogeneity issue caused by variables that were omitted. According to Table 5, the model’s explanatory power (adj. R-sq) is enhanced by the addition of control variables, and the coefficient of the effect of managerial competence (ME) on carbon performance (CP) ranges between 0.580 and 0.595, all of which are statistically significant at the 1% level. It indicates that competent management can assist businesses in enhancing their carbon performance, thus confirming hypothesis H1.
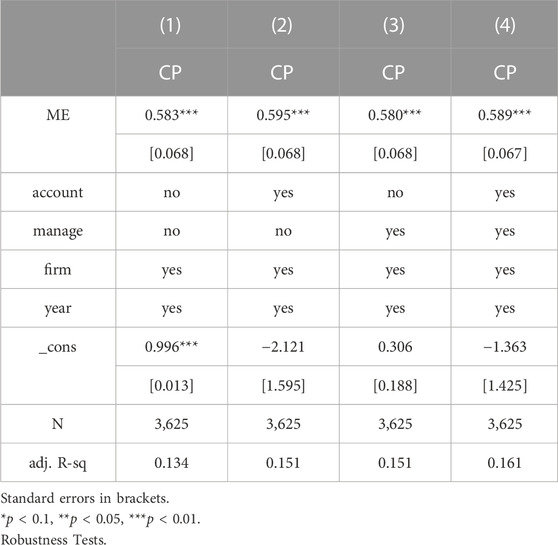
TABLE 5. Benchmark regression.
This study employs two-order least squares (2sls) in conjunction with a GMM dynamic panel model to test the endogeneity of the benchmark regression results in order to mitigate the endogeneity issue. As the instrumental variable, the regional mean of managerial competency (ME) of other companies was chosen (Li, 2016). The outcomes are shown in column (1) of Table 6. Existence of a significant positive relationship between the independent and dependent variables can be observed. The Under identification test has a p-value of 0. There is no weak instrumental variable, as the Kleibergen-Paap rk Wald F is 23.375 and the Stock-Yogo 10% is 16.38. Regarding adj. R-sq, it is less than 0 because, in conjunction with the GMM dynamic panel model employing two-order least squares (2sls), it does not require much consideration (Sribney et al., 2005). Passing the test for endogeneity.
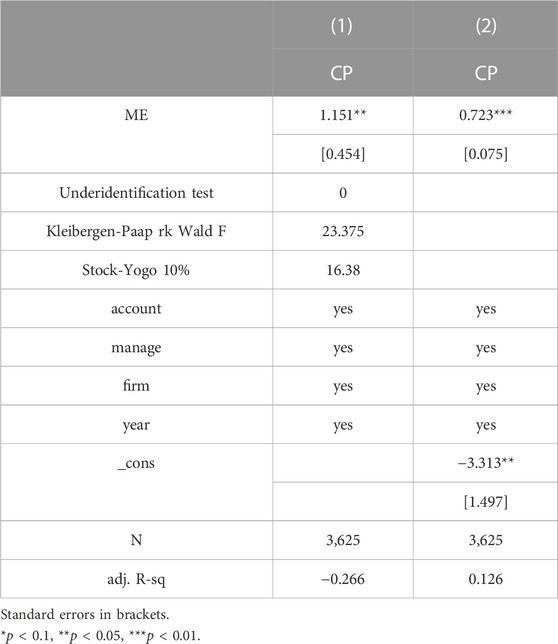
TABLE 6. Robustness tests.
We defaulted to variable scaled payoffs when calculating carbon performance (CP). This study replaced the explanatory variables in the robustness test calculation while maintaining the scale payoffs. The test results for robustness are displayed in column 2 of Table 6. At the 1% significance level, managerial ability (ME) remains significantly and positively associated with firm carbon performance (CP) after controlling for the explanatory variable.
Table 7 displays the test for the mediating effect. In this study, the measure of external financing constraints (KZ) is a positive indicator, meaning that the greater the value of KZ, the more severe the firm’s financing constraints. Table 7 columns (2) and (3) illustrate the effect of external financing constraint on mediation (KZ). Stronger managerial capability can significantly mitigate the external financing constraint (KZ), while external financing constraint (KZ) partially mediates the relationship between managerial capability and corporate carbon performance (column 3) (CP). In this study, the selected measure of the firm’s internal financial position (OScore) is a negative indicator, i.e., a higher OScore value indicates that the firm’s financial position has deteriorated. Table 7’s columns (4) and (5) illustrate the mediating impact of internal financial position (OScore). A stronger managerial capability can significantly improve the internal financial position (OScore), as shown in column 4, while the internal financial position (OScore) partially mediates the relationship between managerial capability and corporate carbon performance, as shown in column 5 (CP). Considering that equity markets around the world have become cautious in the wake of the financial crisis (Li T. et al., 2022), firms’ access to capital has been significantly constrained as a result. Good managerial capabilities can enhance the carbon performance of firms by alleviating financing constraints and improving their financial position. The H2a and H2b hypotheses are supported.
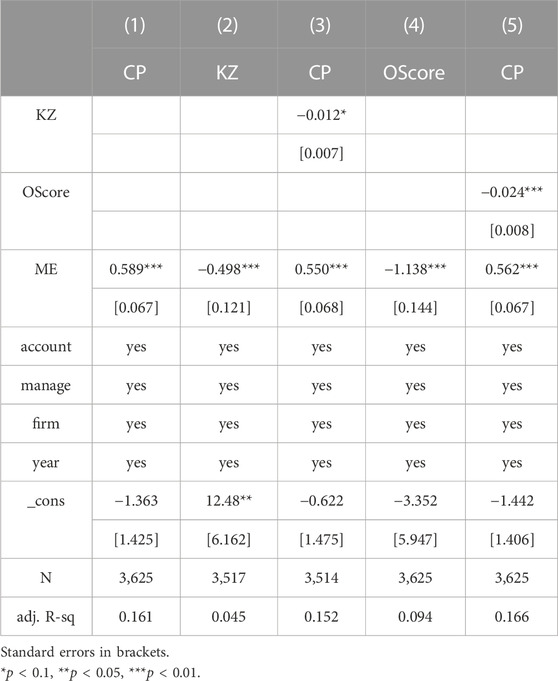
TABLE 7. Intermediary effects.
This study utilized a threshold regression with the independent variable managerial competency (ME) as the threshold variable to investigate the extent to which an increase in managerial competency (ME) produces a qualitative change that results in a change in the impact of managerial competency (ME) on corporate carbon performance (CP). The tests assuming managerial competence (ME) as the threshold variable are shown in Rows one through three of Table 8. When managerial competency (ME) is the threshold variable, the p-value of the double threshold effect is significant at the 1% level, whereas it is not significant when a triple threshold effect is assumed. Thus, we concluded that there is a double threshold effect when the threshold variable is managerial competency (ME). As for the threshold test with internal equity in compensation (SG3) as the threshold variable, Table 8 rows four and five display the results of its threshold test, which indicates that there is currently a single threshold effect.
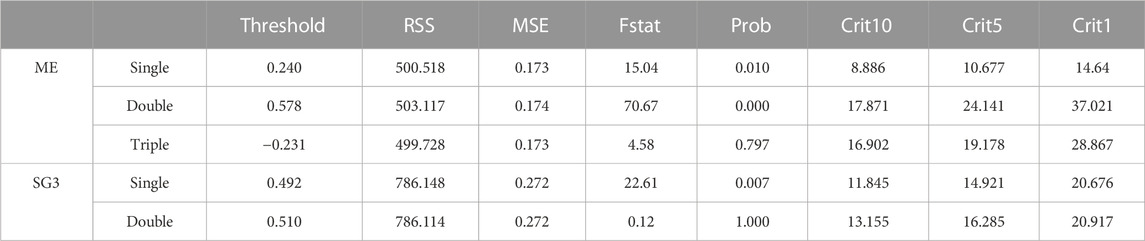
TABLE 8. Threshold value test.
The threshold regression test with managerial competence (ME) as the threshold variable is displayed in column (1) of Table 9. When it reaches 0.240 and 0.578, the effect of managerial competence (ME) on the firm’s carbon performance (CP) increases significantly (the coefficient increases from 0.271 to 0.724 and then to 1.584 after reaching the second threshold). The threshold regression test with internal pay equity (SG3) as the threshold variable is displayed in column (2) of Table 9. It can be seen that once the level of internal pay equity (SG3) reaches the threshold value, the manager’s bond with the firm strengthens and the manager’s motivation to improve the firm’s carbon performance (CP) increases. The H3 hypothesis is confirmed.
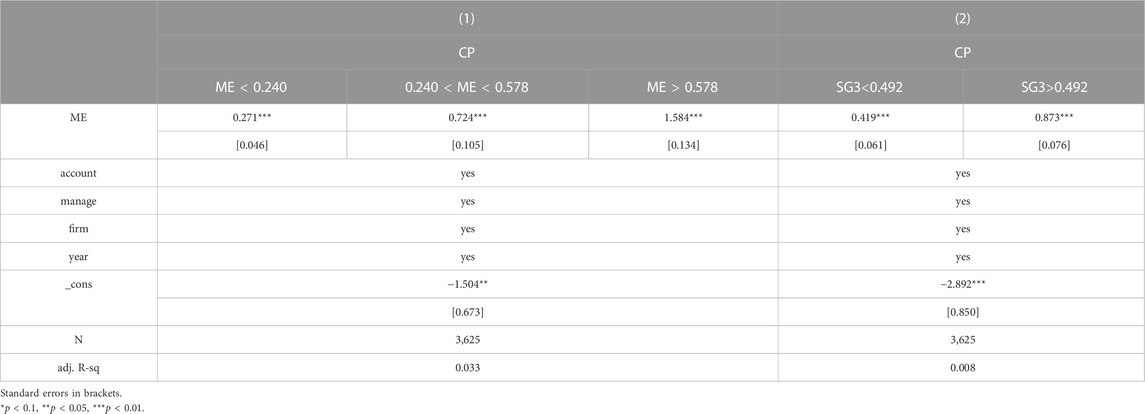
TABLE 9. Threshold effects.
The manager of a firm under separation of powers controls the production and business decisions of the firm, when managerial characteristics influence the behaviour of the firm (Benmelech and Frydman, 2015). Aggressive managers may favour projects with high risks and benefits when making decisions, while conservative managers will be more shy of riskier projects. Therefore, managers with strong competencies tend to be able to improve the carbon performance of their companies while ensuring smooth operations with an eye on the long-term development of the company. This hypothesis has been confirmed by empirical analysis. We empirically analyse the pathways through which managerial capability affects the carbon performance of firms. Previous scholars have tended to study the carbon performance of firms from the perspective of Science and Technology Innovation (Sun et al., 2021). We consider the impact of financial status on firms’ decisions and conduct hypotheses and empirical analysis from this perspective. This can expand the path of research on corporate carbon performance and offer educational opportunities of long-lasting learning to relevant scholars.
Governments are enacting regulations to combat carbon dioxide emissions, which contribute to global warming and pose a threat to human survival and development. This study examined firms as microeconomic agents to determine their contribution to global warming. Using a sample of Chinese heavy polluters from Shanghai and Shenzhen A-shares, this study investigated the impact of managerial competence on carbon performance and drew the following conclusions.
(1) Greater managerial competence has a significant impact on the carbon emission performance of businesses. Managers with greater competence can ensure the enterprise’s normal production and operation and increase the desired output - operating income. And managers with strong capability have a propensity to be forward-thinking; they can see the harm that carbon emissions cause to the economy, society, and the enterprise itself. They are capable of effectively reducing the undesirable output of the business—carbon emissions.
(2) External financing restrictions and internal financial conditions serve as a moderating factor. While it is common knowledge that a company’s reputation can be enhanced by being socially responsible and reducing carbon emissions, a company cannot improve its technology and management structure without sufficient cash flow. In this study, we discovered that competent management can reduce external financing constraints and improve internal financial conditions, thereby improving the carbon performance of businesses.
(3) A threshold effect exists between managerial competency and internal pay equity. This study found that when managerial competency surpasses the threshold twice, it will have a qualitative effect on the carbon performance of the firm. When the proportion of key managers’ compensation exceeds the threshold, the bond between the key managers and the company strengthens, and managers with greater competence will pay more attention to the company’s reputation and work more diligently to improve the company’s carbon emission performance.
What sort of policies can the government implement to assist businesses in enhancing their carbon performance? To expect businesses to forego their economic benefits and assume their social responsibility to reduce carbon emissions is unrealistic. To reduce carbon emissions, businesses are motivated by their social standing and their aversion to risk. Under the policy guidance, stakeholders will become increasingly supportive of carbon emission reduction, and businesses may cater to the needs of their stakeholders to meet their expectations.
Investors should be aware of the contribution of competent management to the carbon performance of a company. Competent managers are able to ensure the company achieves adequate business results while reducing its carbon footprint. In this way, the company’s reputation on the capital market is safeguarded, its market value has the potential to rise steadily, and investors’ interests are safeguarded.
Companies should recognize the importance of key managers to their operational growth. If conditions permit, the company should increase the remuneration of key managers in order to increase the degree of bonding between key managers and the company and to meet their psychological expectations, so that managers are more committed to balancing business operations and carbon reduction.
Due to the fact that the relevant data in the China Statistical Yearbook are not disclosed after 2020 and the calculation of carbon emission performance requires balanced panel data, this study selected enterprises that have been continuously operating from 2014 to 2019. These businesses have been continuously operating for at least 6 years and may have unique characteristics in some aspects of business management. From this perspective, scholars of future studies can improve this study.
The datasets presented in this study can be found in online repositories. The names of the repository/repositories and accession number(s) can be found in the article/supplementary material.
ZZ: Conceptualize the idea of this study. Responsible for data collection, model design and paper writing. PW: Collect literature and be responsible for part of the literature review. Cover the costs associated with this study.
Thanks to PW for his dedication in co-writing this paper. Thanks to Liu for his guidance in Matlab.
The authors declare that the research was conducted in the absence of any commercial or financial relationships that could be construed as a potential conflict of interest.
All claims expressed in this article are solely those of the authors and do not necessarily represent those of their affiliated organizations, or those of the publisher, the editors and the reviewers. Any product that may be evaluated in this article, or claim that may be made by its manufacturer, is not guaranteed or endorsed by the publisher.
Acemoglu, D., Aghion, P., Bursztyn, L., and Hemous, D. (2012). The environment and directed technical change. Am. Econ. Rev. 102 (1), 131–166. doi:10.1257/aer.102.1.131
Afsharian, M., and Ahn, H. (2015). The overall malmquist index: A new approach for measuring productivity changes over time. Ann. Operations Res. 226 (1), 1–27. doi:10.1007/s10479-014-1668-5
Bai, C., Du, K., Yu, Y., and Feng, C. (2019). Understanding the trend of total factor carbon productivity in the world: Insights from convergence analysis. Energy Econ. 81, 698–708. doi:10.1016/j.eneco.2019.05.004
Benmelech, E., and Frydman, C. (2015). Military ceos. J. financial Econ. 117 (1), 43–59. doi:10.1016/j.jfineco.2014.04.009
Call, A. C., Chen, S., Miao, B., and Tong, Y. H. (2014). Short-term earnings guidance and accrual-based earnings management. Rev. Account. Stud. 19 (2), 955–987. doi:10.1007/s11142-013-9270-7
Campbell, J. L., Goldman, N. C., and Li, B. (2021). Do financing constraints lead to incremental tax planning? Evidence from the pension protection act of 2006. Contemp. Account. Res. 38 (3), 1961–1999. doi:10.1111/1911-3846.12679
Candian, G., and Dmitriev, M. (2020). Optimal contracts and supply-driven recessions. Econ. Lett. 197, 109618. doi:10.1016/j.econlet.2020.109618
Carnahan, S., Agarwal, R., and Campbell, B. A. (2012). Heterogeneity in turnover: The effect of relative compensation dispersion of firms on the mobility and entrepreneurship of extreme performers. Strategic Manag. J. 33 (12), 1411–1430. doi:10.1002/smj.1991
Chambers, R. G., Chung, Y., and Färe, R. (1996). Benefit and distance functions. J. Econ. theory 70 (2), 407–419. doi:10.1006/jeth.1996.0096
Chen, S., Li, Z., Han, B., and Ma, H. (2021). Managerial ability, internal control and investment efficiency. J. Behav. Exp. Finance 31, 100523. doi:10.1016/j.jbef.2021.100523
Chen, W., Li, S. S., Mehlawat, M. K., Jia, L., and Kumar, A. (2021). Portfolio selection using data envelopment analysis cross-efficiency evaluation with undesirable fuzzy inputs and outputs. Int. J. Fuzzy Syst. 23 (5), 1478–1509. doi:10.1007/s40815-020-01045-y
Chen, Y., Xu, Z., Wang, X., and Yang, Y. (2022). How does green credit policy improve corporate social responsibility in China? An analysis based on carbon-intensive listed firms. Corporate Social Responsibility and Environmental Management.
Chiarini, B., Ferrara, M., and Marzano, E. (2022). Tax evasion and financial accelerator: A corporate sector analysis for the us business cycle. Econ. Model. 108, 105780. doi:10.1016/j.econmod.2022.105780
del Mar Alonso-Almeida, M., Buil-Fabregà, M., Bagur-Femenías, L., and Aznar-Alarcón, J. P. (2017). Shedding light on sustainable development and stakeholder engagement: The role of individual dynamic capabilities. Sustain. Dev. 25 (6), 625–638. doi:10.1002/sd.1682
Demerjian, P., Lev, B., and Mcvay, S. (2012). Quantifying managerial ability: A new measure and validity tests. Soc. Sci. Electron. Publ. 58 (7), 1229–1248. doi:10.1287/mnsc.1110.1487
Desalegn, G., and Tangl, A. (2022). Forecasting green financial innovation and its implications for financial performance in Ethiopian Financial Institutions: Evidence from ARIMA and ARDL model. Natl. Account. Rev. 4 (2), 95–111. doi:10.3934/nar.2022006
Dong, F., Yu, B., Hadachin, T., Dai, Y., Wang, Y., Zhang, S., et al. (2018). Drivers of carbon emission intensity change in China. Resour. Conservation Recycl. 129, 187–201. doi:10.1016/j.resconrec.2017.10.035
Du, W., and Li, M. (2019). Can environmental regulation promote the governance of excess capacity in China's energy sector? The market exit of zombie enterprises. J. Clean. Prod. 207, 306–316. doi:10.1016/j.jclepro.2018.09.267
Esmaeilifar, R., Iranmanesh, M., Shafiei, M. W. M., and Hyun, S. S. (2020). Effects of low carbon waste practices on job satisfaction of site managers through job stress. Rev. Manag. Sci. 14 (1), 115–136. doi:10.1007/s11846-018-0288-x
Freel, M., Robson, P. J., and Jack, S. (2014). Risk capital constraints to innovation in services. J. Bus. Industrial Mark. 29, 476–486. doi:10.1108/jbim-08-2013-0175
Galaskiewicz, J. (1997). An urban grants economy revisited: Corporate charitable contributions in the Twin Cities, 1979-81, 1987-89. Adm. Sci. Q. 42, 445–471. doi:10.2307/2393734
Ginglinger, E., and Moreau, Q. (2019). Climate risk and capital structure. Université Paris-Dauphine Research Paper, 3327185.
Godos-Díez, J. L., Fernández-Gago, R., and Martínez-Campillo, A. (2011). How important are CEOs to CSR practices? An analysis of the mediating effect of the perceived role of ethics and social responsibility. J. Bus. Ethics 98 (4), 531–548. doi:10.1007/s10551-010-0609-8
Gu, Y., and Su, D. (2018). Innovation orientations, external partnerships, and start-ups' performance of low-carbon ventures. J. Clean. Prod. 194, 69–77. doi:10.1016/j.jclepro.2018.05.017
Hambrick, D. C., and Mason, P. A. (1984). Upper echelons: The organization as a reflection of its top managers. Acad. Manag. Rev. 9 (2), 193–206. doi:10.5465/amr.1984.4277628
Herrmann, D., Inoue, T., and Thomas, W. B. (2003). The sale of assets to manage earnings in Japan. J. Account. Res. 41 (1), 89–108. doi:10.1111/1475-679x.00097
Ioanna, N., Pipina, K., Despina, C., Ioannis, S., and Dionysis, A. (2022). Stakeholder mapping and analysis for climate change adaptation in Greece. Euro-Mediterranean J. Environ. Integration 7 (3), 339–346. doi:10.1007/s41207-022-00317-3
Kathuria, R., and Porth, S. J. (2003). Strategy-managerial characteristics alignment and performance: A manufacturing perspective. Int. J. Operations Prod. Manag. 23, 255–276. doi:10.1108/01443570310462758
Koester, A., Shevlin, T., and Wangerin, D. (2017). The role of managerial ability in corporate tax avoidance. Manag. Sci. 63 (10), 3285–3310. doi:10.1287/mnsc.2016.2510
Li, F. (2016). Endogeneity in ceo power: A survey and experiment. Invest. Analysts J. 45 (3), 149–162. doi:10.1080/10293523.2016.1151985
Li, J., Wei, R., Guo, Y., Eberly, M. B., and Shi, L. (2022). Embeddedness and perceived oneness: Examining the effects of job embeddedness and its trajectory on employee proactivity via an identification perspective. Front. Environ. Sci. 10, 1020–1030. doi:10.1037/apl0000961
Li, S., and Wang, S. (2019). Examining the effects of socioeconomic development on China's carbon productivity: A panel data analysis. Sci. Total Environ. 659, 681–690. doi:10.1016/j.scitotenv.2018.12.409
Li, T., Wen, J., Zeng, D., and Liu, K. (2022). Has enterprise digital transformation improved the efficiency of enterprise technological innovation? A case study on Chinese listed companies. Math. Biosci. Eng. 19 (12), 12632–12654. doi:10.3934/mbe.2022590
Lin, W. L. (2021). Giving too much and paying too little? The effect of corporate social responsibility on corporate lobbying efficacy: Evidence of tax aggressiveness. Corp. Soc. Responsib. Environ. Manag. 28 (2), 908–924. doi:10.1002/csr.2098
Liu, D., Zhu, X., and Wang, Y. (2021). China's agricultural green total factor productivity based on carbon emission: An analysis of evolution trend and influencing factors. J. Clean. Prod. 278, 123692. doi:10.1016/j.jclepro.2020.123692
Liu, Y., Failler, P., and Ding, Y. (2022c). Enterprise financialization and technological innovation: Mechanism and heterogeneity. PloS One 17 (12), e0275461. doi:10.1371/journal.pone.0275461
Liu, Y., Failler, P., and Liu, Z. (2022a). Impact of environmental regulations on energy efficiency: A case study of China’s air pollution prevention and control action plan. Sustainability 14 (6), 3168. doi:10.3390/su14063168
Liu, Y., Tang, L., and Liu, G. (2022b). Carbon dioxide emissions reduction through technological innovation: Empirical evidence from Chinese provinces. Int. J. Environ. Res. Public Health 19 (15), 9543. doi:10.3390/ijerph19159543
Liu, Y., Xu, L., Sun, H., Chen, B., and Wang, L. (2023). Optimization of carbon performance evaluation and its application to strategy decision for investment of green technology innovation. J. Environ. Manag. 325, 116593. doi:10.1016/j.jenvman.2022.116593
Luo, L., and Tang, Q. (2021). Corporate governance and carbon performance: Role of carbon strategy and awareness of climate risk. Account. Finance 61 (2), 2891–2934. doi:10.1111/acfi.12687
Mishra, C. S. (2022). Does institutional ownership discourage investment in corporate R&D? Technol. Forecast. Soc. Change 182, 121837. doi:10.1016/j.techfore.2022.121837
Nicolas, T. (2022). Short-term financial constraints and SMEs’ investment decision: Evidence from the working capital channel. Small Bus. Econ. 58 (4), 1885–1914. doi:10.1007/s11187-021-00488-3
Park, D., and Ryu, D. (2022). E-commerce retail and reverse factoring: A newsvendor approach. Manag. Decis. Econ. 44, 416–423. doi:10.1002/mde.3690
Pastor, J. T., and Lovell, C. K. (2005). A global Malmquist productivity index. Econ. Lett. 88 (2), 266–271. doi:10.1016/j.econlet.2005.02.013
Peng, S., Shu, Z., and Zhang, W. (2022). Does service trade liberalization relieve manufacturing enterprises’ financial constraints? Evidence from China. Econ. Model. 106, 105710. doi:10.1016/j.econmod.2021.105710
Safiullah, M., Kabir, M. N., and Miah, M. D. (2021). Carbon emissions and credit ratings. Energy Econ. 100, 105330. doi:10.1016/j.eneco.2021.105330
Sebos, I., Progiou, A. G., and Kallinikos, L. (2020). “Methodological framework for the quantification of GHG emission reductions from climate change mitigation actions,” in Strategic planning for energy and the environment, 219–242.
So, J. Y. C., and Zhang, J. F. (2022). The effect of cultural heterogeneity on cash holdings of multinational businesses. Res. Int. Bus. Finance 61, 101660. doi:10.1016/j.ribaf.2022.101660
Sribney, W., Wiggins, V., and Drucker, D. (2005). Negative and missing R-squared for 2SLS/IV. Stata J. Stata Corp.
Stankuniene, G., Streimikiene, D., and Kyriakopoulos, G. L. (2020). Systematic literature review on behavioral barriers of climate change mitigation in households. Sustainability 12 (18), 7369. doi:10.3390/su12187369
Stevens, D. E., and Thevaranjan, A. (2010). A moral solution to the moral hazard problem. Account. Organ. Soc. 35 (1), 125–139. doi:10.1016/j.aos.2009.01.008
Streimikiene, D., Kyriakopoulos, G. L., and Stankuniene, G. (2022). Review of energy and climate plans of baltic states: The contribution of renewables for energy production in households. Energies 15 (20), 7728.
Sun, Y., Yu, Z., Li, L., Chen, Y., Kataev, M. Y., Yu, H., et al. (2021). Technological innovation research: A structural equation modelling approach. J. Glob. Inf. Manag. (JGIM) 29 (6), 1–22. doi:10.4018/jgim.20211101.oa32
Tone, K., and Sahoo, B. K. (2004). Degree of scale economies and congestion: A unified DEA approach. Eur. J. operational Res. 158 (3), 755–772. doi:10.1016/s0377-2217(03)00370-9
Tsai, C. Y. (2008). On supply chain cash flow risks. Decis. Support Syst. 44 (4), 1031–1042. doi:10.1016/j.dss.2007.12.006
Tsai, Y. H., Lin, C. P., Hsu, Y. C., Liu, C. M., and Yen, P. H. (2016). Predicting job offer acceptance of professionals in Taiwan: The case of the technology industry. Technol. Forecast. Soc. Change 108, 95–101. doi:10.1016/j.techfore.2016.05.005
Wang, M., Li, L., and Lan, H. (2021). The measurement and analysis of technological innovation diffusion in China's manufacturing industry. Natl. Account. Rev. 3 (4), 452–471. doi:10.3934/nar.2021024
Xiao-yu, Q. U., and Zi-xuan, Z. H. A. O. (2022). Research on characteristic factors and multiple promotion paths of China's industrial green total factor productivity based on fsQCA. Operations Res. Manag. Sci. 31 (6), 154.
Xu, L., Fan, M., Yang, L., and Shao, S. (2021). Heterogeneous green innovations and carbon emission performance: Evidence at China's city level. Energy Econ. 99, 105269. doi:10.1016/j.eneco.2021.105269
Yakob, R. (2020). Context, competencies, and local managerial capacity development: A longitudinal study of hrm implementation at volvo car China. Asian Bus. Manag. 19 (5), 582–609. doi:10.1057/s41291-019-00080-4
Yang, Y. C., and Nie, P. Y. (2022). Subsidy for clean innovation considered technological spillover. Technol. Forecast. Soc. Change 184, 121941. doi:10.1016/j.techfore.2022.121941
Young, A. (1995). The tyranny of numbers: Confronting the statistical realities of the east asian growth experience. Q. J. Econ. 110 (3), 641–680. doi:10.2307/2946695
Zhang, N., and Choi, Y. (2013). Total-factor carbon emission performance of fossil fuel power plants in China: A metafrontier non-radial malmquist index analysis. Energy Econ. 40, 549–559. doi:10.1016/j.eneco.2013.08.012
Zhao, Z., Yuan, T., Shi, X., and Zhao, L. (2020). Heterogeneity in the relationship between carbon emission performance and urbanization: Evidence from China. Mitig. Adapt. Strategies Glob. Change 25 (7), 1363–1380. doi:10.1007/s11027-020-09924-3
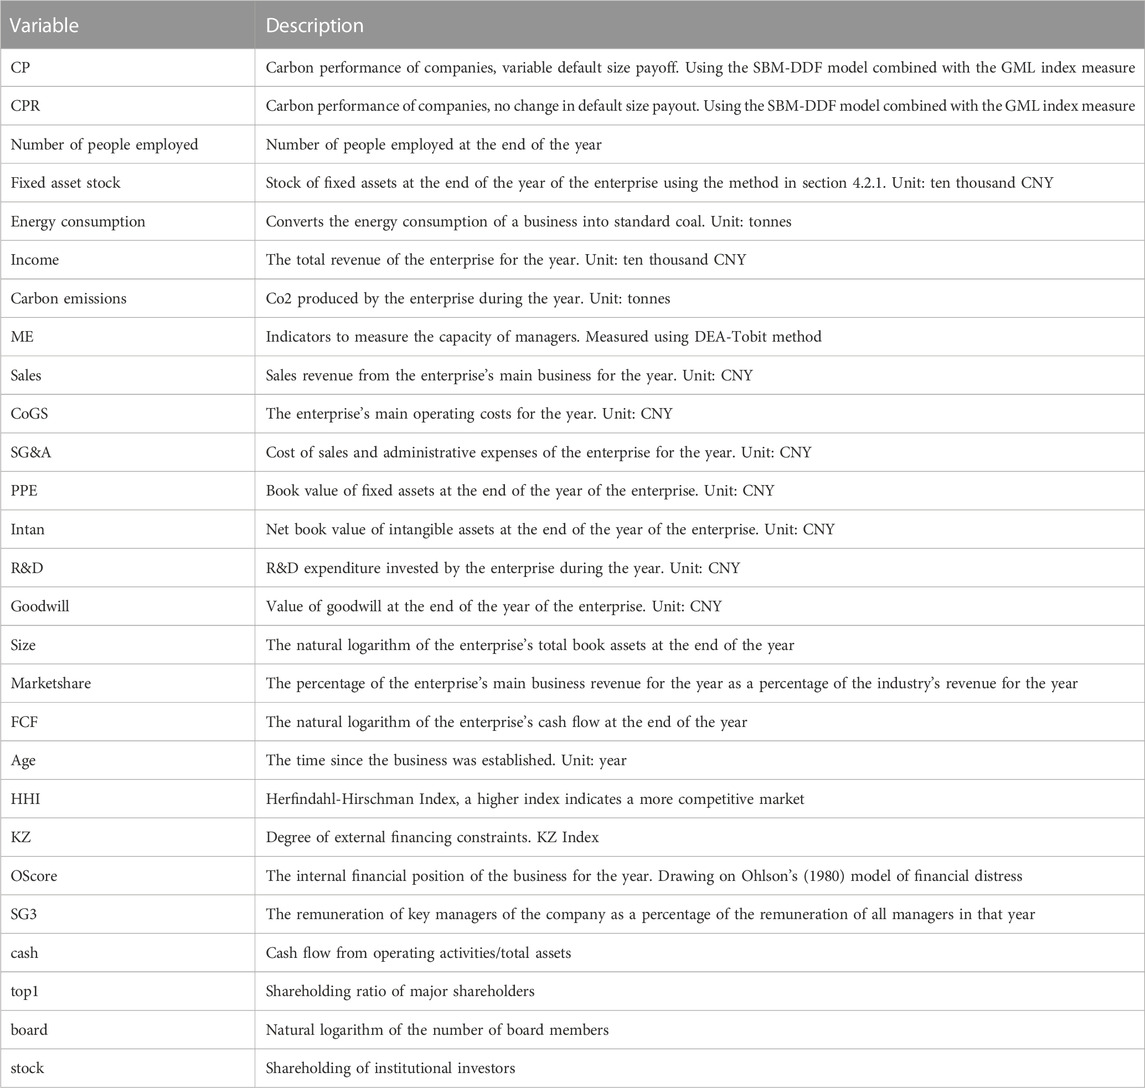
TABLE A1. Variable definitions.
Keywords: carbon performance, managerial competence, financing Constraints, financial position, pay equity
Citation: Zhao Z and Wang P (2023) The impact of managerial competence on corporate carbon performance: An empirical study based on Chinese heavy polluters. Front. Energy Res. 11:1130339. doi: 10.3389/fenrg.2023.1130339
Received: 23 December 2022; Accepted: 23 February 2023;
Published: 10 March 2023.
Edited by:
Michal Jasinski, Wrocław University of Science and Technology, PolandReviewed by:
Grigorios L. Kyriakopoulos, National Technical University of Athens, GreeceCopyright © 2023 Zhao and Wang. This is an open-access article distributed under the terms of the Creative Commons Attribution License (CC BY). The use, distribution or reproduction in other forums is permitted, provided the original author(s) and the copyright owner(s) are credited and that the original publication in this journal is cited, in accordance with accepted academic practice. No use, distribution or reproduction is permitted which does not comply with these terms.
*Correspondence: Zexia Zhao, emV4aWE2MzBAMTYzLmNvbQ==; Peiqiong Wang, ZTQwOTI2NzEwaGV6aHVAMTYzLmNvbQ==
†These authors have contributed equally to this work and share first authorship
Disclaimer: All claims expressed in this article are solely those of the authors and do not necessarily represent those of their affiliated organizations, or those of the publisher, the editors and the reviewers. Any product that may be evaluated in this article or claim that may be made by its manufacturer is not guaranteed or endorsed by the publisher.
Research integrity at Frontiers
Learn more about the work of our research integrity team to safeguard the quality of each article we publish.