 Mengmeng Liu
 Zhen Zhang
 Xingtuan Yang
- Institute of Nuclear and New Energy Technology, Collaborative Innovation Center of Advanced Nuclear Energy Technology, Key Laboratory of Advanced Nuclear Reactor Engineering and Safety of Ministry of Education, Tsinghua University, Beijing, China
Subcritical steam generators in the current high-temperature gas-cooled reactor pebble-bed module in China can be replaced by supercritical steam generators to better coordinate the reactors and supercritical steam turbine unit to improve the thermal efficiency with no fluid phase change at supercritical pressures. The heat transfer of supercritical-pressure water flow in helical tubes with various helix diameters was simulated using the re-normalization group k–ε model to investigate the effects of finite-thickness walls, inlet mass flux, and helix diameter. The finite-thickness wall barely affected local heat transfer in the straight tube with inlet mass flux of 1,260 kg/(m2 s) whereas the local heat transfer in the helical tube was very different with relative difference in q/qav between the inside and bottom, caused by the centrifugal force, is 36%. In helical tubes, the heat transfer coefficients in the inner bar were the lowest, with a low fluid velocity under the effect of the centrifugal force. The buoyancy and centrifugal force in the helical tubes caused non-uniformity in the wall temperature; however, when the fluid temperature increased below the pseudo-critical temperature, the temperature distributions showed an increasing trend. The non-uniformities in the wall temperature distributions decreased as the centrifugal force increased, and they were suppressed by the finite-thickness wall.
1 Introduction
The high-temperature gas-cooled reactor pebble-bed module (HTR-PM) being built at Tsinghua University’s Institute of Nuclear and New Energy Technology in China is a typical Generation IV nuclear power system. The subcritical steam generators in the HTR-PM can be replaced by supercritical steam generators to work with the current reactors and a supercritical steam turbine to improve the thermal efficiency, as envisaged for the third technical phase of the HTR-PM program in China (Zhang et al., 2019a). By raising the pressure of the helical coil steam generator at the outlet to supercritical levels, the thermal efficiency of the HTR-PM can be significantly improved. Small variations in fluid temperature and pressure, especially when water is at supercritical pressures in a steam generator, can cause drastic changes in the thermophysical properties, of which heat transfer characteristics (HTCs) are critical.
Figure 1 shows the variations in the thermophysical properties of supercritical pressure water (SCW) at 24.5 MPa, where the specific heat, Cp, reaches a sharp peak at a specific temperature (656.2 K), defined as the pseudo-critical temperature. The pseudo-critical enthalpy was 2,145 kJ/kg at the pseudo-critical temperature. At 24.5 MPa, the specific heat performance, Cp, and volume expansivity, αp, were non-monotonic with change in temperature, varying dramatically near the pseudo-critical temperature and reaching the maximum at that point. The dynamic viscosity, μ, and density, ρ, gradually decreased with increasing temperature, and rapidly decreased near the pseudo-critical temperature, after which the rate of decrease tended to be gentle. The variation in the thermal conductivity, λ, was similar to those of μ and ρ, except for a slight fluctuation near the pseudo-critical temperature.
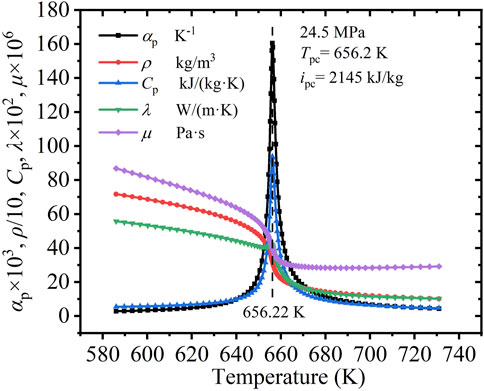
FIGURE 1. Variations in thermophysical properties of water (p = 24.5 MPa, Tpc = 656.2 K).
A drastic change in the properties can significantly affect the HTCs, complicating the related processes. Many researchers have conducted experiments and numerical simulations to investigate the HTCs of supercritical fluids in tubes.
Experimental studies can provide reliable data on supercritical fluid heat transfer. Yamagata et al. (1972) investigated the HTCs of SCW in horizontal and vertical tubes at pressures ranging from 22.6 to 29.4 MPa, with a heat fluxes ranging from 116 to 930 kW/m2 and inlet mass fluxes ranging from 310 to 1,830 kg/(m2·s). The extensive experimental data reported by them provide the foundation for further research. Fewster and Jackson. (2004) conducted experiments in a vertical tube with an inner diameter of 5 mm and found that when the heat flux was high, there was local heat transfer deterioration at each position in the experimental section. They identified three heat transfer states of supercritical fluid: normal, heat transfer deterioration, and enhancement. The current experimental data were summarized to obtain an empirical correlation under specific working conditions. Mokry et al. (2010) measured the temperature field of SCW under 24 MPa, with a mass flux range of 200–1,500 kg/(m2·s), heat flux range of 160–900 kW/m2 and inlet temperature range of 593.15–613.15 K. Their experiments also revealed the three heat-transfer states reported by Fewster and Jackson. (2004); Zhang et al. (2015a) conducted experiments to study the HTCs of supercritical CO2 in vertical helical tubes and analyzed the enhancement and inhibition mechanisms of the non-dimensional buoyancy number, Bo*. Sheeba et al. (2019) experimentally investigated the HTCs of SCW in a helical tube.
Numerical simulations provide more detailed temperature field than experiments. Some researchers (Zhang et al., 2015b; Wang et al., 2015; Huang et al., 2018; Yang et al., 2021) studied the HTCs of supercritical-pressure fluid in helical tubes through simulations, in which the wall thickness of the tube was ignored and a uniform heat flux was loaded on the wall. Zhang et al. (2015b) calculated the HTCs of SCW using a numerical model with the re-normalization group (RNG) k–ε turbulent model coupled to an enhanced wall function. They compared the results with the experimental data reported by Yamagata et al. (1972), and investigated the effects of the wall (including those of the wall properties and thicknesses) and fluid properties. Yang et al. (2021) used the RNG k–ε turbulent model with an enhanced wall function to investigate the mechanisms of deterioration and oscillation of the inner wall temperature during SCW cooling in horizontal tubes with sections of various non-circular shapes. Huang et al. (2018) studied the HTCs of SCW and CO2 in a helical tube using a numerical calculation model, and discovered that the SST k–ω turbulent model agreed well with the experimental results of Wang et al. (2014), who demonstrated that the maximum wall temperature was at a certain angle in the circumferential direction under the effects of centrifugal force and buoyancy in the helical tube. Wang et al. (2015) studied the applicability of various turbulence models for heat transfer calculations in helical tubes using the experimental data from convective heat transfer of supercritical CO2 in helical tubes.
Ignoring the wall thickness and loading a uniform heat flux makes the analytical conditions different from those of the actual operation. Moreover, the circumferential non-uniformities at the cross section may deviate from the actual value when the wall thickness is ignored. To study the effect of heat transfer on SCW under non-uniform heating, researchers (Li et al., 2014; Rowinski et al., 2017; Li and Bai, 2018) loaded axial and circumferential non-uniform heat fluxes on the wall. It was found that a non-uniform heat flux on the wall affected the distribution of buoyancy, leading to the earlier appearance of wall temperature peaks and affecting the local HTCs.
In summary, the effects of the wall on the HTCs of helical tubes need further investigation. Here, the local HTCs of SCW in helical tubes with various helix diameters under 24.5 MPa were investigated and the effects of finite-thickness wall, inlet mass flux, and helix diameter were analyzed using the computational fluid dynamics software package ANSYS Fluent. The results could provide technical guidance for the design and safe operation of supercritical steam generators in HTR-PM.
2 Numerical simulation
2.1 Physical model
Figure 2 shows the tube structures and circumferential angle θ of the cross section in the helical tubes, where the values of θ at the top, inside, bottom, and outside are 0°, 90°, 180°, and 270°, respectively. Figure 2A shows a straight tube inclined at 7.16°, with inner diameter of 7.5 mm, heated length of 6,000 mm, and adiabatic sections (500 mm long) at the inlet and outlet. The helical tubes shown in Figure 2B have a heated length of 6,000 mm and adiabatic sections (500 mm long) at the inlet and outlet. The helical tubes with inner diameter of 7.5 mm are labeled A, B, and C, and the corresponding helix diameters D are 70.5 mm, 105.5 mm, and 140.5 mm; all tubes have the same inclination angle of 7.16°. The finite-thickness walls of the tubes were of 2 mm thickness and made of Incoloy 800H, which is the key material of the HTR-PM subcritical steam generator tubes; the material density ρw was 8,030 kg/m3, specific heat Cp,w was 502 J/(kg·K), and thermal conductivity λw ranged between 11.6–25.1 W/(m·K) depending on the temperature. The fluid in all tubes flowed from bottom to top.
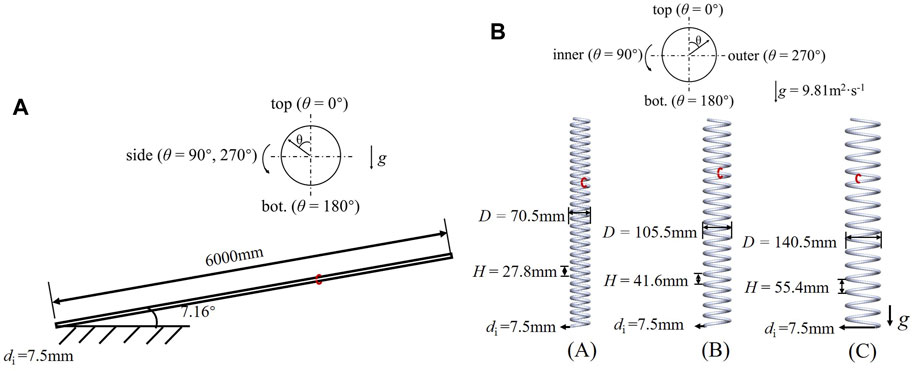
FIGURE 2. Structures and angular coordinates of the investigated tubes. (A) 7.16° inclined straight tube; (B) Helical tubes.
Figure 2 shows the circumferential angle θ of the cross section, where the value of θ at the top was 0° and those at the sides were 90° and 270° (owing to the symmetry of straight tubes); in the helical tubes, the values of θ on the inside, outside, and at the bottom were 90°, 270°, and 180°, respectively.
The parameters applied in the simulation cases are with various inlet mass flux in straight and helical tubes with zero-thickness (no wall)/2 mm-thickness wall. SCW flowed upward in the tubes at a pressure of 24.5 MPa. The inlet temperature was 586.02 K, and the heat fluxes on the inner wall were all 100 kW/m2. In all the simulations of the present work, the heat flux (heat flux in tubes with no wall or volumetric heat source in tubes with 2-mm-thickness wall) applied on the walls are assumed constant and uniform. The inlet mass flux under Con. I, Con. II, and Con. III were 225 kg/(m2·s), 338 kg/(m2·s), and 1,260 kg/(m2·s), respectively.
2.2 Numerical method
This study utilizes the finite volume method with the RNG k-ε model with enhanced wall treatment (see our previous research (Lemmon et al., 2007; Zhang et al., 2015b)), taking various thermophysical properties of SCW into account. The NIST standard database (Zhang et al., 2019b) is used to determine the physical properties of the materials during the calculation process.
The mass, momentum, and energy conservation equations are as follows.
The mass-conservation is calculated as
The momentum -conservation is calculated as
where
The energy conservation equation is
where E is the total energy, and
The RNG model is used with the enhanced wall treatment to study 3-D HTCs in straight and helical tubes. The turbulent transport equations are as follows.
Turbulent kinetic energy, k, transport is calculated as (Durbin, 1991; Behnia et al., 1998).
The transport equation of turbulent kinetic energy dissipation rate, ε (Durbin, 1991; Behnia et al., 1998), is
where
The SIMPLEC algorithm was used in the simulation to determine the pressure-velocity coupling in the domain. For spatial discretization, the discretization settings were set to second-order upwind. The convergence criterion was set to 1 × 10⁻⁶ for continuity, velocity, energy, turbulent kinetic energy, and turbulent dissipation rate.
2.3 Grid independence verification
The structured 3-D meshes are refined for the simulation. Away from the near-wall region, the grid size is increased by 1.1 toward the tube center. The distance between the first node and the wall is determined using the RNG k-ε model with enhanced wall treatment, and the non-dimensional wall distance, y+, is set to less than 0.2 to ensure y+ independence.
Because the helical tube structures are more complex than straight tube structures, the 7.16° inclined helical tube is selected for grid independence analysis. To obtain grid-independent results, the number of circumferential and axial grids is refined, with the number of elements ranging from 1,026,300 to 7,694,400, numbered as Grid-1 to Grid-4. The outlet heat transfer coefficients are compared using various grids. The enthalpy ib(l), bulk temperature Tb(l), and local heat transfer coefficients h(l) can be calculated as follows.
The enthalpy equation is expressed as
where ib,in is the enthalpy at the heating-section inlet, J/kg, qw is the inner-wall heat flux, W/m2, l is the length of the heating section, m, and G is the mass flux, kg/(m2·s).
Tb is calculated based on the local fluid enthalpy and pressure using the NIST standard database (Zhang et al., 2019b). The local heat transfer coefficients can be expressed as follows.
where Tw is the local wall temperature, K.
The average heat transfer coefficients at the 7.16° inclined helical tube outlet of Grid-1 to Grid-3 are compared with that of Grid-4 with the maximum number of grids. The relative error, ζ, is defined as follows.
The relative errors ζ between Grid-1, Grid-2, Grid-3 and Grid-4 are 26%, 7% and 0.8%, respectively. With the encryption of circumferential and axial grids, the value of ζ decreases. Considering accuracy and calculation time, Grid-3 is selected, with 5,665,950 elements.
2.4 Model verification
Yamagata et al. (1972) investigated the changes at the inner wall temperature with water enthalpy in a vertical tube (diameter: 7.5 mm) with uniform heat flux of 233 and 465 kW/m2 at a pressure of 24.5 MPa and mass flux of 1,260 kg/(m2·s). Here, the numerical model is tested on a 1,500 mm heated vertical 3-D tube with adiabatic sections (500 mm long) at the inlet and outlet to verify that it accurately predicts HTCS of SCW. SCW flows from the bottom to the top with a given inlet mass flux and temperature.
Figure 3 depicts the wall temperature, Tw, in the experiment by Yamagata et al. (1972) and the numerical simulations under various uniform wall heat fluxes versus the fluid bulk enthalpy, ib. The local wall temperature results exhibited a maximum relative deviation of <2%. It is proved that the model is suitable for heat transfer calculation with SCW.
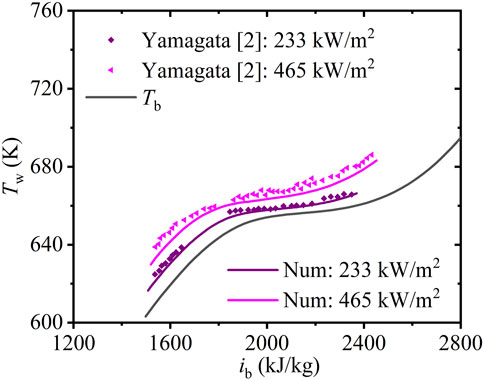
FIGURE 3. Simulated results compared to experimental results.
3 Results and discussion
3.1 Effects of finite-thickness wall on HTCs
This section presents the axial and circumferential variations in the HTCs in straight and helical tubes under the effects of the finite-thickness wall.
3.1.1 Effects of finite-thickness wall in straight tubes on HTCs
This section presents the variation in the HTCs in straight tubes with inclination of 7.16° due to the effects of a finite-thickness wall under Con. III.
Figure 4 shows the axial dimentionless heat flux (q/qav, ratio of local heat flux to the average heat flux on the inner wall) of three regions along the straight tube with wall thickness of 2 mm under Con. III. Unlike a uniformly heated wall, the heat capacity along three regions (top, side, and bottom) in the tube with a finite-thickness wall changes with non-uniform turbulent kinetic energy, which results in differences in the circumferential dimentionless heat flux. At the lowest density, the dimentionless heat flux along the top region are the minimum, followed by those on the side.
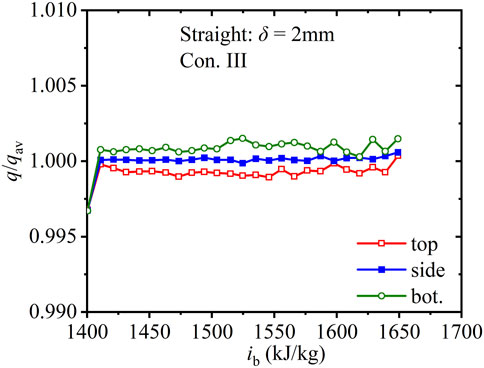
FIGURE 4. Axial dimentionless heat flux along the straight tube with 2 mm wall thickness (Con. III: Gin = 1, 260 kg).
Figure 5 shows the axial heat transfer coefficients h of SCW along straight tubes under Con. III. The values of h in tubes with and without the finite-thickness wall are compared. The heat transfer coefficients at the bottom are the highest, followed by those at the sides and top. Unlike the differences in the heat flux factor along the three regions in the straight tube with wall thickness of 2 mm, the heat transfer coefficients in straight tubes appear less sensitive to the wall.
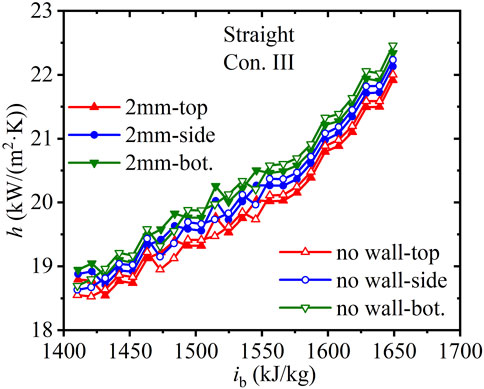
FIGURE 5. Axial heat transfer coefficients along straight tubes with various wall thicknesses (Con. III: Gin = 1, 260 kg).
3.1.2 Effects of finite-thickness wall in helical tubes on HTCs
This section presents the variation in the HTCs in helical tubes with helix diameter of 105.5 mm, caused by the effects of finite-thickness wall.
Figure 6 shows the axial dimentionless heat flux, q/qav, of four regions along the helical tube with wall thickness of 2 mm under Con. III. In the helical tube with zero-thickness wall, a uniform heat flux was imposed on the tube wall, so the effects of the wall have been ignored. While in the helical tube with wall thickness of 2 mm given volumetric heat source, the heat flux along four regions is significantly different. With the outlet enthalpy much lower than ipc (thermophysical properties change dramatically near ipc in Figure 1), the dimentionless heat flux of the four regions change gently along the helical tube. The values of q/qav represent the heat transfer capacity. The average values of q/qav at the top and bottom are the same (1.06), whereas those on the inside and outside are 0.80 and 1.09, respectively. It can be concluded that the heat transfer capacity on the outside is the best, followed by those at the top and bottom, whereas that on the inside is the worst. The relative difference in q/qav between the top and bottom, caused by buoyancy, is lower than 1%, whereas that between the inside and bottom, caused by the centrifugal force, is 36% in Figure 6. Under a large inlet mass flux, the relative value of the centrifugal force is much higher than that of buoyancy in the helical tube.
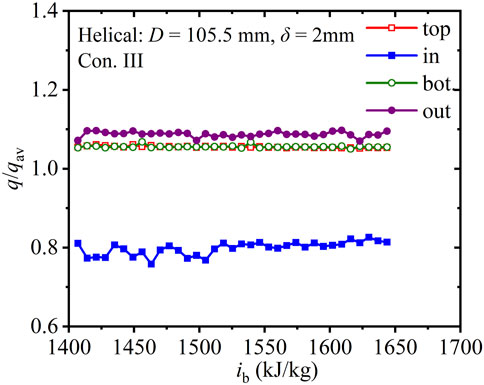
FIGURE 6. Axial dimentionless heat flux along the helical tube with 2 mm wall thickness (D = 105.5 mm, Con. III: Gin = 1, 260 kg).
Figure 7 shows the axial wall temperatures, Tw, along the four regions in helical tubes with helix diameter of 105.5 mm under Con. III; the values of Tw in tubes with and without finite-thickness walls are compared. In Figure 7A, the difference in the wall temperature between the inside and outside is 6.2 K in the tube without the finite-thickness wall. In Figure 7B, the wall temperature difference between the inside and outside is 4.4 K in the tube with wall thickness of 2 mm. The finite-thickness wall contributes to the circumferential heat exchange, significantly reducing the wall temperature difference between the inner and outer regions by 29%.
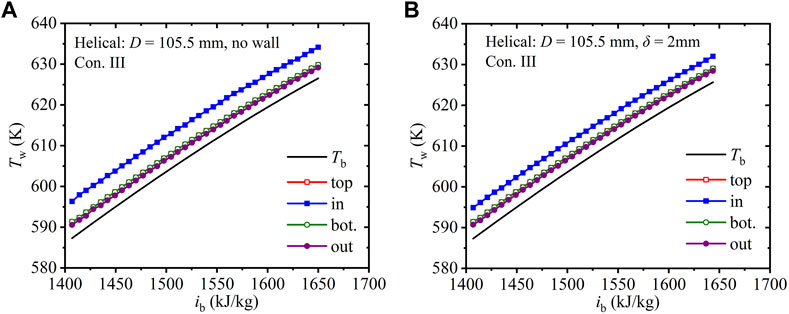
FIGURE 7. Axial wall temperature along helical tubes with various wall thicknesses (D = 105.5 mm, Con. III: Gin = 1, 260 kg).
Figure 8 shows the axial heat transfer coefficients, h, of SCW along four regions in the helical tube with 105.5 mm helix diameter under Con. I and Con. II. When the fluid enthalpy is close to ipc, the heat transfer capacity increases with increase in the fluid velocity. However, as shown in Figure 8, (ρ·Cp), which affects the ability to accommodate and carry heat, reaches the maximum before ipc. Correspondingly, under Con. I and Con. II, the maximum heat transfer coefficients at the four regions appear before ipc. In Figure 8A without the finite-thickness wall, the difference in the average heat transfer coefficient between the outer and inner regions is 6.5 kW/(m2·K) (relative difference 131%) under Con. I and 11.7 kW/(m2·K) (relative difference 142%) under Con. II. In Figure 8B with wall thickness of 2 mm, the difference in the average heat transfer coefficient between the outer and inner regions is 6.2 kW/(m2·K) (relative difference 128%) under Con. I and 11.4 kW/(m2·K) (relative difference 137%) under Con. II. The finite-thickness wall contributes to reducing the difference in h between the outer and inner regions.
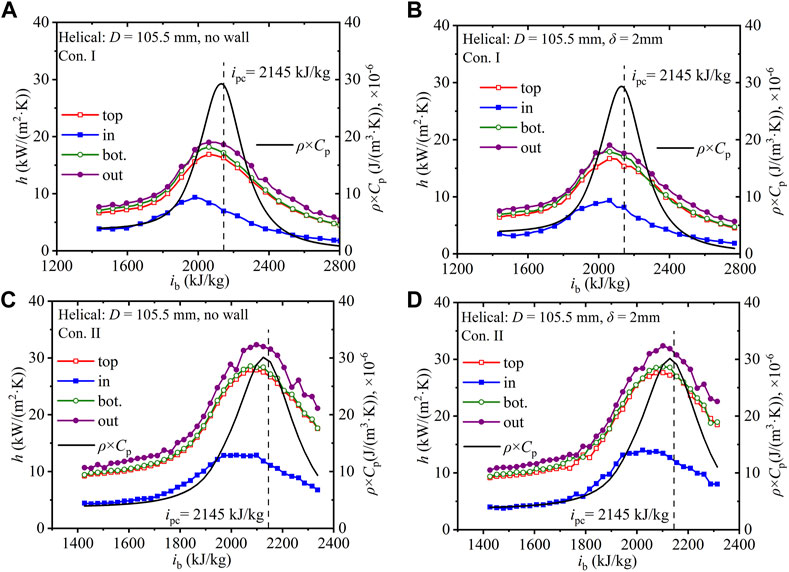
FIGURE 8. Axial heat transfer coefficients along helical tubes with various wall thicknesses (D = 105.5 mm). (A) No wall-Con. I; (B) 2 mm wall thickness-Con. I; (C) No wall-Con. II; (D) 2 mm wall thickness-Con. II.
According to the development of the circumferential maximum wall temperature along the helical tubes, six typical temperature regions were selected: (i) the maximum wall temperature is lower than Tpc (Tw, max < Tpc), (ii) the maximum wall temperature is higher but the average wall temperature is lower than Tpc (Tw, av < Tpc < Tw, max), (iii) the average wall temperature is higher but the minimum wall temperature is lower than Tpc (Tw, min < Tpc < Tw, av), (iv) the minimum wall temperature is higher but the fluid temperature is lower than Tpc (Tb < Tpc < Tw, min), (v) the fluid temperature reaches Tpc (Tb = Tpc), (vi) and the fluid temperature exceeds Tpc (Tpc < Tb).
Figure 9 shows the development of the dimensionless circumferential wall temperature (Tw/Tw,max) in the helical tube with 105.5 mm helix diameter under Con. I. Figure 9A depicts the case of the tube without the finite-thickness wall; Figure 9B depicts the case of the tube with wall thickness of 2 mm. The maximum wall temperature appears when θ increases from 0° to 360°, with the preceding wall temperature changing drastically before reaching Tw,max. The non-uniformities in the wall temperature shown in Figure 9 result from the combined effects of buoyancy and centrifugal forces. θ of Tw,max aids the comparison of the relative scale between the centrifugal force and buoyancy. In Figure 9A, for the temperature regions from Tw, max < Tpc to Tb < Tpc < Tw,min, the maximum wall temperature moves from the inside to the top (from 64° to 54°), which proves that the buoyancy effect is enhanced. For the temperature region of Tw,max = Tpc, the maximum wall temperature moves from the top to the inside (from 54° to 72°), which proves that with increase in the fluid temperature, the density decreases whereas the fluid velocity increases, resulting in increased centrifugal force. For the temperature region of Tpc < Tb, the maximum wall temperature appears at θTw, max = 90° (inner region). The circumferential (Tw/Tw,max) differences in helical tubes with and without a finite-thickness wall are depicted in Figure 10, where the value is 37 K in Figure 9A and 13 K in Figure 9B. The finite-thickness wall contributes to circumferential heat diffusion, which homogenizes the circumferential wall temperature distribution. The intervals of θTw, max in helical tubes with and without the finite-thickness wall are 36° in Figure 9A and 27° in Figure 9B. The finite-thickness wall reduces the interval of θTw, max.
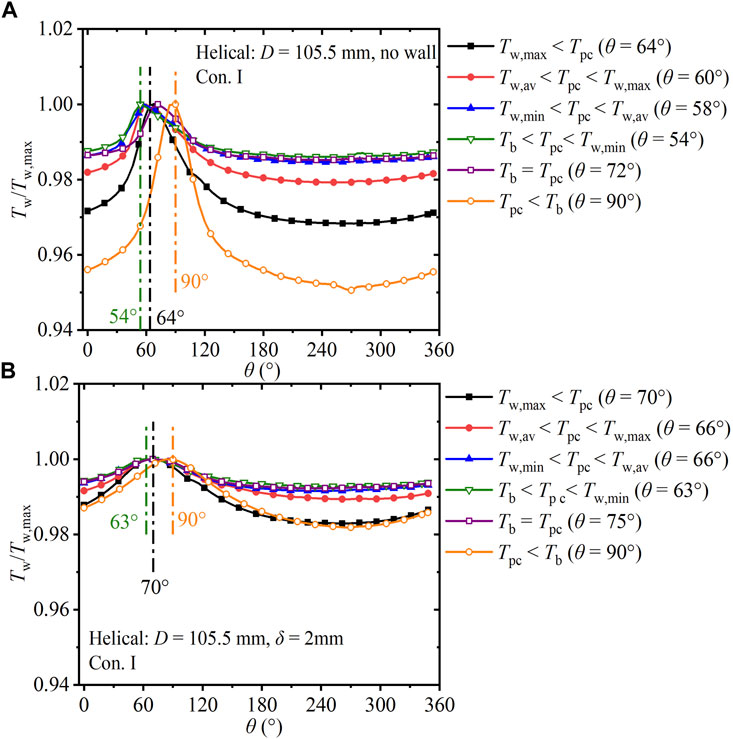
FIGURE 9. Development of circumferential Tw/Tw,max in the helical tube versus θ (D = 105.5 mm, Con. I: Gin = 225 kg).
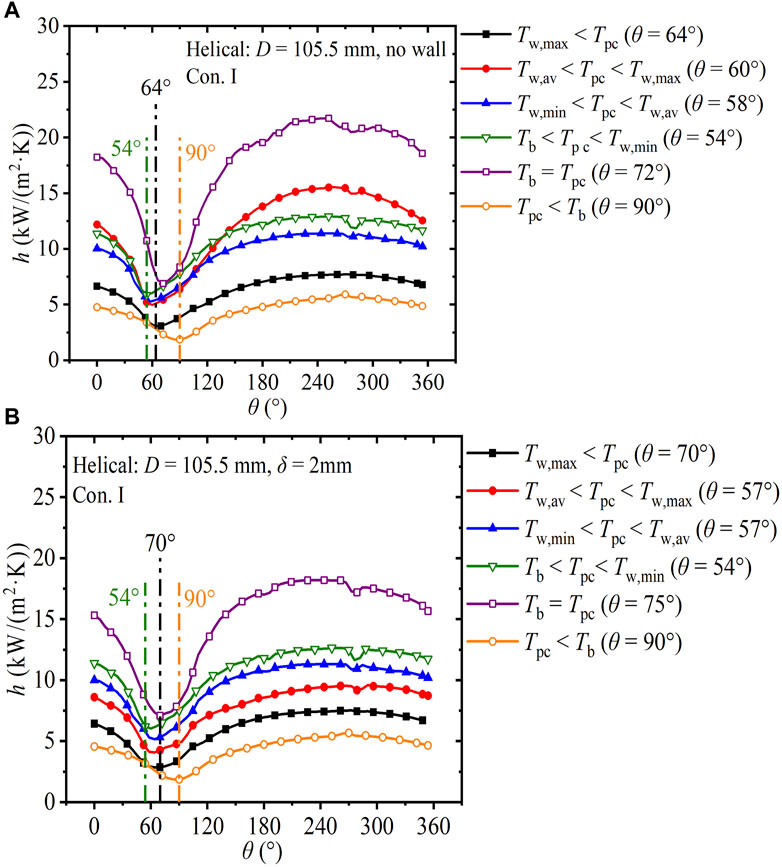
FIGURE 10. Development of circumferential heat transfer coefficients in the helical tube (Con. I: Gin = 225 kg).
Figure 10 shows the development of the circumferential heat transfer coefficient h of SCW in the helical tube with 105.5 mm helix diameter under Con. I. Figure 10A depicts the results for the tube without a finite-thickness wall, and Figure 10B depicts the results for the tube with wall thickness of 2 mm. In Figure 10A, for the temperature regions from Tw, max < Tpc to Tb = Tpc, circumferential hmax increases from 7.7 kW/(m2·K) to 21.7 kW/(m2·K). For the temperature region of Tpc = Tb, the average circumferential h is the maximum (17.4 kW/(m2·K)), with the maximum relative difference of 216%. For the temperature region of Tpc < Tb, circumferential h drops sharply in the range of 1.9–5.9 kW/(m2·K), which deteriorates the heat transfer. The maximum circumferential h in helical tubes without and with finite-thickness walls are 14.8 kW/(m2·K) (Figure 10A) and 11.1 kW/(m2·K) (Figure 10B), respectively. The finite-thickness wall contributes to the circumferential heat diffusion, which homogenizes the circumferential h distribution.
3.2 HTCs in helical tubes with finite-thickness wall
This section presents the axial and circumferential variations in HTCs in helical tubes with wall thickness of 2 mm under the effects of buoyancy, mass flux, and helix diameter.
3.2.1 Effect of buoyancy
As shown in Figure 1, the thermophysical properties of SCW change dramatically with increase in temperature. These changes induce buoyancy in the cross section and axial thermal acceleration. To quantitatively analyze the effect of buoyancy and thermal acceleration on the HTCs in the tubes, Hall and Jackson (Hall and Jackson, 1969; Hall, 1971) proposed the buoyancy factor, Bo*. McEligot et al. (1970); (Jackson et al., 1989) proposed the acceleration factor, Kv.
where,
where, Gr* is the Grashof number, Re is the Reynolds number, Pr is the Prandtl number, g denotes the acceleration due to gravity, d denotes the inner diameter, q denotes the heat flux, β denotes the isothermal compression coefficient, λ denotes the thermal conductivity, υ denotes the kinematic viscosity, G denotes the mass flux, μ denotes the dynamic viscosity, and Cp denotes the specific heat.
Jackson et al. (1989); (Koshizuka et al., 1995) proposed a theoretical model for the relationship between Bo* and heat transfer coefficients under heating. When Bo* <6 × 10⁻⁷, the buoyancy effect on the HTCs is relatively weak; when 6 × 10⁻⁷ < Bo* <1.2 × 10⁻⁶, the buoyancy degrades the heat transfer; when 1.2 × 10⁻⁶ < Bo* <8 × 10⁻⁶, the buoyancy helps to recover the heat transfer; when Bo* >6 × 10⁻⁷, the buoyancy enhances the heat transfer.
where, αp refers to volume expansivity.
McEligot et al. (1970) proposed that when Kv < 3 × 10⁻⁶, the thermal acceleration effect on the HTCs is relatively weak, when Kv ≥ 3 × 10⁻⁶, the thermal acceleration deteriorates the heat transfer.
Figure 11 shows the maximum Bo* and Kv calculated using Equation 14−(18) for the nine cases with various inlet mass flux and helix diameter. The effects of the helix diameter on the maximum Bo* and Kv are relatively weak, whereas obvious differences in the maximum Bo* and Kv are observed under various inlet mass fluxes. In Figure 11A, for the range of 1.2 × 10⁻⁶ < Bo*max < 8 × 10⁻⁶ under Con. I and Con. II, the buoyancy affects the heat transfer and helps in recovering it. Under Con. III, for Bo* <6 × 10⁻⁷, the buoyancy effect on the HTCs is relatively weak. In Figure 11B, Kv < 3 × 10⁻⁶, which indicates that the thermal acceleration effect on the HTCs is relatively weak.
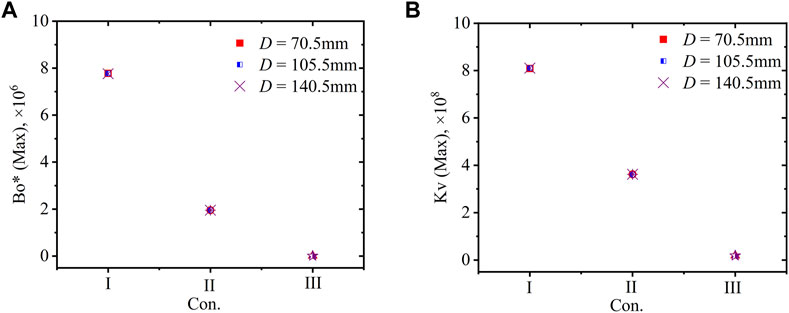
FIGURE 11. Maximum Bo*and Kv in helical tubes with various helix diameter under various conditions (δ = 2 mm). (A) No wall; (B) 2 mm wall thickness.
3.2.2 Effect of mass flux
In Section 3.1.2, it can be concluded that the finite-thickness wall contributes to the circumferential heat exchange, significantly reducing the wall temperature and h difference between the inner and outer regions. This section mainly focuses on analyzing the effects of mass flux on heat transfer in the helical tubes with wall thickness of 2 mm.
Figure 12 shows the axial heat transfer coefficients, h, of SCW along four regions in the helical tube with 105.5 mm helix diameter and wall thickness of 2 mm under Con. III. Comparing Figure 12 with Figures 8B, D, the relative differences in the average heat transfer coefficient in the top-to-bottom direction are 5%, 3%, and much less than 1% under Con. I, Con. II, and Con. III, respectively, which indicates that the buoyancy effect is weakened with increasing mass flux. In the inner-to-outer direction, the relative differences in the average heat transfer coefficient were 128%, 137%, and 211% under Con. I, Con. II, and Con. III, respectively, which indicates that with increasing mass flux, the heat transfer capacity in the outer region is enhanced and the difference in the heat transfer capacity between the inner and outer regions widens.
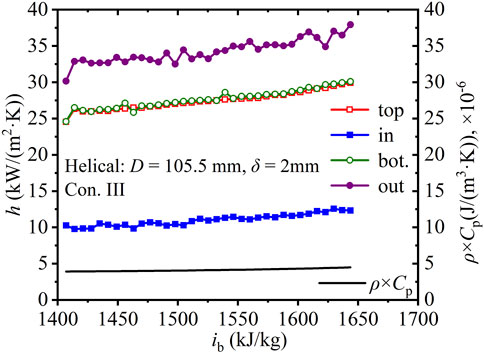
FIGURE 12. Axial heat transfer coefficients along the helical tube (D = 105.5 mm, δ = 2 mm, Con. III: Gin = 1, 260 kg).
Figure 13 shows the development of the dimensionless circumferential wall temperature (Tw/Tw,max) in the helical tube with 105.5 mm helix diameter and wall thickness of 2 mm under various inlet mass fluxes. The maximum differences in the wall temperature under Con. I, Con. II, and Con. III are 11 K, 9 K, and 4 K, respectively. With increase in the mass flux, Re increases and the heat transfer capacity is enhanced, which reduces the difference in the wall temperature. In addition, θTw, max shifts from 70° to 90°, and the effect of buoyancy is weakened whereas that of the centrifugal force is strengthened.
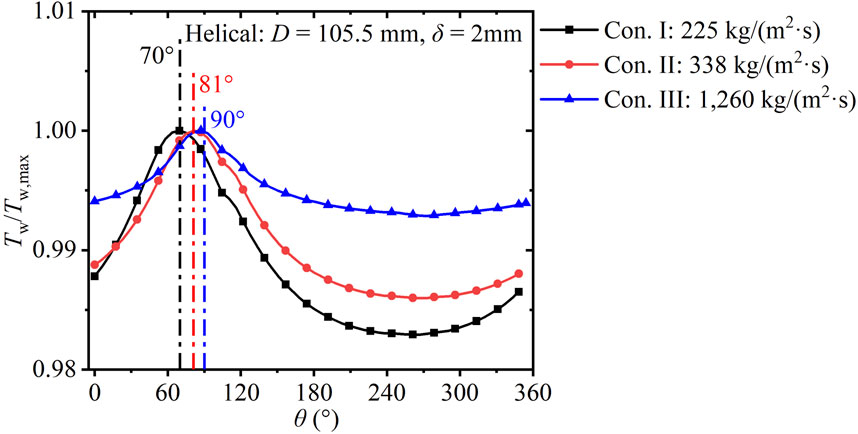
FIGURE 13. Development of circumferential Tw/Tw,max in helical tubes versus θ under various conditions (D = 105.5 mm, δ = 2 mm).
3.2.3 Effect of helix diameter
Figure 14 shows the development of the circumferential dimensionless wall temperature (Tw/Tw,max) in helical tubes with various helix diameters and wall thickness of 2 mm under Con. I. Figures 14A, B depict the results for the cases of helix diameters of 70.5 mm and 140.5 mm, respectively. With θ increasing from 0° to 360°, Tw, max occurs between the top region (0°) and inner region (90°); the wall temperature before the maximum value varies more dramatically than that after the maximum value. Comparing Figure 14 with Figure 9B, with the helix diameter increasing from 70.5 mm to 140.5 mm, θTw, max decreases from 79° to 70°–66° in the Tw, max < Tpc section, shifting from the inner region to the top region; in the section Tpc < Tb, the maximum difference in Tw/Tw, max decreases from 0° to 360° (0.019, 0.018, 0.017), and Tw gradually moves to the high-temperature zone.
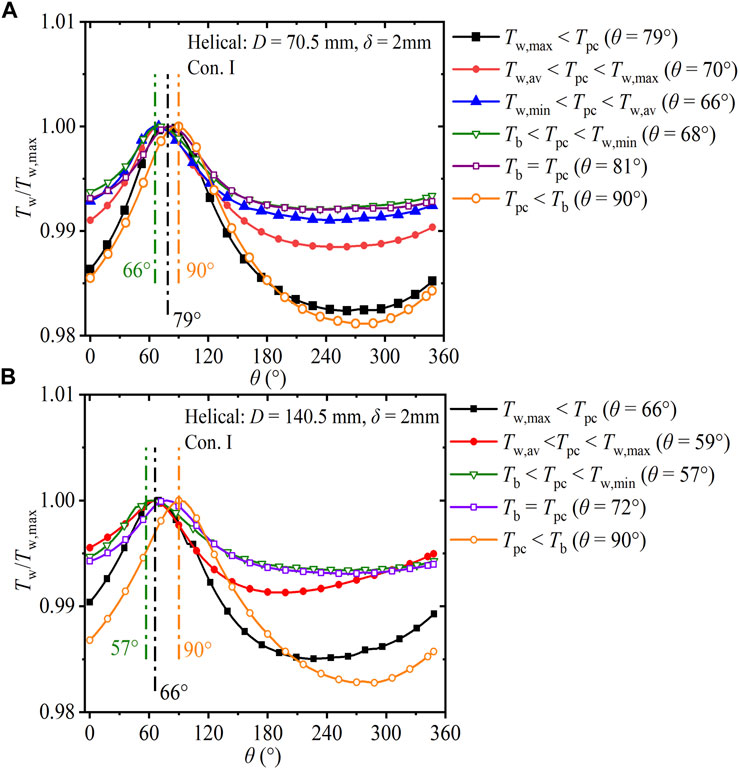
FIGURE 14. Development of circumferential Tw/Tw,max in helical tubes versus θ (δ = 2 mm, Con. I: Gin = 225 kg). (A) D = 70.5 mm; (B) D = 140.5 mm.
Figure 15 shows the development of the circumferential heat flux factor q/qav along the helical tube with wall thickness of 2 mm under Con. I. Figures 15A, B, C depict the results for helix diameters of 70.5 mm, 105.5 mm, and 140.5 mm, respectively. Under the effect of centrifugal force, the mass flux in the inner region is lower than that in the outer region, resulting in poor heat transfer capacity. In Figure 15B, for the case of Tw, max < Tpc to Tb < Tpc < Tw, min, the buoyancy drains the fluid flow close to the wall from bottom to top, which shifts θTw, max from 70° to 54°. With increasing fluid temperature, the fluid velocity increases and density decreases, which enhances the centrifugal force, resulting in lower heat transfer capacity in the inner region. In the case of Tpc < Tb, (q/qav)min appears at θTw, max = 90° (inner region). q/qav is greatly affected by the helix diameter before the fluid temperature reaches Tpc. In the region of Tw, max < Tpc, the maximum difference in q/qav for helix diameters of 70.5 mm, 105.5 mm, and 140.5 mm are 0.40 (Figure 15A), 0.34 (Figure 15B), and 0.33 (Figure 15C), respectively. With increase in the helix diameter, the difference in q/qav decreases.
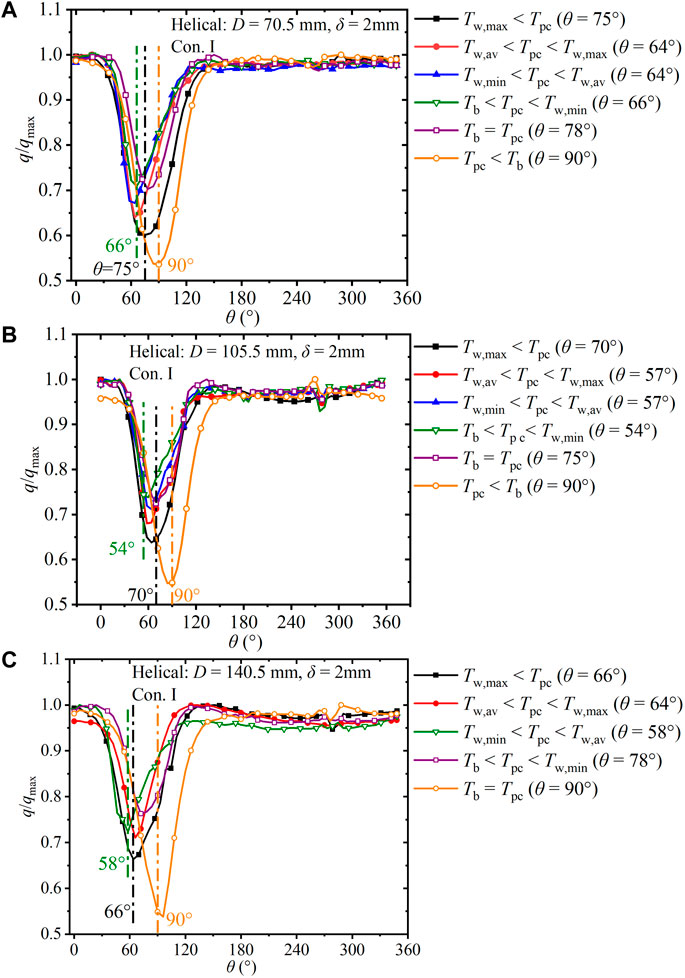
FIGURE 15. Development of circumferential dimentionless heat flux in helical tubes versus θ (δ = 2 mm, Con. I: Gin = 225 kg). (A) D = 70.5 mm; (B) D = 105.5 mm; (C) D = 140.5 mm.
4 Conclusion
The axial and circumferential non-uniform HTCs of SCW in helical tubes with various helix diameters under 24.5 MPa were investigated and the effects of finite-thickness wall, inlet mass flux, and helix diameter were analyzed. The numerical simulation results were first compared with the experimental data from Yamagata et al. (Yamagata et al., 1972) to validate our numerical model, which uses the RNG k–ε turbulent model coupled with an enhanced wall function. The axial distribution of fluid temperature, wall temperature, and heat transfer coefficients, maximum Bo* and Kv and development of circumferential Tw/Tw,max, heat transfer coefficients, q/qav were studied. Based on these results, the following conclusions can be drawn:
(1) The finite-thickness wall barely affects local heat transfer in the straight tube with inlet mass flux of 1,260 kg/(m2 s) whereas the finite-thickness wall contributes to the circumferential heat exchange, significantly reducing the wall temperature difference between the inner and outer regions by 29% and with relative difference in q/qav between the inside and bottom by 36%.
(2) The effects of the helix diameter on the maximum Bo* and Kv are relatively weak, whereas obvious differences in the maximum Bo* and Kv are observed under various inlet mass fluxes.
(3) With increase in the mass flux, the difference in the wall temperature gets reduced; the heat transfer capacity in the outer region is enhanced and the difference in the heat transfer capacity between the inner and outer regions widens.
(4) With increase in helix diameter, from 70.5 mm to 140.5 mm, θTw, max decreases from 79° to 70°–66° in the Tw, max < Tpc section, the reason of which is that the buoyancy force strengthens first and then with increasing flow velocity, the centrifugal force increases; in the section Tpc < Tb, the maximum difference in Tw/Tw, max decreases from 0° to 360° (0.019, 0.018, 0.017), and Tw gradually moves to the high-temperature zone. With increase in the helix diameter, the difference in q/qav decreases.
Data availability statement
The raw data supporting the conclusion of this article will be made available by the authors, without undue reservation.
Author contributions
ML: numerical simulation; application of statistical, mathematical, and computational to analyze the data. ZZ: review and editing; acquisition of the financial support. XY: ideas; evolution of overarching research goals and aims. SJ: review.
Funding
The Analyses and Tests for the Key Safety Technology of Nuclear Heating Reactor NHR200-II; Young Talent Project of China National Nuclear Corporation.
Acknowledgments
The authors are grateful for the support of the Analyses and Tests for the Key Safety Technology of Nuclear Heating Reactor NHR200-II and Young Talent Project of China National Nuclear Corporation.
Conflict of interest
The authors declare that the research was conducted in the absence of any commercial or financial relationships that could be construed as a potential conflict of interest.
Publisher’s note
All claims expressed in this article are solely those of the authors and do not necessarily represent those of their affiliated organizations, or those of the publisher, the editors and the reviewers. Any product that may be evaluated in this article, or claim that may be made by its manufacturer, is not guaranteed or endorsed by the publisher.
References
Behnia, M., Parneix, S., and Durbin, P. (1998). Prediction of heat transfer in an axisymmetric turbulent jet impinging on a flat plate. Int. J. Heat. Mass Transf. 41 (12), 1845–1855. doi:10.1016/s0017-9310(97)00254-8
Durbin, P. A. (1991). Near-wall turbulence closure modeling without “damping functions”. Theor. Comp. Fluid Dyn. 3, 1–13. doi:10.1007/bf00271513
Fewster, J., and Jackson, J. D. (2004). “Experiments on supercritical pressure convective heat transfer having relevance to SCWR,” in Proceedings of the International Congress on Advances in Nuclear Power Plants, Pittsburgh, USA, 24 August 2022 (ICAPP ’4-4342).
Hall, W. B., and Jackson, J. D. (1969). Laminarisation of a turbulent pipe flow by buoyancy forces, 11th national heat transfer conf., special session on laminarization of turbulent flows. Mimmeapolis: ASME. Paper No. 69-HT-55.
Huang, X. R., Zhang, Z., Yang, X. T., Jiang, S. Y., and Tu, J. Y. (2018). Numerical study on heat transfer characteristic of CO2 in helical tube at supercritical pressure. A. Energy Sci. Technol. 52 (05), 769–775. doi:10.7538/yzk.2017.youxian.0605
Jackson, J. D., Cotton, M. A., and Axcell, B. P. (1989). Studies of mixed convection in vertical tubes. Int. J. Heat Fluid Flow 10 (01), 2–15. doi:10.1016/0142-727x(89)90049-0
Koshizuka, S., Takano, N., and Oka, Y. (1995). Numerical analysis of deterioration phenomena in heat transfer to supercritical water. Int. J. Heat. Mass Transf. 38 (16), 3077–3084. doi:10.1016/0017-9310(95)00008-w
Lemmon, E. W., Huber, M. L., and McLinden, M. O. (2007). Reference fluid thermodynamic and transport properties, NIST standard reference database 23.
Li, F. B., and Bai, B. F. (2018). Flow and heat transfer of supercritical water in the vertical helically-coiled tube under half-side heating condition. Appl. Therm. Eng. 133, 512–519. doi:10.1016/j.applthermaleng.2018.01.047
Li, Z. H., Wu, Y. X., Lu, J. F., and Zhang, D. L. H. (2014). Heat transfer to supercritical water in circular tubes with circumferentially non-uniform heating. Appl. Therm. Eng. 70 (01), 190–200. doi:10.1016/j.applthermaleng.2014.05.013
McEligot, D. M., Coon, C. W., and Perkins, H. C. (1970). Relaminarization in tubes. Int. J. Heat. Mass Transf. 13 (2), 431–433. doi:10.1016/0017-9310(70)90118-3
Mokry, S., Pioro, I., Kirillov, P., and Gospodinov, Y. (2010). Supercritical-water heat transfer in a vertical bare tube. Nucl. Eng. Des. 240 (3), 568–576. doi:10.1016/j.nucengdes.2009.09.003
Rowinski, M. K., Zhao, J. Y., White, T. J., and Soh, Y. C. (2017). Numerical investigation of supercritical water flow in a vertical pipe under axially non-uniform heat flux. Prog. Nucl. Energy 97, 11–25. doi:10.1016/j.pnucene.2016.12.009
Sheeba, A., Abhijith, C. M., and Jose Prakash, M. (2019). Experimental and numerical investigations on the heat transfer and flow characteristics of a helical coil heat exchanger. Int. J. Refrig. 99, 490–497. doi:10.1016/j.ijrefrig.2018.12.002
Wang, K. Z., Xu, X. X., Wu, Y. Y., Liu, C., and Dang, C. B. (2015). Numerical investigation on heat transfer of supercritical CO2 in heated helically coiled tubes. J. Supercrit. Fluid 99, 112–120. doi:10.1016/j.supflu.2015.02.001
Wang, S. X., Niu, Z. Y., Zhang, W., and Xu, J. L. (2014). Experimental investigations on heat transfer of supercritical CO2 flowing through a helically coiled tube. Nucl. Power Eng. 35 (01), 28–31.
Yamagata, K., Nishikawa, K., Hasegawa, S., Fujii, T., and Yoshida, S. (1972). Forced convective heat transfer to supercritical water flowing in tubes. Int. J. Heat. Mass Transf. 15 (12), 2575–2593. doi:10.1016/0017-9310(72)90148-2
Yang, M., Li, G. R., Liao, F., Li, J. D., and Zhou, X. (2021). Numerical study of characteristic influence on heat transfer of supercritical CO2 in helically coiled tube with non-circular cross section. Int. J. Heat. Mass Transf. 176, 121511. doi:10.1016/j.ijheatmasstransfer.2021.121511
Zhang, W., Wang, S. X., Li, C. D., and Xu, J. L. (2015). Mixed convective heat transfer of CO2 at supercritical pressures flowing upward through a vertical helically coiled tube. Appl. Therm. Eng. 88, 61–70. doi:10.1016/j.applthermaleng.2014.10.031
Zhang, Z., Yang, X. T., and Jiang, P. X. (2015). Study on heat transfer and flow instability of supercritical water in vertical tube. A. Energy Sci. Technol. 49 (11), 2011–2016. doi:10.7538/yzk.2015.49.11.2011
Zhang, Z., Ye, P., Yang, X. T., Ju, H. M., Jiang, S. Y., and Tu, J. Y. (2019). Supercritical steam generator design and thermal analysis based on HTR-PM. Ann. Nucl. Energy 132, 311–321. doi:10.1016/j.anucene.2019.04.049
Zhang, Z., Zhao, C. R., Yang, X. T., Jiang, P. X., Jiang, S. Y., and Tu, J. Y. (2019). Influences of tube wall on the heat transfer and flow instability of various supercritical pressure fluids in a vertical tube. Appl. Therm. Eng. 147, 242–250. doi:10.1016/j.applthermaleng.2018.10.024
Nomenclature
3-D Three-dimensional
A Area, m2
bot Bottom
Bo* Buoyancy factor
Con. Condition
Cp Specific heat, J/(kg•K)
D Helical diameter, m
d Diameter, m
E Total energy, J/kg
G Mass flux, kg/(m2•s)
Gr Grashof number
g Acceleration of gravity, 9.81 m/s2
HTC Heat transfer characteristic
HTR-PM High-temperature gas-cooled reactor pebble-bed module
h Heat transfer coefficient, W/(m2•K)
i Enthalpy, J/kg
Kv Acceleration factor
k-ε Kappa-epsilon
L Tube full length, m
l Length, m
NIST National Institute of Standards and Technology
Pr Prandtl number
p Pressure, Pa
q Heat flux, W/m2
q/qav Dimentionless heat flux
Re Reynolds number
RNG Renormalization group
SCW Supercritical-pressure water
T Temperature, K
Tw/Tw, max Dimensionless circumferential wall temperatures
u Velocity, m/s
v Kinematic viscosity, m2/s
x Axial direction
y+ Non-dimensional wall distance
Greek symbols
α Volume expansivity, K−1
β Isothermal compression coefficient, MPa-1
δ Wall thickness, mm
ε Turbulent dissipation rate, m2/s3
ζ Solution relative error between different grid
θ Circumferential angle, °
λ Thermal conductivity, W/(m•K)
μ Dynamic viscosity, Pa•s
ρ Density, kg/m3
σk Turbulent Prandtl number of turbulent kinetic energy
σε Turbulent Prandtl number of turbulent dissipation rate
τ Stress tensor, N/m2
Subscripts
4 Grid 4
av Area average
b Bulk fluid
i, j Coordinate direction
in Inlet
max Maximum
min Minimum
o Outlet
pc Pseudo-critical
T Turbulent
w Wall
Keywords: supercritical-pressure water, helical tube, finite-thickness wall, helix diameter, non-uniform heat transfer
Citation: Liu M, Zhang Z, Yang X and Jiang S (2023) Heat transfer of supercritical pressure water in helical tubes. Front. Energy Res. 11:1129469. doi: 10.3389/fenrg.2023.1129469
Received: 22 December 2022; Accepted: 27 January 2023;
Published: 15 February 2023.
Edited by:
Deqi Chen, Chongqing University, ChinaReviewed by:
Hongna Zhang, Tianjin University, ChinaJiang Qin, Harbin Institute of Technology, China
Copyright © 2023 Liu, Zhang, Yang and Jiang. This is an open-access article distributed under the terms of the Creative Commons Attribution License (CC BY). The use, distribution or reproduction in other forums is permitted, provided the original author(s) and the copyright owner(s) are credited and that the original publication in this journal is cited, in accordance with accepted academic practice. No use, distribution or reproduction is permitted which does not comply with these terms.
*Correspondence: Zhen Zhang, emhhbmd6aGVuMTNAdHNpbmdodWEuZWR1LmNu