- 1SDLE Research Center, Department of Materials Science and Engineering, Case Western Reserve University, Cleveland, OH, United States
- 2Department of Materials Science and Engineering, Case Western Reserve University, Cleveland, OH, United States
- 3Cybrid Technologies Inc., Suzhou, Jiangsu, China
- 4CSI Solar Co., Ltd., Suzhou, Jiangsu, China
- 5Department of Computer and Data Sciences, Case Western Reserve University, Cleveland, OH, United States
Degradation pathway models constructed using network structural equation modeling (netSEM) are used to study degradation modes and pathways active in photovoltaic (PV) system variants in exposure conditions of high humidity and temperature. This data-driven modeling technique enables the exploration of simultaneous pairwise and multiple regression relationships between variables in which several degradation modes are active in specific variants and exposure conditions. Durable and degrading variants are identified from the netSEM degradation mechanisms and pathways, along with potential ways to mitigate these pathways. A combination of domain knowledge and netSEM modeling shows that corrosion is the primary cause of the power loss in these glass/backsheet PV minimodules. We show successful implementation of netSEM to elucidate the relationships between variables in PV systems and predict a specific service lifetime. The results from pairwise relationships and multiple regression show consistency. This work presents a greater opportunity to be expanded to other materials systems.
1 Introduction
With each passing year, the field of photovoltaics (PV) is rapidly expanding. The field’s business value of hundreds of billions of dollars and global capacity progressing to terrawatts present a great need for creating long-lasting PV modules to minimize the levelized cost of electricity (LCOE) Jäger-Waldau (2022); Masson and Kaizuka (2020); Cole et al. (2017). Minimizing LCOE involves a careful selection of polymers, cell and module designs, and consideration of potential degradation modes that can arise through the interactions of components under the influence of the external environment. Individual material components in PV systems are affected by several environmental stressors (such as heat and moisture), that can lead to degradation events such as corrosion Hihara et al. (2013), cracking, and discoloration which lead to decreased system performance. Ethylene vinyl acetate (EVA) is the most popular encapsulants in the PV industry. There are emerging polymeric systems that are being designed to overcome the issues with acetic acid formation in EVA in the presence of humidity along with high temperature and/or UV radiation Kempe et al. (2007); de Oliveira et al. (2018). Ultimately, undesirable changes leading to thermal/oxidative/hydrolytic/photo degradation will decrease the overall performance of the system Odegard and Bandyopadhyay (2011); Brebu (2020).
Various models have been used to study degradation in PV modules, as evident from prior literature Radouane et al. (2014); Lindig et al. (2018); Escobar and Meeker (2006); Bala Subramaniyan et al. (2018). Most of these degradation models deal with degradation rates and/or isolated degradation modes to interpret power loss. Studying the degradation rate alone is insufficient in identifying the root cause of degradation. As the models have been constructed for PV modules under specific exposure conditions, they rely on fitting parameters and choosing non-linear terms that would best explain the trend. Such approaches are based on simplified assumptions, do not allow for generalization, and do not correlate to real-world exposure conditions, in which multiple degradation modes occur simultaneously Bruckman et al. (2013b); Nalin Venkat (2021).
Owing to the complex nature of degradation, it is essential to design an elaborate study protocol in which multiple degradation modes of PV variants under exposure can be explored and generalized models can be constructed to gain insights into the overall system performance. In this regard, data-driven modeling techniques are extremely useful in providing valuable insights into degradation behavior Lindig et al. (2018).
Network structural equation modeling (netSEM) is a generalized data-driven approach that allows for a systematic study of linear and non-linear relationships between variables along with the strength of the relationships between them by the usage of stressor, mechanistic variables, and response. netSEM was developed based on the foundational concepts of structural equation modeling (SEM) Ullman and Bentler (2012); prior applications of SEM have been demonstrated in psychology, sociology, and the life sciences netSEM is primarily used to analyze systems that are experiencing degradation of some performance characteristic under exposure to a particular stressor which is considered as an exogenous variable Bruckman et al. (2013b); Yang et al. (2019); Gok et al. (2019b,a).
There are two principles governing the netSEM analysis: Principle 1 (Markovian model) and Principle 2 (multiple regression model). In the Markovian model, variables are exclusively considered in a pairwise relationship and each pathway is described using a linear or non-linear model as well as statistical metrics (not to be confused with the netSEM model that consists of multiple best model pathways between variables). The multiple regression model, on the other hand, considers the multiple relationships among variables when variables change in a simultaneous fashion Yang et al. (2019). The resulting equations can have multiple linear and non-linear terms among several variables (see Section 3.6).
As there are multiple variants being analyzed in this study, it is also possible to obtain statistical insights into degradation and durability by utilizing confidence intervals (CIs). CIs capture the true population values within intervals Barde and Barde (2012). 95% CIs, which are based on the 1-sample t-test, can determine if a variant is durable or degrading at the end of exposure. 83.4% CIs, which are based on the 2-sample t-test, are indicative of difference between two means Knol et al. (2011); Nalin Venkat (2021). In order to determine if two samples behave similarly or differently (based on degree of CI overlap) at the end of exposure, inference of eye method by Cumming and Finch (2005) has been utilized in this study Nalin Venkat (2021).
In this study, we show the statistical analysis using inference by eye and application of netSEM in the context of 4-cell PV modules (referred to as minimodules) in accelerated exposure conditions. The purpose of this study is to compare PV minimodules that differ in packaging strategies. The goal is to analyze which types of PV minimodules undergo substantial power loss at the end of the exposure cycle and also gain insights into active degradation modes Nalin Venkat (2021). From this study, we observe that corrosion is the primary cause of degradation in the glass/backsheet PV minimodules. The results from analyzing pairwise relationships and multiple regression are consistent. To the broader research community, netSEM can be coupled with statistical analysis methods to gain insights into real-world degradation in different materials systems.
2 Study protocol: Experimental and analytical methods
An extensive study protocol, consisting of fabrication, exposures, evaluation, and analysis, was designed to systematically identify causes of degradation. Sixteen PV minimodules were fabricated and exposed in two types of indoor accelerated conditions. Stepwise electrical evaluation was performed to monitor changes in minimodules using current-voltage (I-V) and Suns-Voc measurements. The obtained dataset was used to compare degradation patterns in PV minimodule variants by statistical analysis and network structural equation models. The various components of the study protocol are detailed in the subsequent sections.
2.1 Fabrication of 4-cell PV minimodule variants
Each PV minimodule was fabricated using four multicrystalline monofacial passivated emitter and rear cells (PERC), provided by Canadian Solar Inc. (CSI). The four cells were soldered in series in different fabrication facilities, depending on the manufacturer. The front and rear sides of different 4-cell minimodules are shown in Figure 1. The minimodules differ on the basis of the module architecture and encapsulant material, which we will refer to as PV minimodule variants. There are two manufacturers in this study, named A and B, but the focus will be on the minimodules manufactured by B. Some of the minimodule variants manufactured by B show greater power loss, and this can help us identify the potential cause of degradation.
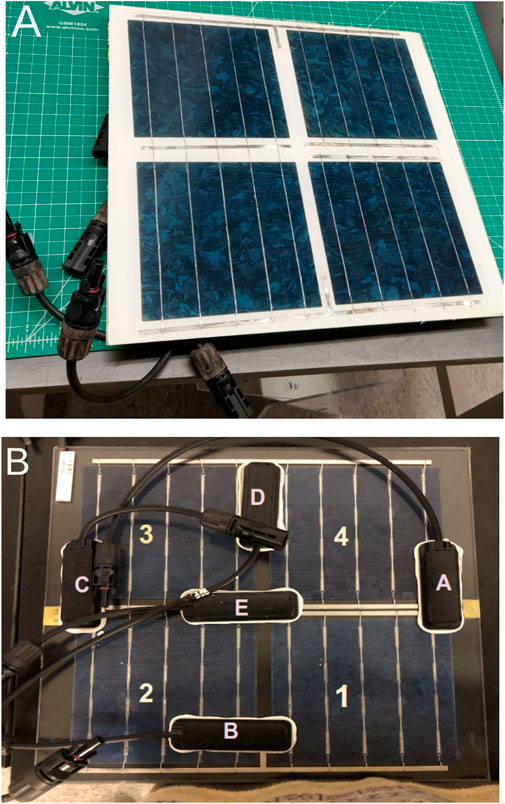
FIGURE 1. Front and rear sides of 4-cell PV minimodules. (A) Front side of GB minimodule. (B) Rear side of DG minimodule with 5 junction boxes.
The two types of module architectures used were double glass (DG) and glass/backsheet (GB). In each DG minimodule, 2.5 mm heat-strengthened front and rear glass were utilized. In each GB minimodule, 3.2 mm tempered front glass was used and the backsheet was KPf, which is composed of polyvinylidene fluoride (PVDF)/polyethylene terephthalate (PET)/fluoropolymer layers.
The encapsulants were ethylene vinyl acetate (EVA) and polyolefin elastomer (POE). In each minimodule, transparent encapsulant was the front encapsulant layer and the rear encapsulant was of the UV-cutoff type. The encapsulant and backsheet materials were supplied by Cybrid Technologies Inc. At the end of fabrication of minimodules, five junction boxes were fixed on each minimodule to enable cell-level measurements and module-level measurements Nalin Venkat (2021). In this work, cell-level measurements were used for statistical and netSEM analysis.
In total, four minimodule variants (DG/GB, EVA/POE) were fabricated in which each variant had two minimodules (4 × 2 = 8 minimodules of all variants). There are two indoor accelerated conditions, namely, modified damp heat (mDH) and modified damp heat with full spectrum light (mDH + FSL). Eight minimodules were exposed in mDH and eight minimodules were exposed in mDH + FSL. In total, sixteen minimodules are considered in this study. The specifications of minimodules are summarized in Table 1. The details of exposure conditions are highlighted in Section 2.2.

TABLE 1. Quantity and specifications (encapsulant type and module architecture) of minimodules by manufacturer B in exposure conditions.
2.2 Indoor accelerated exposure conditions
Damp heat (DH) is frequently used as a standard accelerated test in which the minimodules are exposed to 85°C at 85% relative humidity. Accelerated tests are frequently used as opposed to outdoor exposure as it takes about 20–25 years for natural aging to occur and degradation to manifest in PV modules A Omazic et al. (2019). DH is also a qualification test (pass/fail) on PV modules; however, it does not provide additional insights into the module service lifetime nor their long-term durability Koehl et al. (2017); Wohlgemuth and Kempe (2014).
DH exposure can induce hydrolytic degradation in the PET core layer, which is a crucial component in KPf backsheets. At temperatures above the glass transition temperature (Tg) of PET (Tg = 85°C), there is an increased mobility of the polymer chain backbone which enhances the rate of hydrolysis and leads to loss of properties in PET. At exposure conditions below Tg, the hydrolytic degradation was found to be minor despite humidity as high as 95% Kanuga (2012); Omazic et al. (2019). Hence, taking these concepts into account, the exposure temperature was reduced by 5°C in this study (i.e., the temperature used in the study was 80°C).
The two types of indoor accelerated exposures are modified damp heat (mDH) and modified damp heat with full spectrum light (mDH + FSL). Eight minimodules were exposed in mDH exposure (which is 80°C and 85% relative humidity) and the other Eight minimodules were exposed in mDH + FSL (of intensity 420 Wm−2) as per Table 1. The environmental chamber used in the study was a Cincinnati Sub-Zero SPHS-100. The full spectrum light was generated using Class C solar simulator high-intensity discharge (HID) lamps from Iwasaki Electric (Eye Lighting).
Both the exposures had a total duration of 2520 h (about 3.5 months) and were divided into five exposure steps of 504 h (equivalent to 21 days) each. This enabled us to perform stepwise evaluation on minimodules (discussed in Section 2.3). While the minimodules in mDH conditions had 504 h at each exposure step, the ones in mDH + FSL had 336 h (14 days) of mDH exposure, subsequently followed by 168 h (7 days) of full spectrum light.
2.3 Stepwise electrical evaluation
At the end of every exposure step, stepwise cell-level electrical measurements (current-voltage (I-V) and Suns-Voc) were collected for the minimodules in both exposure conditions. Spi-Sun Simulator 4600SLP was used for taking I-V measurements. The Suns-Voc instrument used in the study was manufactured by Sinton Instruments.
I-V curves are useful in understanding the current and voltage at which the PV modules can be operated at fixed irradiance and temperature. The electrical features generated from I-V measurements provide information about losses and degradation modes in PV modules Ma et al. (2019); van Dyk Meyer (2004); van Dyk et al. (2005). Suns-Voc is a technique in which the open-circuit voltage varies with changing illumination. It gives information about recombination losses and the presence of shunts Hossain et al. (2019).
The electrical evaluations were performed every 504 h (21 days) for stepwise measurements. Baseline measurements were taken for all the minimodules before the start of exposure.
2.4 Data processing
ddiv R package (version 0.1.1) Huang et al. (2021) was used to extract the electrical features from I-V and Suns-Voc data. Because of the inconsistent quality of the junction boxes, not all the cell-level measurements could be obtained. To avoid bias in the analysis, missing observations were handled by mean imputation Jakobsen et al. (2017). Mean imputation involves substituting the mean of the cell measurements in place of the missing data point. When the imputed values were found to be identical for two missing cell measurements, normally distributed values by using mean and standard deviation were obtained using the qnorm() function in R Nalin Venkat (2021). Due to the control in manufacturing and consistency of input materials in PERC cell fabrication, we assume that there is no major distinction among as-fabricated solar cells.
Once the values were imputed, the electrical features used in the study were normalized (i.e., cell-level electrical measurements were divided by their respective baseline values at exposure step 0) in order to reduce the noise in the data. The variables were chosen based on domain knowledge and involves selecting electrical features that track possible degradation modes. A detailed overview of variable selection is included in Section 3.1. After variable selection, netSEM R package (version 0.7.0) was used to construct models and obtain equations for pairwise relations Huang et al. (2018).
2.5 Network structural equation modeling (netSEM)
netSEM is a statistical approach to perform pathway network analysis in a system composed of continuous variables Bruckman et al. (2013b). Prior applications of netSEM have been successfully demonstrated in polymer studies Bruckman et al. (2013a); Yang et al. (2019). In this work, netSEM is applied to PV minimodules.
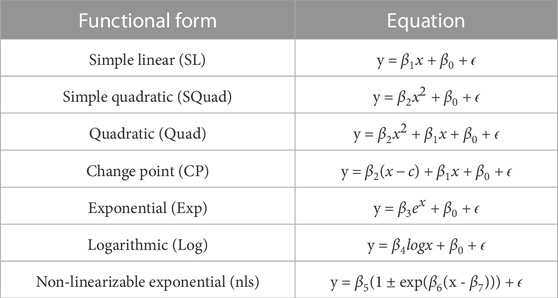
netSEM allows the incorporation of non-linear relationships between the variables, as opposed to SEM, which allows only linear relationships. Seven functions are available in the netSEM package: simple linear, quadratic, simple quadratic, change point, exponential, logarithmic and non-linearizable exponential (shown in Table 2) Nalin Venkat (2021).
In this study, the steps involved in obtaining netSEM results are illustrated in Figure 2. Feature selection (or commonly referred to as variable selection) is performed by using concepts from domain knowledge; even before collecting the data, knowledge of the variables obtained from various measurement techniques is crucial. This is discussed in Section 3.1. The data are acquired from two electrical measurement techniques, namely, I-V and Suns-Voc, as discussed in Section 2.3. After that, mean imputation is done to handle missing observations (highlighted in Section 2.4). Once the data is processed, the netSEM R package is used to obtain pairwise relationships and multiple regression equations.
In netSEM, the selection of the best models and the statistical significance of relationships can be retrieved using p-values and
In netSEM, Markovian model and multiple regression model are utilized for variable selection and to rank their contribution to the response. The Markovian model Faraway (2004), considers only a pair of variables while the others are kept constant. The multiple regression model utilizes multiple regression to consider the simultaneous impact of variables on each other. Bruckman et al. (2013b). Both of the models are used to obtain results (refer to Section 3).
3 Results
This section presents an overview of the netSEM results for the minimodule variants used in this work. Before obtaining netSEM results, variable selection was done (Section 3.1), followed by the construction of 83.4 and 95% confidence intervals using data from the end of the exposure cycle (shown in Section 3.2). The selected stressor (S), mechanistic variables (Mi), and response (R) from the variable selection process were used in building netSEM
3.1 Variable selection
Before constructing the netSEM models, variable selection was performed based on domain knowledge of PV module degradation. Exposure time was converted into decimal year and used as the stressor (S); here, decimal year means that the numerical value is not an integer but rather has a decimal value (for instance, 0.2 is a decimal year).
The mechanistic variables were selected in a way that they can track degradation mechanisms occurring in the minimodules. From prior studies, a decrease in short circuit current (Isc) from I-V measurements has been attributed to changes in optical transmittance of encapsulants/glass, p-n junction degradation, and/or soiling Ahmad et al. (2019); Luo et al. (2019). Since there is no possibility of soiling/accumulation of dust in environmental chambers and because all the cells from the same batch were made at the same time, it is assumed that the decrease in Isc is most likely related to optical transmission loss. An increase in series resistance (Rs) from I-V measurements has been known for negatively impacting solder joints, interconnects, resistance in junction box connections and emitter/base regions of the cell, and/or cell metallization, causing increased corrosion van Dyk et al. (2005); van Dyk and Meyer (2004); Meyer and van Dyk (2004). Suns-Voc features provide information about the recombination losses and presence of shunts Kerr et al. (2001); Hossain et al. (2019). For this reason, voltage at maximum power (Vmp) obtained from Suns-Voc has been considered to track both recombination and shunting in minimodules.
In this work, the mechanistic variables and response have been normalized to reduce noise. The normalized mechanistic variables (Mi) are nIsc,IV (short-circuit current), nRs,IV (series resistance), and nVmp,PIV (voltage at maximum power). Maximum power from I-V measurements (nPmp,IV) is used as the response (R). The superscript “n” denotes normalized values for the variable and the subscripts, “IV” and “PIV”, refer to whether the variable is extracted from I-V or Suns-Voc, respectively.
3.2 Confidence intervals at the end of exposure cycle
Confidence intervals of 83.4% and 95% were obtained for minimodule variants by manufacturer B at the end of exposure cycle (i.e., at exposure step 5). The minimodule variants underwent exposure for 2520 h in either mDH or mDH + FSL, marking the end of exposure cycle. For constructing each of the CIs, 8 cell measurements from two minimodules for each variant were used; this reduces the standard error by a factor of
Figure 2 shows the confidence intervals at the end of exposure for GB minimodules fabricated by manufacturer B. The CIs are categorized on the basis of architecture (GB/DG) and exposure type (mDH/mDH + FSL) for easier comparison. A normalized value of one means that there is no change. As per inference by eye conditions, overlapping CIs indicate that the variants behave similarly without significant differences Cumming and Finch (2005). From Section 1, 83.4% CIs help identify if two minimodule variants are similar/different in behavior and 95% CIs are useful in determining if a minimodule variant is durable/degrading.
From Figure 3A with nPmp,IV at the end of exposure, it can be seen that there is no significant impact of encapsulant type (i.e., 83.4% CIs overlap in each of the architecture/exposure type categories). However, between categories, it can be seen that EVA-based minimodules (GB in mDH and mDH + FSL exposures) are significantly different from DG in mDH + FSL exposure. In the case of other minimodule categories, they seem to be similar to each other due to overlapping 83.4% CIs. In the case of 95% CIs, GB minimodules are seen to be experiencing greater power loss. This observation is made, based on their interquartile ranges and estimated means. The estimated means for the GB minimodules indicate that the power loss is, on average, about 5%–6%. DG minimodules in mDH exposure seem to be exhibiting different trends with encapsulant type, as the ones with EVA have more power loss than those with the POE type. However, the CIs for DG minimodules in mDH exposure are relatively wider, making it less certain to quantify degradation.
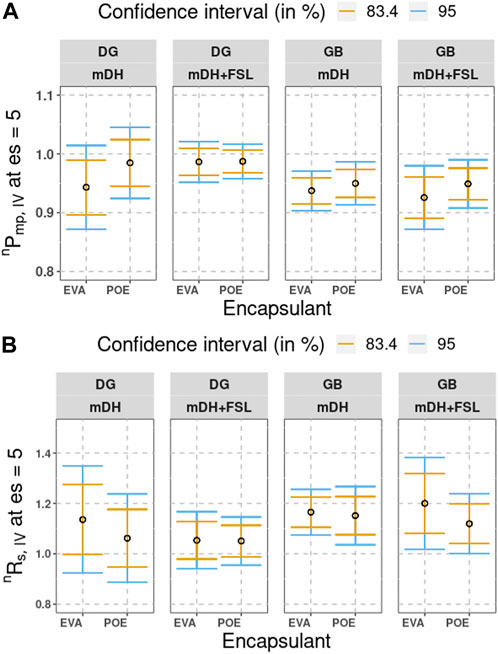
FIGURE 3. Confidence intervals of 83.4% (orange) and 95% (blue) at the end of exposure for minimodules fabricated by manufacturer B. The hollow black circles represent the estimated means. Each CI for each minimodule variant makes use of 8 cell-level measurements to improve the statistical signficance of the results. (A) nPmp,IV. (B) nRs,IV.
Figure 3B shows an increase in the nRs,IV and an increase from the baseline normalized value of 1 at the end of exposure cycle. From 83.4% CIs, there is significant overlap between different encapsulant types in each exposure. However, from 95% CIs, we see that most GB-based minimodules have increased nRs,IV (with the exception of GB with POE in mDH + FSL exposure). Most DG minimodules seem to be experiencing lesser corrosion in comparison to the GB counterparts (with the exception of DG with EVA in mDH exposure). Please note that the exceptions are highlighted to indicate that there are relatively wider CIs that affect certainty of the results.
We have inspected other mechanistic variables, namely, nIsc,IV and nVmp,PIV. Since these normalized variables vary within a small range of 0.98–1, we think that they do not contribute to power loss as much as nRs,IV does. The results of other mechanistic variables are included in the supplementary information.
3.3
Figure 4 and Figure 5 show the
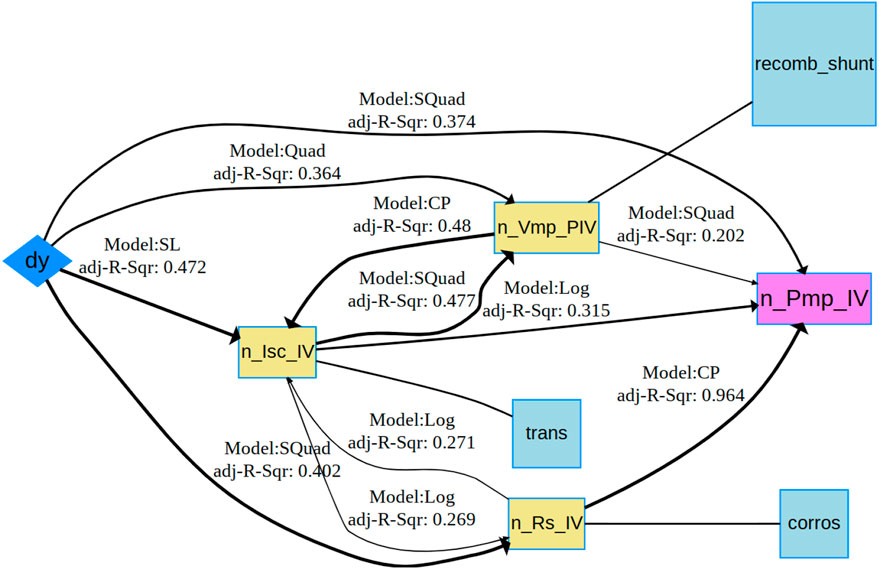
FIGURE 4.
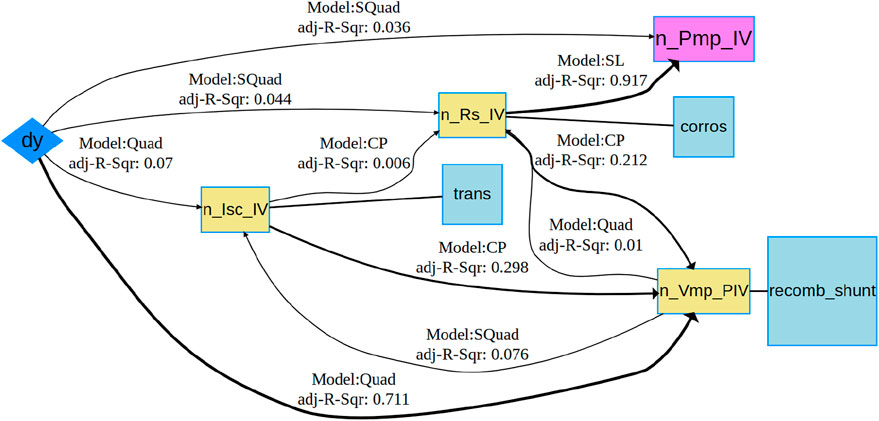
FIGURE 5.
Figure 4 shows the
Figure 5 shows the
Between these two
3.4
The pairwise relations showing best fitting models from
Figure 6 shows the
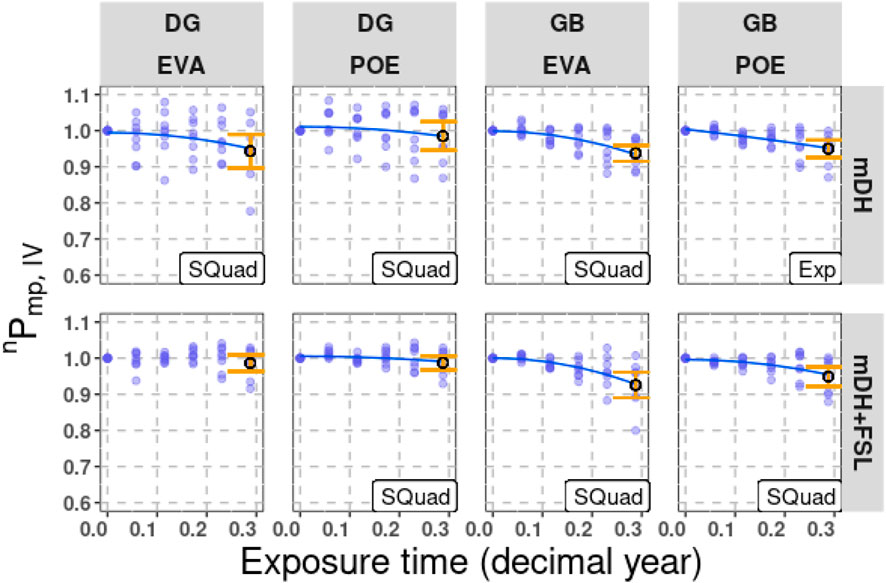
FIGURE 6. Variation of nPmp,IV with dy manufactured by B. The best model equation line and name in text, data points and 83.4% CIs (orange) at the end of exposure cycle are shown.
The causes of power loss in GB minimodules can be better understood by investigating
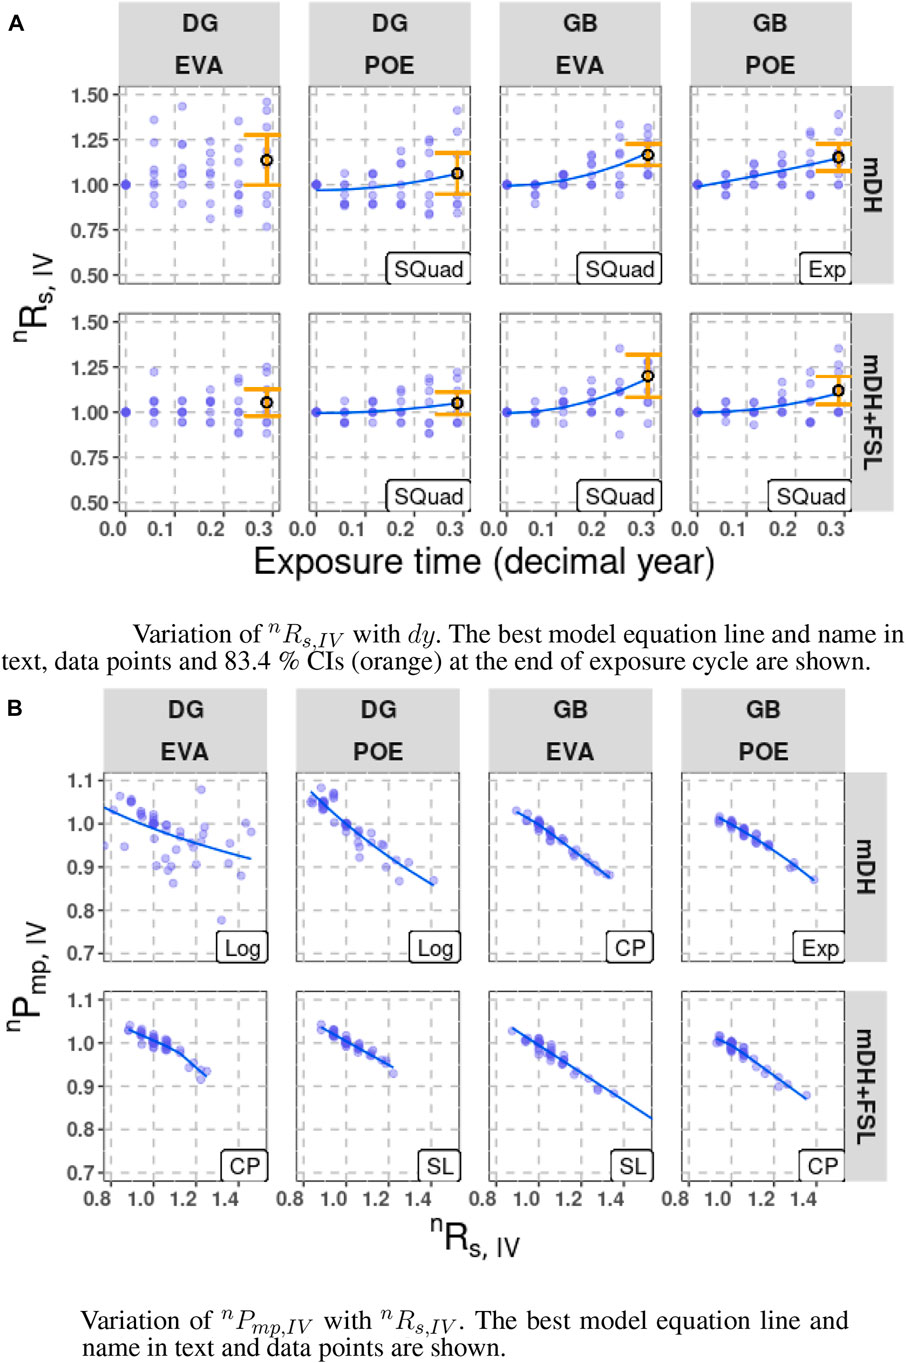
FIGURE 7.
3.5 Power loss due to mechanisms using markovian model
In the netSEM package, it is possible to obtain mathematical equations of the best model fit between two variables (bestModel) as well as other statistical measures such as
Considering the minimodule variant GB with EVA in mDH exposure fabricated by manufacturer B, we get the following set of equations by substituting
Here, n
Figure 8 shows the power loss due to individual mechanistic variables (i.e.,
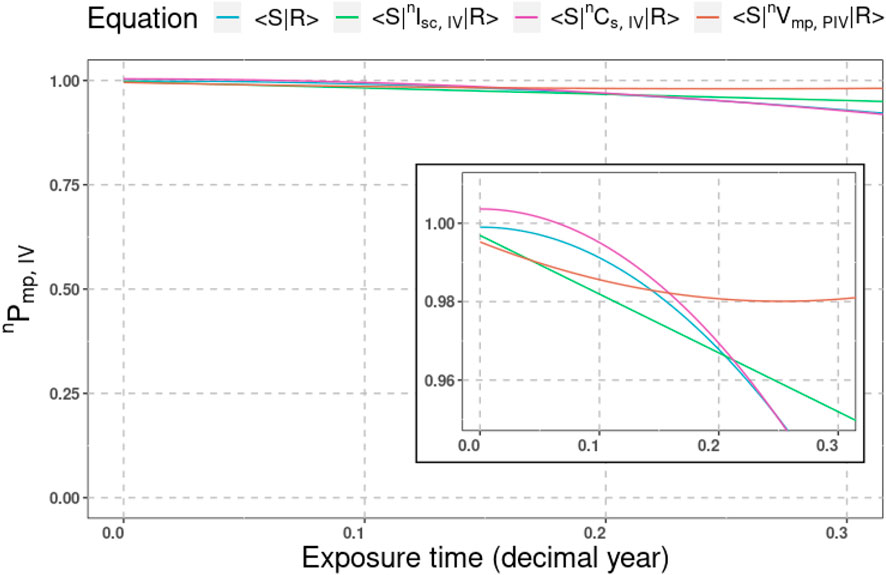
FIGURE 8. Power loss due to mechanisms: GB with EVA by manufacturer B in mDH. Each of the lines correspond to the power loss caused by each mechanistic variable compared to the total power loss. The equations were obtained using Markovian model.
3.6 Multiple regression results
We have been able to explore the trends between variables in a pairwise manner while keeping the rest of the variables constant in the previous sections. This approach, however, does not capture the complexity of degradation. In the real world, PV module degradation is a phenomenon in which multiple stressors and degradation modes act simultaneously. The multiple regression model has the ability to perform multiple regressions by considering several predictors. Each variable is regressed on the remaining variables except the response, and using stepAIC(), the most parsimonious model equation is selected on the basis of Principle 1 best models Huang et al. (2018). For example, this means that dy and Mi simultaneously impact nPmp,IV.
Figure 9 shows the
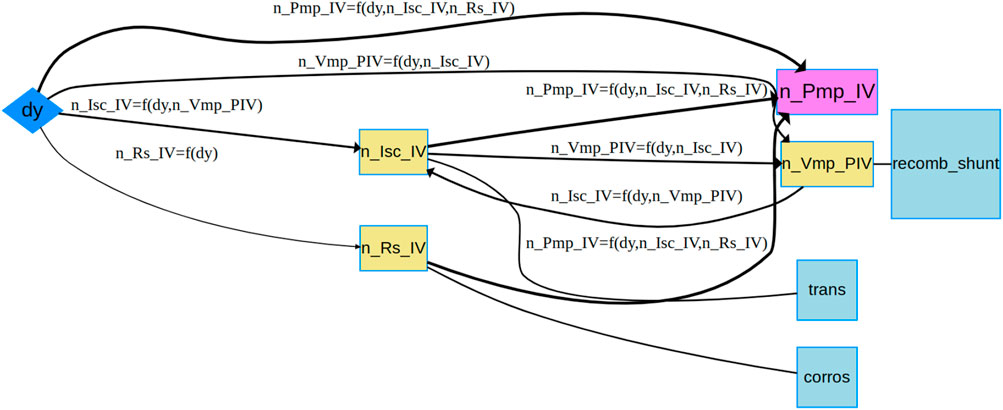
FIGURE 9.
The
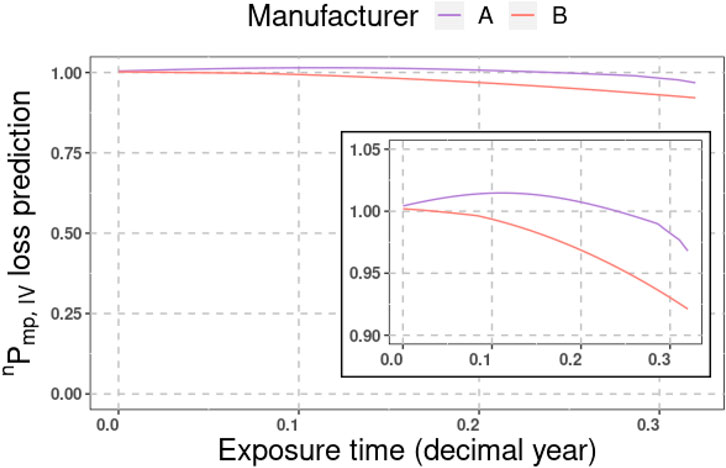
The importance of multiple regression model lies in its capability of service lifetime prediction (SLP) by considering the influence of multiple mechanistic variables and stressor. Using multiple regression, we obtain equations including nPmp,IV as a function of Mi and dy, as well as equations for each Mi as a function of the rest of Mi and dy. Most often those multivariable equations are implicit and we use Newton/Broyden’s method to find the numerical solutions, determining how nPmp,IV and Mis change over dy. In this part, we have performed the SLP for a single variant fabricated by two different manufacturers: A and B. From Figure 10, we see the service lifetime prediction plot in which the minimodule variant, GB with EVA, in mDH is compared on the basis of manufacturer (A versus B). We are able to see that the variant by manufacturer B undergoes greater power loss than that of manufacturer A. In addition, we are able to see that the highest contribution is from nCs,IV, as it closely follows the nPmp,IV plot from Figure 11.
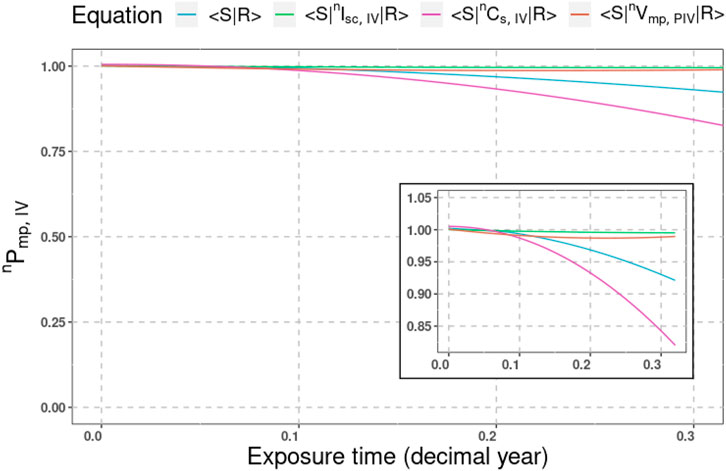
FIGURE 11. Contributions of mechanistic variables compared against total power loss with year (dy) for GB with EVA in mDH by manufacturer B using multiple regression model.
Eq. 3 provides the general form of multiple regression for degradation in GB with EVA in mDH fabricated by both manufacturers A and B. Table 3 shows the corresponding change points and coefficient values. By comparing each coefficient between the minimodules by two different manufacturers, we can quantify differences in the degradation behavior using the value in Eq. 3, as shown in Table 3. The γdy,1, γdy,2, and

TABLE 3. Equations obtained from multiple regression model for GB with EVA in mDH for manufacturers A and B.
4 Discussion
This section highlights the advantages of netSEM as a generalized data-driven analysis tool and its importance in developing a study protocol. Observations from this study are also compared with that of prior literature. In addition, Markovian model and multiple regression model results are compared for concurrence and the role of corrosion in minimodule degradation is briefly discussed.
4.1 Comparison of this work with other degradation models
With an extensive study protocol, statistical analysis using CIs coupled with data-driven netSEM modeling gives insights into the degradation behavior of minimodule variants. This is a novel approach to thoroughly explore the pairwise relationships between variables using Markovian model as well as the simultaneous impact of multiple variables at the same time.
Degradation of PV modules reported in prior literature has assumed a degradation rate model, that is, defined based on specific module or exposure conditions. For instance, in the study by Theristis et al. (2022) degradation rates for fielded modules were defined on the basis of nameplate ratings and from post-stabilization flash test. In other cases, degradation rate models have been proposed for specific degradation mechanisms or processes in which model parameters are variable Lindig et al. (2018). In either of these cases, the proposed degradation rate models are applicable only for particular cases and are restricted by the assumptions. PV reliability models have been constructed to understand the trend of power degradation; it has been commonly observed that power loss is non-linear. To capture the non-linearity of power loss, many regression-based models have been proposed; however, they are only applicable to specific sample types and external conditions, and cannot be generalized Kaaya et al. (2021); Lindig et al. (2018).
netSEM overcomes issues that are present in these contemporary models. No inherent assumptions are made in netSEM data-driven modeling allowing it to be applicable to any system with a well-defined stressor, mechanistic variables, and response framework. Another advantage of netSEM is that we can compare parallel and/or competing degradation pathways as well as their impact on power loss, which is yet to be demonstrated by traditional PV modeling techniques. By coupling netSEM with statistical analysis using CIs, the results are not just observations but are statistically significant at the 5% level.
4.2 Current findings and relation to prior literature
A subtle but important observation emerges from the results discussed in Section 3; the encapsulants do not seem to experience drastic degradation in either mDH or mDH + FSL, indicating that there is no over-acceleration of degradation modes Nalin Venkat (2021).
Many studies in literature implement DH as the predominant indoor exposure condition. In a study by Park et al. (2021) DH test (for 5500 h) was performed on p-PERC GB modules with EVA; an increase in fill factor and series resistance was observed due to corrosion of metal electrodes by moisture ingress. In the same study, DH with temperature cycling (DH5000/TC600) revealed that POE showed better durability than EVA. In both the cases, the power loss followed a change point trend and the series resistance increased faster for EVA module than the POE one Park et al. (2021). In another work by Oreski et al. (2020) upon 3000 h of DH exposure, only EVA-based modules were seen to have corrosion at the silver grid as well as above the ribbons; modules with POE displayed no corrosive effects. DH exposure has been debated as an aggressive exposure condition in other studies; ranging from over-acceleration of PET layer to 2x higher degradation level in outdoor conditions Kanuga (2012); Yang et al. (2019); Hülsmann and Weiss (2015); Kempe and Wohlgemuth (2013). Using mDH with/without FSL does not lead to extreme degradation as evidenced in our study. Cross-correlation of degradation in minimodules exposed in indoor accelerated conditions (mDH with/without FSL) and outdoor conditions will be part of our future work.
The differences in degradation among minimodule variants is primarily due to the module architecture. Although module architectures do not play an active role in power generation, they can lead to issues in long-term performance Aghaei et al. (2022).
In this study, on average, GB minimodules undergo greater power loss in comparison to DG minimodules. GB minimodules were observed to experience a greater power loss primarly due to corrosion. Most of the DG variants were observed to be stable in both mDH and mDH + FSL exposures. In a study by Karas et al. (2020) involving packaged silicon heterojunction cells, corrosion in GB modules with EVA encapsulation was found to be higher than DG counterparts in DH exposure due to higher moisture penetration; GB modules with POE were found to undergo lower degradation in comparison Sinha et al. (2021). Even though our study does not consider packaged c-Si cells in particular, moisture ingress could be a possible explanation to why GB minimodules experience more power loss in our study. Moisture ingress is known to be initiated from edges of modules Poulek et al. (2021); Park et al. (2021). In another independent study by Kumar et al. (2022) GB minimodules with EVA were seen to have increased series resistance at high humidity levels. In a netSEM analysis done for EVA-based minimodules under DH conditions, hydrolysis of EVA was seen to be a dominant degradation pathway Wheeler (2017); Yang et al. (2019). Further investigation needs to be performed to validate the aforementioned claim in our study. In the scientific community, there is an ongoing discourse about which module architecture is better Aghaei et al. (2022); therefore, we cannot make a generalized claim that DG is better than GB. Furthermore, since POE is a relatively new material in the PV industry, its performance in long-term exposure has not been explored yet especially in real-world conditions. Considering the conditions, duration of the exposure, and the obtained results, we cannot make firm conclusions that one type of module architecture/encapsulant is better than the other.
4.3 Comparison between results from markovian model and multiple regression model
The results from Markovian model and multiple regression model are observed to be fairly consistent. Higher power loss in GB minimodules due to corrosion are supported by both Markovian model and multiple regression model results. We considered series conductance for ease of comparison between different mechanistic variables).
From multiple regression analysis, we observed that the degradation is heavily impacted by the difference in manufacturer for the same minimodule variant, highlighting the importance of quality control in the experimental and fabrication process. Lamination process plays an important role in the quality, reliability, and longevity of PV modules as validated from previous studies Davis et al. (2016); Schneller et al. (2016); Aghaei et al. (2022). In order to increase the lifetime and the overall performance of PV modules, it is of utmost necessity to control the fabrication process (including but not limited to soldering and lamination) to manufacture PV modules of high quality.
5 Conclusion
In this work, the application of netSEM R package and statistical analysis have been demonstrated by using stepwise measurement data of indoor-exposed minimodule variants. A comprehensive overview of the study protocol comprising of fabrication, exposure types, and characterization techniques, as well as the steps involved in obtaining data to eventually use the netSEM R package has been provided. Using domain knowledge regarding PV module degradation and statistics, CIs and netSEM models were constructed. By utilizing Markovian model and multiple regression, durable/degrading variants were identified.
As part of our future work, we are developing an automated analysis pipeline for analyzing minimodule variants using multiple regression and rank-ordering them on the basis of their degradation behavior.
Data availability statement
The original contributions presented in the study are publicly available. This data can be found on OSF open data platform: https://osf.io/FYG6E/.
Author contributions
RF and LB led this research study and procured funding for accomplishing the work. SV, XY, JL, RF, and LB helped in conceptualization of the work. SV and JL were responsible for data curation and organization. SV, XY, and JW performed statistical and data-driven analyses essential for the study. SV, XY, JL, JW, JJ, EB, HA, RF, and LB helped in the original draft preparation. HA released the new version of the netSEM package which was implemented in the work. XL and J-NJ provided materials and resources required for fabrication of minimodules. All the authors contributed to manuscript review and editing in the later stages as well as approved the submitted version.
Funding
This material is based upon work supported by the United States Department of Energy’s Office of Energy Efficiency and Renewable Energy (EERE) under Solar Energy Technologies Office (SETO) Agreement Number DE-EE-0008550. The views expressed herein do not necessarily represent the views of the United States Department of Energy or the United States Government.
Acknowledgments
This work made use of the High Performance Computing Resource in the Core Facility for Advanced Research Computing at Case Western Reserve University. The authors are grateful for the support received from the U.S. Department of Energy and research collaborators. Additionally, the authors would also like to thank Dr. Alan Curran, Raymond Wieser, and Brian Gould for assisting in the fabrication procedure and stepwise electrical measurements.
Conflict of interest
Author XL was employed by the company Cybrid Technologies Inc. J-NJ was employed by the company CSI Solar Co., Ltd.
The remaining authors declare that the research was conducted in the absence of any commercial or financial relationships that could be construed as a potential conflict of interest.
Publisher’s note
All claims expressed in this article are solely those of the authors and do not necessarily represent those of their affiliated organizations, or those of the publisher, the editors and the reviewers. Any product that may be evaluated in this article, or claim that may be made by its manufacturer, is not guaranteed or endorsed by the publisher.
References
Aghaei, M., Fairbrother, A., Gok, A., Ahmad, S., Kazim, S., Lobato, K., et al. (2022). Review of degradation and failure phenomena in photovoltaic modules. Renew. Sustain. Energy Rev. 159, 112160. doi:10.1016/j.rser.2022.112160
Ahmad, J., Ciocia, A., Fichera, S., Murtaza, A. F., and Spertino, F. (2019). Detection of typical defects in silicon photovoltaic modules and application for plants with distributed MPPT configuration. Energies 12, 4547. doi:10.3390/en12234547
Bala Subramaniyan, A., Pan, R., Joseph, K., and Tamizh Mani, G. (2018). Quantification of environmental effects on PV module degradation: A physics-based data-driven modeling method. IEEE J. Photovoltaics 8, 1289–1296. doi:10.1109/JPHOTOV.2018.2850527
Barde, M. P., and Barde, P. J. (2012). What to use to express the variability of data: Standard deviation or standard error of mean? Perspect. Clin. Res. 3, 113. doi:10.4103/2229-3485.100662
Brebu, M. (2020). Environmental degradation of plastic composites with natural fillers—a review. Polymers 12, 166. doi:10.3390/polym12010166
Bruckman, L. S., Wheeler, N. R., Kidd, I. V., Sun, J., and French, R. H. (2013a). “Photovoltaic lifetime and degradation science statistical pathway development: Acrylic degradation,” in Reliability of photovoltaic cells, modules, components, and systems VI (Bellingham, Washington USA: International Society for Optics and Photonics), 8825, 88250D. doi:10.1117/12.2024717
Bruckman, L. S., Wheeler, N. R., Ma, J., Wang, E., Wang, C. K., Chou, I., et al. (2013b). Statistical and domain analytics applied to PV module lifetime and degradation science. IEEE Access 1, 384–403. doi:10.1109/ACCESS.2013.2267611
Cole, W. J., Frew, B. A., Gagnon, P. J., Richards, J., Sun, Y., Margolis, R. M., et al. (2017). SunShot 2030 for photovoltaics (PV): Envisioning a low-cost PV future. Golden, CO (United States): National Renewable Energy Lab. Tech. Rep. NREL/TP-6A20-68105. doi:10.2172/1392206
Cumming, G., and Finch, S. (2005). Inference by eye: Confidence intervals and how to read pictures of data. Am. Psychol. 60, 170–180. doi:10.1037/0003-066X.60.2.170
Davis, K. O., Rodgers, M. P., Scardera, G., Brooker, R. P., Seigneur, H., Mohajeri, N., et al. (2016). Manufacturing metrology for c-Si module reliability and durability Part II: Cell manufacturing. Renew. Sustain. Energy Rev. 59, 225–252. doi:10.1016/j.rser.2015.12.217
de Oliveira, M. C. C., Diniz Cardoso, A. S. A., Machado Viana, M., and Lins, V. F. C. (2018). The causes and effects of degradation of encapsulant ethylene vinyl acetate copolymer (EVA) in crystalline silicon photovoltaic modules: A review. Renew. Sustain. Energy Rev. 81, 2299–2317. doi:10.1016/j.rser.2017.06.039
Escobar, L. A., and Meeker, W. Q. (2006). A review of accelerated test models. Stat. Sci. 21, 552–577. doi:10.1214/088342306000000321
Gok, A., Fagerholm, C. L., French, R. H., and Bruckman, L. S. (2019a). Temporal evolution and pathway models of poly(ethylene-terephthalate) degradation under multi-factor accelerated weathering exposures. PLOS ONE 14, e0212258. doi:10.1371/journal.pone.0212258
Gok, A., Gordon, D. A., Wang, M., French, R. H., and Bruckman, L. S. (2019b). “3 - degradation science and pathways in PV systems,” in Durability and reliability of polymers and other materials in photovoltaic modules. Editors H. E. Yang, R. H. French, and L. S. Bruckman (Norwich, NY.: William Andrew Publishing), 47–93. Plastics Design Library. doi:10.1016/B978-0-12-811545-9.00003-3
Hihara, L. H., Adler, R. P. I., and Latanision, R. M. (2013). Environmental degradation of advanced and traditional engineering materials. Boca Raton, Florida, United States: CRC Press.
Hossain, M., Gregory, G., John Schneller, E., Gabor, A. M., Blum, A. L., Yang, Z., et al. (2019). A comprehensive methodology to evaluate losses and process variations in silicon solar cell manufacturing. IEEE J. Photovoltaics 9, 1350–1359. doi:10.1109/JPHOTOV.2019.2926628
Huang, W.-H., Wheeler, N., Klinke, A., Xu, Y., Du, W., Verma, A. K., et al. (2018). netSEM: Network structural equation modeling.
Huang, W. H., Ma, X., Liu, J., Wang, M., Curran, A. J., Fada, J. S., et al. (2021). Ddiv: Data driven I-V feature extraction. The Comprehensive R Archive Network.
Hülsmann, P., and Weiss, K.-A. (2015). Simulation of water ingress into PV-modules: IEC-testing versus outdoor exposure. Sol. Energy 115, 347–353. doi:10.1016/j.solener.2015.03.007
Jäger-Waldau, A. (2022). “Snapshot of photovoltaics – february 2022,” in EPJ photovoltaics (Les Ulis, France: EDP Sciences), 13, 9. doi:10.1051/epjpv/2022010
Jakobsen, J. C., Gluud, C., Wetterslev, J., and Winkel, P. (2017). When and how should multiple imputation be used for handling missing data in randomised clinical trials – A practical guide with flowcharts. BMC Med. Res. Methodol. 17, 162. doi:10.1186/s12874-017-0442-1
Kaaya, I., Ascencio-Vásquez, J., Weiss, K.-A., and Topič, M. (2021). Assessment of uncertainties and variations in PV modules degradation rates and lifetime predictions using physical models. Sol. Energy 218, 354–367. doi:10.1016/j.solener.2021.01.071
Kanuga, K. (2012). “Degradation of polyester film exposed to accelerated indoor damp heat aging,” in 2011 37th IEEE Photovoltaic Specialists Conference, Seattle, WA, USA, 19-24 June 2011, 96–100. doi:10.1109/PVSC.2011.6185853
Karas, J., Sinha, A., Buddha, V. S. P., Li, F., Moghadam, F., TamizhMani, G., et al. (2020). Damp heat induced degradation of silicon heterojunction solar cells with Cu-plated contacts. IEEE J. Photovoltaics 10, 153–158. doi:10.1109/JPHOTOV.2019.2941693
Kempe, M. D., Jorgensen, G. J., Terwilliger, K. M., McMahon, T. J., Kennedy, C. E., and Borek, T. T. (2007). Acetic acid production and glass transition concerns with ethylene-vinyl acetate used in photovoltaic devices. Sol. Energy Mater. Sol. Cells 91, 315–329. doi:10.1016/j.solmat.2006.10.009
Kempe, M. D., and Wohlgemuth, J. H. (2013). “Evaluation of temperature and humidity on PV module component degradation,” in 2013 IEEE 39th Photovoltaic Specialists Conference (PVSC), Tampa, FL, USA, 16-21 June 2013, 0120–0125. doi:10.1109/PVSC.2013.6744112
Kerr, M. J., Cuevas, A., and Sinton, R. A. (2001). Generalized analysis of quasi-steady-state and transient decay open circuit voltage measurements. J. Appl. Phys. 91, 399. doi:10.1063/1.1416134
Knol, M. J., Pestman, W. R., and Grobbee, D. E. (2011). The (mis)use of overlap of confidence intervals to assess effect modification. Eur. J. Epidemiol. 26, 253–254. doi:10.1007/s10654-011-9563-8
Koehl, M., Hoffmann, S., and Wiesmeier, S. (2017). Evaluation of damp-heat testing of photovoltaic modules. Prog. Photovoltaics Res. Appl. 25, 175–183. doi:10.1002/pip.2842
Kumar, R. E., Von Gastrow, G., Theut, N., Jeffries, A. M., Sidawi, T., Ha, A., et al. (2022). Glass vs. Backsheet: Deconvoluting the role of moisture in power loss in silicon photovoltaics with correlated imaging during accelerated testing. IEEE J. Photovoltaics 12, 285–292. doi:10.1109/JPHOTOV.2021.3122878
Lindig, S., Ismail, K., Weiß, K. A., Moser, D., and Topic, M. (2018). Review of statistical and analytical degradation models for photovoltaic modules and systems as well as related improvements. IEEE J. Photovoltaics 8, 1773–1786. doi:10.1109/JPHOTOV.2018.2870532
Luo, W., Sheng Khoo, Y., Peter, H., Jordan, D., Zhao, L., Ramakrishna, S., et al. (2019). Analysis of the long-term performance degradation of crystalline silicon photovoltaic modules in tropical climates. IEEE J. Photovoltaics 9, 266–271. doi:10.1109/JPHOTOV.2018.2877007
Ma, X., Huang, W. H., Schnabel, E., Köhl, M., Brynjarsdóttir, J., Braid, J. L., et al. (2019). Data-driven $I$–$V$ feature extraction for photovoltaic modules. J. Photovoltaics 9, 1405–1412. doi:10.1109/JPHOTOV.2019.2928477
Masson, G., and Kaizuka, I. (2020). Trends in PV applications 2020. Berlin, Germany: Springer. Tech. rep., IEA-PVPS.
Meyer, E. L., and van Dyk, E. E. (2004). Assessing the reliability and degradation of photovoltaic module performance parameters. IEEE Trans. Reliab. 53, 83–92. doi:10.1109/TR.2004.824831
Nalin Venkat, S. (2021). Network structural equation modeling of PV minimodule variants under indoor accelerated exposures. MS thesis. Cleveland, United States: Case Western Reserve University.
Odegard, G. M., and Bandyopadhyay, A. (2011). Physical aging of epoxy polymers and their composites. J. Polym. Sci. Part B Polym. Phys. 49, 1695–1716. doi:10.1002/polb.22384
Omazic, A., Oreski, G., Halwachs, M., Eder, G. C., Hirschl, C., Neumaier, L., et al. (2019). Relation between degradation of polymeric components in crystalline silicon PV module and climatic conditions: A literature review. Sol. Energy Mater. Sol. Cells 192, 123–133. doi:10.1016/j.solmat.2018.12.027
Oreski, G., Omazic, A., Eder, G. C., Voronko, Y., Neumaier, L., Mühleisen, W., et al. (2020). Properties and degradation behaviour of polyolefin encapsulants for photovoltaic modules. Prog. Photovoltaics Res. Appl. 28, 1277–1288. doi:10.1002/pip.3323
Park, H., So, W., and Kim, W. K. (2021). Performance evaluation of photovoltaic modules by combined damp heat and temperature cycle test. Energies 14, 3328. doi:10.3390/en14113328
Poulek, V., Šafránková, J., Černá, L., Libra, M., Beránek, V., Finsterle, T., et al. (2021). PV panel and PV inverter damages caused by combination of edge delamination, water penetration, and high string voltage in moderate climate. IEEE J. Photovoltaics 11, 561–565. doi:10.1109/JPHOTOV.2021.3050984
Radouane, K., Van Iseghem, M., Duchayne, C., and Braisaz, B. (2014). “PV aging model applied to several meteorological conditions,” in 29th European Photovoltaic Solar Energy Conference and Exhibition, Amsterdam, The Netherlands, 22–26 September 2014, 2303–2309. doi:10.4229/EUPVSEC20142014-5CO.5.4
Schneller, E. J., Brooker, R. P., Shiradkar, N. S., Rodgers, M. P., Dhere, N. G., Davis, K. O., et al. (2016). Manufacturing metrology for c-Si module reliability and durability Part III: Module manufacturing. Renew. Sustain. Energy Rev. 59, 992–1016. doi:10.1016/j.rser.2015.12.215
Sinha, A., Sulas-Kern, D. B., Owen-Bellini, M., Spinella, L., Uličná, S., Pelaez, S. A., et al. (2021). Glass/glass photovoltaic module reliability and degradation: A review. J. Phys. D Appl. Phys. 54, 413002. doi:10.1088/1361-6463/ac1462
Theristis, M., Stein, J. S., Deline, C., Jordan, D., Robinson, C., Sekulic, W., et al. (2022). Onymous early?life performance degradation analysis of recent photovoltaic module technologies. Prog. Photovoltaics Res. Appl. 31, 149–160. doi:10.1002/pip.3615
Ullman, J. B., and Bentler, P. M. (2012). “Structural equation modeling,” in Handbook of psychology. Second Edition (Hoboken, New Jersey: John Wiley & Sons), 661. chap. 23. doi:10.1002/9781118133880.hop202023
van Dyk, E. E., Gxasheka, A. R., and Meyer, E. L. (2005). Monitoring current–voltage characteristics and energy output of silicon photovoltaic modules. Renew. Energy 30, 399–411. doi:10.1016/j.renene.2004.04.016
van Dyk, E. E., and Meyer, E. L. (2004). Analysis of the effect of parasitic resistances on the performance of photovoltaic modules. Renew. Energy 29, 333–344. doi:10.1016/S0960-1481(03)00250-7
Wheeler, N. (2017). Lifetime and degradation science of polymeric encapsulant in photovoltaic systems: Investigating the role of ethylene vinyl acetate in photovoltaic module performance loss with semi-gSEM analytics. Ph.D Thesis. Cleveland, United States: Case Western Reserve University.
Wohlgemuth, J. H., and Kempe, Ml D. (2014). “Equating damp heat testing with field failures of PV modules,” in 2013 IEEE 39th Photovoltaic Specialists Conference (PVSC), Tampa, FL, USA, 16-21 June 2013, 1–6. doi:10.1109/PVSC.2013.6744113
Keywords: degradation, photovoltaics, pathway modeling, network structural equation modeling, electrical measurements, power loss, degradation modes, statistics
Citation: Nalin Venkat S, Yu X, Liu J, Wegmueller J, Jimenez JC, Barcelos EI, Aung HH, Li X, Jaubert J-N, French RH and Bruckman LS (2023) Statistical analysis and degradation pathway modeling of photovoltaic minimodules with varied packaging strategies. Front. Energy Res. 11:1127796. doi: 10.3389/fenrg.2023.1127796
Received: 20 December 2022; Accepted: 27 February 2023;
Published: 16 March 2023.
Edited by:
Mohammadreza Aghaei, Norwegian University of Science and Technology, NorwayReviewed by:
Abdulkerim Gok, Gebze Technical University, TürkiyeRavi Samikannu, Botswana International University of Science and Technology, Botswana
Copyright © 2023 Nalin Venkat, Yu, Liu, Wegmueller, Jimenez, Barcelos, Aung, Li, Jaubert, French and Bruckman. This is an open-access article distributed under the terms of the Creative Commons Attribution License (CC BY). The use, distribution or reproduction in other forums is permitted, provided the original author(s) and the copyright owner(s) are credited and that the original publication in this journal is cited, in accordance with accepted academic practice. No use, distribution or reproduction is permitted which does not comply with these terms.
*Correspondence: Laura S. Bruckman, bHNoNDFAY2FzZS5lZHU=
 Sameera Nalin Venkat
 Xuanji Yu
 Jiqi Liu1,2
 Jayvic Cristian Jimenez
 Erika I. Barcelos
 Hein Htet Aung
 Roger H. French
 Laura S. Bruckman