 Kevin L. Gering
 Matthew G. Shirk
 Sangwook Kim
 Eric J. Dufek
- Idaho National Laboratory, Idaho Falls, ID, United States
A tremendous commitment of resources is needed to acquire, understand and apply battery data in terms of performance and aging behavior. There are many state of performance (SOP) and state of health (SOH) metrics that are useful to guide alignment of batteries to end-use, yet how these metrics are measured or extracted can make the difference between usable, valuable datasets versus data that lacks the necessary integrity to meet baseline confidence levels for SOP/SOH quantification. This work will speak to 1) types of data that support SOP and SOH evaluations on mechanistic terms, 2) measurement conditions needed to assure high data integrity, 3) equipment limitations that can compromise data high fidelity, and 4) the impact of cell polarization on data quality. A common goal in battery research and field use is to work from a data platform that supports economical paths of data capture while minimizing down-time for battery diagnostics. An ideal situation would be to utilize data obtained during normal daily use (“pulses or cycles of convenience”) without stopping the daily duty cycles to perform dedicated SOP/SOH diagnostic routines. However, difficulties arise in trying to make use of daily duty cycle data (denoted as cycle-by-cycle, CBC) that underscores the need for standardization of conditions: temperature and duty cycles can vary over the course of a day and throughout a week, month and year; polarization can develop within an immediate cycle and throughout successive cycles as a hysteresis. If CBC data is envisioned as a data source to determine performance and aging trends, it should be recognized that polarization is a frequent consequence of CBC and thus makes it difficult to separate reversible and irreversible components to metrics such as capacity loss and resistance increase over aging. Since CBC conditions can have a major impact on data usability, we will devote part of this paper to CBC data conditioning and management. Differential analyses will also be discussed as a means to detect changing trends in data quality. Our target cell chemistries will be lithium-ion types NMC/graphite and LMO/LTO.
1 Introduction
Batteries are an integral part of daily life. Whether used in electric vehicles (EVs) or consumer electronics, most individuals have contact with a battery every day. This abundant use necessitates the need to effectively track state of performance (SOP) and state of health (SOH). These two and other metrics help ensure that the battery can meet consumer expectations and provide critical information on how batteries need to be replaced or used over the course of their life. Tracking state often relies on the ability to use electrochemical signatures or values from the battery during operation (Dubarry et al., 2017; Gering, 2017; Qian et al., 2019; Ng et al., 2020).
Many battery parameters used in SOH or SOP determinations are not simple values directly obtained from battery test equipment. Instead, time-series measurements are often made with the results then used directly or for secondary calculations. As the complexity of the time-series measurements increases and as calculations are made, the potential for measurement uncertainty to impact the values used for SOH or SOP determination also increases (Morrison et al., 2001). Understanding how measurement uncertainty and variation in measured values applies to different experiment and field data acquisition scenarios is critically important for researchers, developers, and those interested in deployment advance new battery technologies or expand the use cases that batteries are used in. This aspect of data integrity helps define the context of “usable” data.
With respect to electrochemical data two common approaches for data capture are often used. In most early-stage work straight cycling is typically more common for capturing aging trends. For more advanced batteries, researchers will often incorporate a combination of cycling and periodic tests such as reference performance tests (USABC, 2015). Both can be used to make predictions on life and performance (Kunz et al., 2021; Kim et al., 2022a), but there are also disadvantages to both data types. For periodic evaluation such as reference performance tests (RPTs), items need to be brought to a normal condition. This requires time and effort and reduces the ability for continuous, real-time evaluation of the system. For individual cycle data concerns on the interplay between kinetic, thermodynamic, and mass transport processes come into play as the cycling which is used is often at a higher rate than used for RPTs. While there are possible limitations to both, for most in operando assessments and predictions the ability to use cycle data is critical, but there needs to be understanding on the nature of the specific data used.
Herein we detail many of the implications of data usability and highlight the need to understand items like measurement uncertainty when performing analysis on battery data. We also point to the need to qualify and understand the impact that different aspects including use case may have on the data that is collected. We discuss data reliability issues stemming from measurement equipment limitations, conditional factors such as higher cycling rates that cause cell polarization, and other temporal consequences such as temperature drift due to cell heat generation or to environmental variance.
2 Materials and methods
A key role for Idaho National Laboratory (INL) is research on battery energy storage (BES). INL has served in this role for more than 30 years as a trusted partner with the U. S. Department of Energy. Within this research space, the topic of battery aging is a central theme, considering various battery chemistries, cell architectures, test conditions and aging mechanistic pathways. Accurate and quantitative evaluations of battery degradation call for accurate, reliable data.
2.1 The case for improved data quality and usability
Data quality is a practical consideration in field use, since battery management system (BMS) decisions and actions will benefit from high data integrity over regimes of current, voltage, temperature and cycling rate (I,V,T,rcycle). Data that is encumbered with polarization effects will not provide a reliable platform for BMS actions, nor will it provide satisfactory usable data for precise battery aging analyses. That is the prevailing reason why battery aging data for capacity loss from RPT obtained over slow cycling rates is preferred over daily cycle-by-cycle (CBC) data that is based on more rapid cycling conditions.
Low measurement uncertainty carries several benefits. Battery failure precursors are easier to capture when measurement error is low since there will be less competing noise to interpret. Modeling and analysis also call for clean data so that the physics are properly rendered for actual physical phenomena, and not burdened with measurement uncertainty. BMS actions will be more precisely guided through higher quality data. Thus, battery data integrity has to meet or exceed expectations for the intended use, and when accomplished will improve the efficiency and economics of battery energy storage (BES).
As we will demonstrate herein, data noise can vary between data types, e.g., capacity loss vs. resistance rise (conductance loss), due to the compounding of error that will attend metrics like resistance measurements.
2.2 Test articles
The test articles for this work are lithium-ion cells, ranging from prototypes to commercial-grade products. For this study, cells are divided between those of an NMC/graphite architecture, and cells comprised of a lithiated titanium oxide (LTO) anode and a lithium manganese oxide (LMO) cathode, collectively denoted LMO/LTO. The NMC cell group served our research on battery extreme fast charging (XFC), while the LMO/LTO cells are being tested to understand battery aging under anticipated charging station conditions that utilize BES-assisted energy delivery to electric-drive vehicles. To facilitate testing, well-calibrated test channels are matched to the anticipated voltage and current conditions of the batteries on test, and ancillary equipment such as environmental chambers (BTZ-133, ESPEC corp. or similar) are used to ensure consistent thermal conditions. Most of the data given herein was obtained through Maccor Series 4,000 testers (MACCOR, Inc.), denoted as units “21a” and “37”. Maccor 21a is rated at 0–5 V, with a single 30 A current range. Maccor 37 is rated at 0–5 V, with 0.5, 5, and 50 A current ranges for each channel. Specifications for these tester units are summarized in Appendix A. A relevant summary of the NMC cell chemistries and related test conditions are given in a recent publication on accelerated methods for battery aging predictions (Kim, et al., 2022a). Test conditions for the LMO/LTO cells are given in Table 1, Table 2, covering cycle-life and calendar-life conditions.
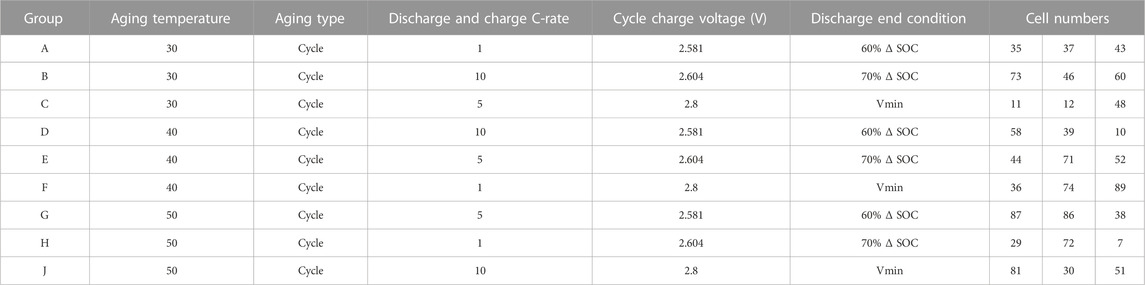
TABLE 1. Summary of cell groups and their test conditions from. (A) BTMS cycle-life testing of LMO/LTO cells.
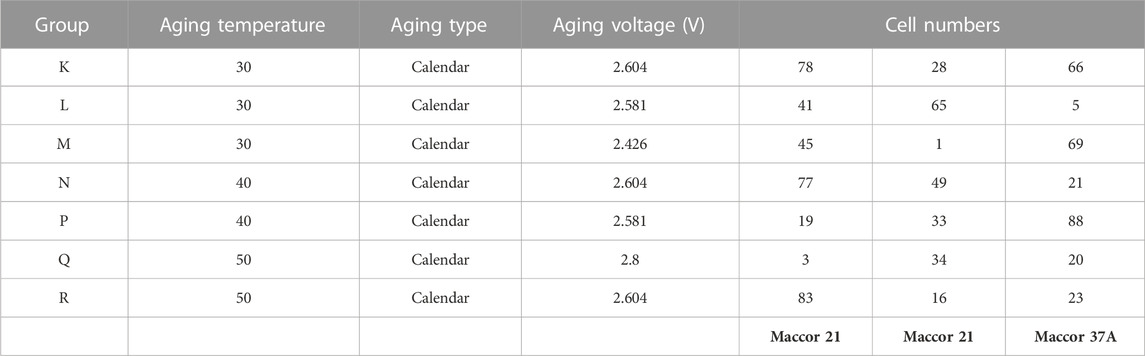
TABLE 2. (B) BTMS calendar-life testing of LMO/LTO cells.
2.3 Categories of data measurement uncertainty
Data measurement uncertainty can arise from measurement equipment limitations, conditional factors such as higher cycling rates that cause cell polarization, and other temporal consequences such as those tied to inadequate thermal management of the batteries while on test. Regarding cell polarization, this is caused chiefly from electrolyte concentration polarization (CP) that develops in a cell due to a current(s) of high enough magnitude that do not allow reversible relaxation of the electrolyte concentration gradients during the cycling. Ultimately, polarization is tied to the electrolyte diffusion rates through the porous structure of the electrodes and separator and their absolute thicknesses. Polarization can be manifest for a single cycling event, and can be carried forward in time through polarization hysteresis (PH) if there is insufficient rest time between cycling events. Also affecting data usability is the data acquisition rate, which can range from being too low (causing sparse datasets), to too high (creating excessively large datasets more difficult to manage). Lastly, we recognize that cell design can have a profound influence on the achievable thermal management and related temperature gradients within cells under test. Such gradients can cause localized aging and further complicate understanding the aging mechanisms.
2.3.1 Equipment limitations: Test channel accuracy and precision
Careful tester channel selection is particularly important when the suite of tests to be performed on a cell includes both high- and low-rate tests. In the case where the tester channel current measurement accuracy is a percentage of the chaennel’s full scale across its usable range, accommodating for high current while making accurate measurements on the low current tests can be accomplished by using a multi-range channel, or switching among channels with ideal current ranges between tests. Similarly, a current sensor operating in a battery management system under varying, real-world conditions, operating near the bottom of its range will have the same limitations as in the lab, and this effect can manifest as errors in battery state estimationand control.
Baseline error bars should be based on testequipment accuracy specifications (e.g., 0.025% of full scale for current, as given in the Appendix A for the referenced Maccor test channel specifications), and these error bars might be added to by conditional uncertainties and temperature externalities. For example, temperature drift due to seasonal changes or conditions that create a hot spot not well managed by thermal management could carry with it a temporal shift in something like measured capacity or resistance. While not an outcome of tester limitations, such temperature effects should be carefully captured and studied to determine their relative impact on overall data precision.
To conclude, whether in the lab or in the field, it is important that sensing equipment is sized to best match the predominant cell usage conditions, possibly by switching between the most appropriately sized sensor if possible. Some battery management systems may rely on subtle signatures of changing parameters as precursors for unsafe conditions, and it is important to avoid false positives or negatives due to measurement error.
2.3.2 Impact of cell polarization on data usability
Polarization is a common challenge in lithium-ion cells, which can manifest within a single cycling condition through CP or be passed from cycle to cycle under a growing hysteresis, PH. As mentioned above, polarization is tied chiefly to the electrolyte diffusion rates through the porous structures of the solid media (electrodes and separator), and the relaxation kinetics of polarized conditions are made more problematic for thicker electrodes and those with lower porosity and higher tortuosity. In other words, the effective electrolyte diffusive path length will control the rate of relaxation of CP when a cell is put on rest. While polarization of the lithium concentrations can occur in the solid state within the electrode materials, the time and length scales therein are smaller than what we would find in the porous (void) spaces across a cell, and so it is assumed the solid state is not the constraining environment for polarization. Thus, electrolyte CP is generally a reversible condition that can be managed to produce more consistent data quality. Because CP is tied to electrolyte properties and performance of such in porous electrode structures, a change of electrolyte can improve polarization relaxation kinetics and reduce the time needed to “depolarize” a cell. Management of CP can also involve temperature and to a lesser extent, SOC conditions. Electrolyte diffusion is higher at higher temperatures (Gao et al., 2022), so there can be an advantage to operating at slightly higher temperatures to reduce CP provided this is weighed against the increased aging rates that can emerge at such conditions.
Standard battery accelerated degradation or lifetime tests include cycling test under different aging conditions and periodical evaluation through a reference performance test (RPT) (Knap et al., 2018). Data from CBC and RPT are used to develop a variety of diagnostic techniques. CBC data includes changes in capacity, coulombic efficiency (CE), end-of-charge voltage (EOCV), and end-of-discharge voltage (EODV) during cycling. A low C-rate, such as C/10 or C/20, is used during RPT to assess the State-of-Health (SOH) of lithium-ion batteries. As one example, RPT data is used to understand battery aging based on differential voltage and incremental capacity.
Figure 1 demonstrates the concept of RPT-based aging data being different than that based on CBC conditions, considering discharge capacity loss data acquired through RPT (C/20 rate) versus CBC (C/2 rate). The 2 cells shown are from battery pack P462 (moderate loading NMC532/Gr single layer pouch cells), where cell 4 (panel A) was cycled at a 6C charge rate while cell 16 (panel B) was cycled at a 4C charge rate. All CBC discharging was done at C/2 constant-current rate. It is readily seen that the nature of the aging conditions uniquely influences the differences between RPT and CBC discharge capacity loss.
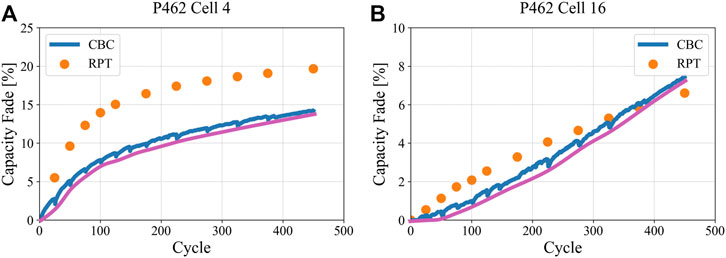
FIGURE 1. RPT (C/20) and CBC (C/2) data differ due to how polarization affects accessible capacity. Pink curves represent the trendlines for CBC data just following the RPTs, effectively removing polarization hysteresis effects between RPT conditions. Panel (A) shows cell 4 which was charged at a 6C rate and had undergone lithium plating, while panel (B) shows cell 16 which was charged at a 4C rate but did not exhibit lithium plating.
It is interesting to note that the performance and aging trends observed in CBC data is not consistent with that from RPT data as shown in Figure 2, which further breaks down the origins of polarization and its hysteresis between cycles. It is mainly because of polarization at higher C-rate. The capacity measured during RPT provide a more of a true polarization-free assessment of the available and accessible capacity. In contrast, capacity from CBC data (C/2, 1C, 2C, etc.) will appear to give values less affected by aging because only a small portion of the active material can be used for energy storage from Beginning of Life (BOL) and forward due to the polarization-limited lithium transport. That fraction, as positioned within the whole capacity, will therefore represent a lesser amount of material affected by irreversible aging mechanisms. Nevertheless, because CBC data enables rapid prognosis/diagnosis of battery aging, some studies have used it to understand battery aging (Severson et al., 2019; Chen et al., 2021), although use of CBC data for highly quantitative aging analyses must be done with care to identify contributions from polarization.
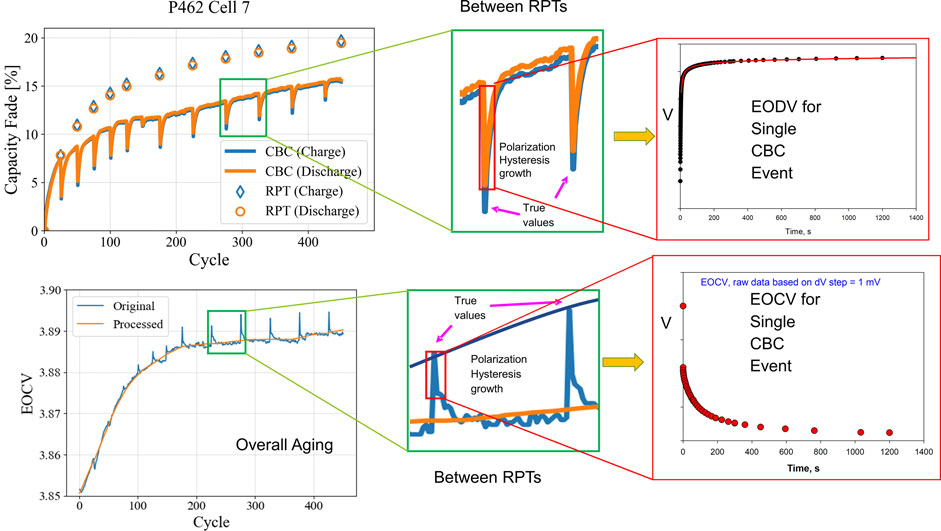
FIGURE 2. Dissection of CBC battery aging data for NMC/Gr cells, identifying the progression of PH between RPT intervals. Examples of individual EODV and EOCV are given, each spanning a 20-min period.
2.3.3 Data acquisition rate and type (mV or dt step)
Capacity measurement during cycling or RPT are not significantly affected by how frequently data recorded since it is measured at cut-off conditions, which are commonly determined by voltage or time. That is why data acquisition rate has been disregarded in R&D and industry.
Recent advancement in diagnostic methods based on electrochemical signatures have drawn more attention to the data acquisition rate. For example, differentiation of electrochemical signatures, such as incremental capacity (IC) and differential voltage (DV), requires more frequent data collection with less time and voltage step. If too large or too small step size is used, it requires more intensive filtering methods (i.e., higher filtering coefficients) to process data. In that case, important information from raw data is possibly removed by filtering or smoothing process. Even if cycling test focusing on cell performance improvement, data needs to be collected with small step size for comprehensive understanding of results, which can be a guide to improve next tests. Data acquisition rate plays a more important role during fast charging studies. Thermodynamic and kinetic degradation become more obvious with an increase in C-rate. Data acquisition rate needs to be more carefully determined in order to gather thermodynamic and kinetic contributions during fast charging.
On the other hand, analyzing database with too high data collection rate leads intensive computational load. According to published research (Fathi et al., 2014; Harlow et al., 2019), slow cycling tests with an extremely low C-rate (C/150) took more than 10 years and long cycle life cells lasted over 5,000 cycles. Without careful planning on the data collection rate, massive data would be generated in these long-term tests. As big data and cloud computing have attracted attention, data sharing, storage, and analysis become more challenging when data size is too huge due to too small step. For effective data collecting, careful planning of the data acquisition rate by using both time step and voltage step is strongly recommended.
2.3.4 Environmental chamber issues (lag time and precision)
Our chambers are “climatic chambers” in terms of temperature, but even they experience fluctuations that may vary over different timescales, from the immediate, diurnal, and perhaps monthly or seasonal variations. Precision and response rates of temperature control might also vary with weather conditions, such as low versus high humidity.
Additionally, we acknowledge that environmental chambers used to control the ambient temperature of cells during testing have limits to their rate of heat removal or addition. While we strive to achieve uniform thermal conditions for all articles within an environmental chamber, it is known that Joule heating during cycling raises the cell’s temperature relative to the ambient temperature. It is standard practice, when feasible, to install thermocouples on cells at key locations to monitor such temperature differences. This practice also helps understand if there are any temperature variations across the chamber which need to be accounted for when doing analysis. This “skin temperature” is only a rough guide to cell temperature, since the internal temperature can undergo appreciable gradients that cover several degrees. As mentioned below, this creates a challenge to assign a single temperature to the emergent data.
2.3.5 Cell design and other conditional uncertainties (polarization consequences obscure capacity and impedance)
Cell design can contribute to measurement uncertainty, such as the outcomes that arise for using thicker electrodes. Since the lithium-ion transport distances within the electrolyte phase grow with increasing electrode thickness, electrolyte concentration polarization deepens therein, and the electrode utilization becomes worse with thicker electrodes. This becomes an issue of balancing available active material with the thickness-dependent path length for lithium transport. More material is accessible at slower cycling rate because the lithium flux does not exceed the as-polarized electrolyte transport capabilities over the entire path length. As electrodes become thicker and/or rates become higher, an imbalance is created wherein the flux cannot be sustained over the entire path length, causing severe concentration polarization and under-utilized active material in some cases (Gao et al., 2022).
It is worth noting that the cell-specific attributes that contribute to polarization consequences can change with cell aging. Porous structures may undergo extended growth of passivation films over the battery lifecycle, which might impact more severely the nano-porous regions, for example. Therefore, management of CP and related relaxation kinetics could involve adaptive measures that account for cell aging. By necessity such measures should involve a more sophisticated method to approaching and/or changing voltage limits, so that the voltage change due to polarization stays within manageable values. Within this polarization context, shorter power pulses or reduced power levels can be consequences for an aging cell. However, other non-polarization factors such as an increased voltage drop due to higher ohmic resistance over aging can also affect when a cell reaches a voltage limit, creating the possibility that a voltage limit is reached due to higher overall cell impedance before substantial CP is developed.
For high-energy cells with thicker electrodes, capacity measured at C/20 will give more of a true polarization-free assessment of available and accessible capacity. Measured over an aging timeline, the C/20 basis will be an accurate reflection of all factors that contribute to capacity loss in terms of loss of lithium inventory (LLI) and loss of active material (LAM). Conversely, capacity measured at higher rates (C/2, 1C, 2C, etc. Perhaps at CBC conditions) will appear to give values less affected by aging since the polarization-limited lithium transport will allow only a fraction of the active material to be involved in energy storage, from BOL and forward. That fraction, as positioned within the whole capacity, will therefore represent a lesser amount of material affected by irreversible aging mechanisms.
Lastly, two other factors deserve mention. First, a battery’s form factor can cause spatially-variant thermal performance and related temperature gradients. This makes it difficult to assign a single temperature to battery data and increases measurement uncertainty. There can also be hot spots in battery packs where there are temperature differences between cells. Collectively, these thermal artifacts can cause significant impacts to data reliability and usability, especially to metrics like cell resistance which is highly sensitive to temperature. Second, the design of cell fixtures and the quality of electronic connections can influence data measurement quality. Simple examples include having fixtures that provide consistent and perhaps adaptive pressure management for pouch cells, and having low-impedance connections free of corrosive conditions such as excessive moisture.
2.3.6 Externalities (temperature effects, seasonal factors)
In addition to laboratory-based effects and impacts to error there are conditions which often arise in the characterization and acquisition of data from deployed BES. Deployed storage whether stationary or electric vehicle batteries does not see uniform use and also is exposed to non-uniform temperatures. On the temperature side fluctuations over the course of the day as well as seasonal changes can all impact measured quantities. This is especially true when measurements have a significant contribution from impedance related to transport in the electrolyte. As temperatures go up (or down) the measured values will change and can create referencing issues if not properly accounted for. A practical method to help account for these impacts is to use a set of two parallel thermal measurements in addition to the electrochemical data acquisition. One on the cell and one for the ambient thermal condition.
2.3.7 Elusive standard conditions for diagnostics
Unfortunately, all the items noted above related to measurement uncertainty are not well collected in the literature and often are not fully accounted for in education programs or are emphasized differently from program to program. This lack of uniformity impacts the ability to use all data for diagnostic or prognostic purposes. For that reason, there is a need to drive more discussion across the battery community. Some of this resides in how data is collected, but also in how researchers and technologists consider using and sharing data that is collected (Ward, et al., 2022). In addition to published work and literature-based activities the battery community needs to continue to evolve and refine best data practices as part of the student and early career development process, which will support harmonization of battery data quality standards over time.
2.4 Differential methods for CBC data: Capacity and conductance loss rate analyses
Differential or rate analysis of raw data helps to explore measurement variance for data employed in aging evaluations. Herein we apply sigmoidal rate expressions (SRE) to describe aging mechanisms that stem from LLI and LAM. Capacity and conductance (denoted as K) losses are considered. Due to their smooth analytical rendering over time, SRE-based rate analyses serve as a good statistical baseline to establish a standard to compare against data variance. The generalized form for an SRE is given as follows:
which can be differentiated over time through analytical or numerical methods. Here, “j” is the mechanism index, i* denotes an arbitrary use condition, and “t” is time. The parameters (a, b, M) are kinetic and thermodynamic terms that capture essential information to describe the progression of a given battery aging mechanism, and are well discussed elsewhere (Kim et al., 2022a). Note that more than one aging mechanism can be active at a time. In this work, SRE were used to describe capacity and conductance losses of cells comprised of an LMO/LTO cell chemistry. SRE regression of capacity and conductance loss data produced R2 values generally in excess of 0.995, allowing high confidence for using the SRE differential outcomes for aging rate analyses.
Considering cell conductance loss, the differential with respect to cycle count can be expanded as given below. Alternately, the differential over time could be utilized, especially for cases of calendar-life data.
where the greatest measurement uncertainty occurs at
Given the Maccor tester channel rated accuracies of 0.025% of full scale for current (
3 Results
3.1 Regarding equipment limitations
Consider a power cell that is aged in a cycling routine using a 10C rate, and then performs an incremental capacity test at regular intervals, using C/20 charge and discharge current. Error in the overall capacity measurement depends on the error in current measurement of each sample used in the numerical integration of current over the duration of the test. Temporal effects such as temperature changes (due to ohmic heating or drift within the ambeintenvironment within the temperature chamber) may arise and influence measurement accuracy or the basis upon which the data are compared.
Limitations on the availability of multi-range channels necessitated that some cells be tested on channels with a single 30 A charge and discharge current range to accommodate the 10C cycling, while other identical cells were connected to multirange channels with 0.5/5/50 A current ranges. These cells were cycled identically from Vmax to Vmin at 30°C, with reference tests completed every 60°days. The C/20 capacity measurements during the reference test for a cell on the single range channel, and for one on the multi-range channel are shown in Figure 3, with their respective error bars for the current range used (0.025% of full scale). While the 30 A single range tester measurements perform well within the general accuracy, it is clear that the small C/20 capacity degradation trend is not well captured. A 1C discharge capacity test was also performed at the same interval as part of the reference performance tests. While the C/20 capacity data from the 30 A channel are not useful to show small changes in capacity, the data were originally captured to use for IC analysis. It is important to maintain the discipline of including error bars in battery data, where feasible, since the data may act as guides for BMS actions or human decisions.
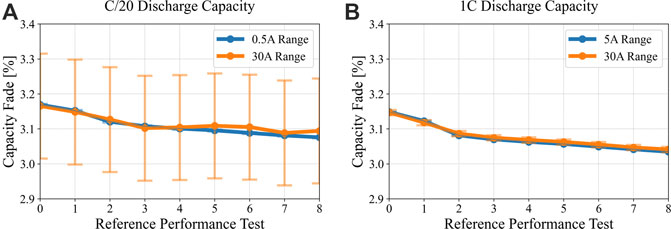
FIGURE 3. Comparison of capacity versus RPT for representative LMO/LTO cells, showing (A) C/20 conditions as measured by 0.5 A versus 30 A channels, and (B) C/1 conditions measured with the same channels. A notable mismatch is observed for measuring C/20 capacity with the 30 A channel.
To investigate the usefulness of the C/20 data for IC analysis with varying degrees of current uncertainty, an experiment was performed using an auxiliary precision current meter to simultaneously capture log current for tests performed on both 0.5°A and 50 A range settings. These tests were performed sequentially on the same cell, and the tester data are compared across ranges and with the precision meter. Results are summarized in Figure 4.
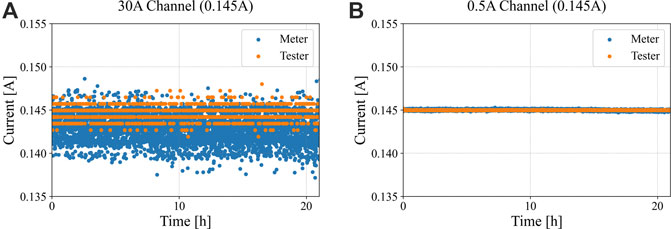
FIGURE 4. Data comparison for a C/20 discharge capacity test of an LMO/LTO cell using (A) 30 A Maccor channel versus the Keysight multimeter, and (B) 0.5 A Maccor channel range versus the Keysight multimeter.
Despite the difference in current control and measurement on the higher range channel, the features of the incremental capacity signature, once processed (interpolated data from 2.7 to 1.8 V linearly with dV of 0.002°V, then Savitsky-Golay filter was used with nl and nr parameters = 5.5, M = 3), match well between the high-res meter data and the tester data for both high and low ranges, as seen in Figure 5A,B. In the less accurate tester case, the peak intensity is slightly greater than the meter because the tester was actually discharging at a lower current than the target, resulting in over measured capacity of about 1.5%. The peak locations are the same on the x-axis as expected, because the voltage measurement characteristics are the same for the tester at both current range settings. The unfiltered data from the tester versus the meter are given in panels (C) and (D), respectively. Lastly, Figure 6A,B indicate how the dQ/dV profiles in Figure 5 would shift according to the maximum rated error for the Maccor 50 A channel. Note that panel (B) enlarges the range of interest between 2.35 and 2.6 V. Again, the magnitude of the error bounds is driven by using a high-amperage test channel to measure a small current at the C/20 cycling condition. This can result in significant misdiagnosis of the progression of aging mechanisms, for example.
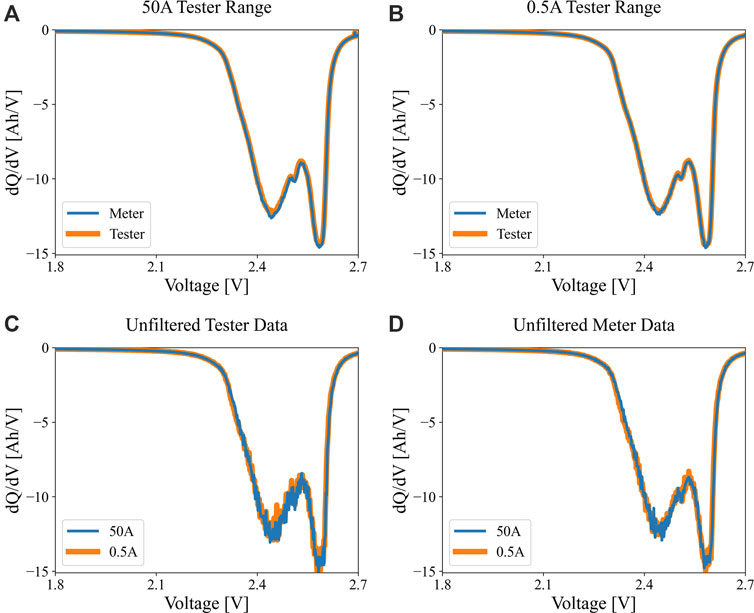
FIGURE 5. Differential or incremental capacity signatures (dQ/dV) for an LMO/LTO cell, comparing C/20 data obtained through (A) 50 A Maccor range (orange) versus the Keysight multimeter (blue), and (B) 0.5 A Maccor range (orange) versus the Keysight multimeter (blue). Panels (C) and (D) show the unfiltered data for 50 A (blue) and 0.5 A (ornage) ranges for the tester and meter, respectively.
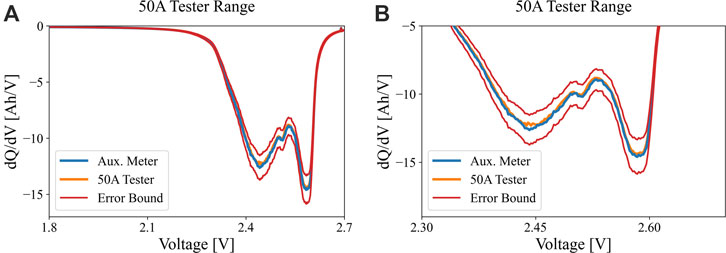
FIGURE 6. (A) dQ/dV signatures of an LMO/LTO cell at C/20 discharge (0.145 A) using the 50 A Maccor range (orange) versus the Keysight multimeter (blue). Maximum possible ± variance is imposed, resulting in the red set of profiles. For the sake of clarity panel (B) enlarges the range of interest between 2.30 and 2.65 V.
The auxiliary meters used to collect high resolution data in tandem with the Maccor Series 4,000 battery tester were both Keysight 34401 A 6 ½ digit digital multimeters that were calibrated with stated current measurement accuracy of +/- 0.216 mA and stated voltage measurement accuracy of 0.1 mV, using the 1 A range. The voltage meter was run in the 10 V range resulting in V measurement error of 0.1 mV [compare to Maccor tester specification of 0.025% of 5 V = 1 mV (10x worse)]. Testing was done within 90 days of calibration of the tester and voltage meter.
3.2 CBC versus RPT conditions: Identifying and managing polarization
There are simple methods that can be used to quantify the influence of CBC conditions on battery data, and a few are mentioned here. First, a static capacity test can be performed wherein a cell is discharge cycled between two voltage targets (typically Vmax to Vmin) using progressively higher constant-current (CC) conditions. The cell must be well rested between cycling conditions. For example, this could entail performing a C/3 CC charge followed by a constant voltage (CV) taper charge until a current threshold is reached, then a short rest (10–15 min), followed by the CC discharge. This is repeated over the entire range of discharge currents, which in terms of C-rates referenced to the C/1 basis, could involve conditions such as C/10, C/3, C/1, 2C, 4C, 6C, etc. Cell polarization will cause diminished capacity at the higher discharge rates. Note that static capacity tests are sensitive to temperature, so the test conditions should match the temperature(s) of interest for the ultimate application. By surveying a matrix of discharge currents, polarization effects can be inferred for an arbitrary CBC condition. Another gauge of polarization during CBC conditions is to monitor the rate of voltage relaxation through EOCV and EODV. These terms are discussed more thoroughly below. Although the level of “adequate” rest of a cell to mitigate polarization effects is somewhat arbitrary, a rough guide is to achieve less than 1 mV/min change in EOCV or EODV before the cell resumes its cycling protocol. Lastly, through a similar technique cell impedance at 1 kHz can be monitored during rest periods to detect when the change in impedance (dR/dt) has satisfied a pre-set threshold value.
3.3 Differential capacity (dQ/dV): Heavily influenced by cycling rate
Differential capacity/Incremental capacity analysis is a method to identify the battery state-of-health. Due to the low computational load, it is widely used to classify and quantify the percentage of LLI and LAM based on slow rate response (<C/10) (Kim et al., 2022b). The most profound influence on dQ/dV integrity is the constant-current cycling rate used to create the data. Polarization, even at modest levels, can skew the position of peaks and valleys within the dQ/dV profile and alter their relative heights, depths, and area, respectively. Figure 7 compares dQ/dV at a reference performance test with that of different charging rates for a NMC532/Gr cell used in a fast-charge study (Kim et al., 2022a). As charge rate increases, discernible features (e.g., peak height, depth, and area under peaks) become less obvious. These outcomes can greatly confound the evaluation of aging mechanisms tied to subtle changes in the peak vs. valley artifacts and will obscure quantification of aging in terms of loss of lithium inventory and loss of active materials from the anode versus the cathode. Note that the propensity to polarize can change as a cell ages, making the determination of the true dQ/dV response a moving target. In comparison, uncertainties due to an electronic test channel are a minor contribution, provided the channel is operated within the intended specification for voltage and current ranges.
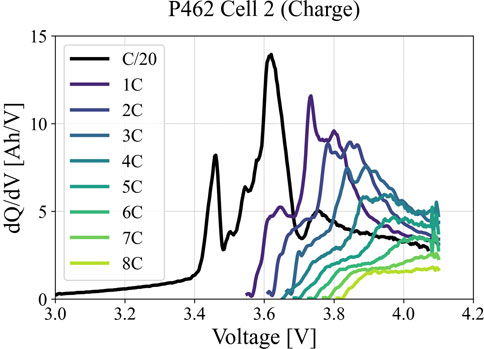
FIGURE 7. Effect of charging C-rates on dQ/dV profiles for NMC532/Gr pouch cells with moderate energy storage loading. In practical terms the data becomes unusable above the 2C rate.
3.4 Relaxation data (EOCV, EODV)
As previously mentioned, non-ideal cycling conditions can create a polarization hysteresis that builds up throughout battery testing. Generally, this occurs when there is insufficient rest between cycling conditions to allow for polarization to dissipate and the effects of CP are carried forward through successive cycling elements. The PH is a reversable effect that can mask the signals from irreversible effects (i.e., battery degradation) located in the cycle-by-cycle data. Two primary signals of interest are EOCV and EODV. Currently, EOCV and EODV are captured 15 min after their respective charge and discharge cycles, but are measured over the entire rest period. These terms can be influenced by the preceding cycling rate and data capture rate.
The magnitudes and shapes of EOCV and EODV curves give insights into the related polarization, which is unique to each cell chemistry and the prevailing operating conditions of (I,V,T,rcycle). For example, it is known that electrolyte diffusivity suffers at lower temperatures, causing the magnitude of CP to increase and the needed relaxation time to be prolonged. Likewise, higher cycling rates will drive CP to greater levels, where in the case of fast charging the electrolyte will be depleted at the anode side and be enriched on the cathode side. Such localized electrolyte concentrations will cause correspondingly local properties, for example, higher viscosity and lower diffusivity at the cathode during fast charge (Gao et al., 2022). Figure 8A shows capture of EODV data for P531 (low loading NMC811/Gr single layer pouch cells) cell 4 (cycled at 4C charge rate, C/2 discharge rate), where a distinction is made between RPT values (red dots) and CBC data (blue line). The PH profile following the final RPT is shown in panel (B), showing that the PH exhibits plateauing behavior, i.e., PH is bounded and will have finite progression.
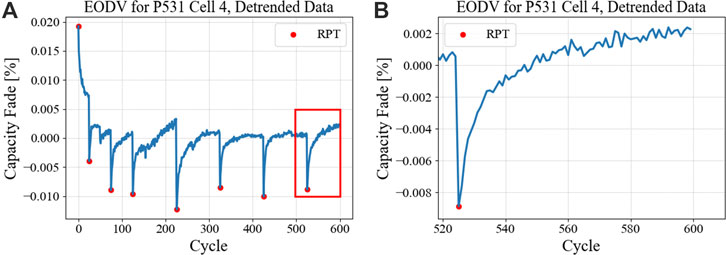
FIGURE 8. CBC profiles for EODV of an NMC811/Gr cell cycling at a 4C CCCV charge rate, (A) covering the entire test period and (B) isolating the final post-RPT segment to demonstrate the magnitude of PH. In (A) the red dots represent the voltage in the CBC cycle that immediately follows an RPT.
This analysis also becomes more interesting as groups of cells tested under different charging C-rates are analyzed. As the C-rate increases, the extent (both in magnitude and rate) of PH also increases. This can be seen for case of 1C, 6C, and 9C in Figure 9 for an NMC/Gr cell group. Panel (A) shows overall cycle and panel (B) shows a zoomed-in portion for easier visual comparison.
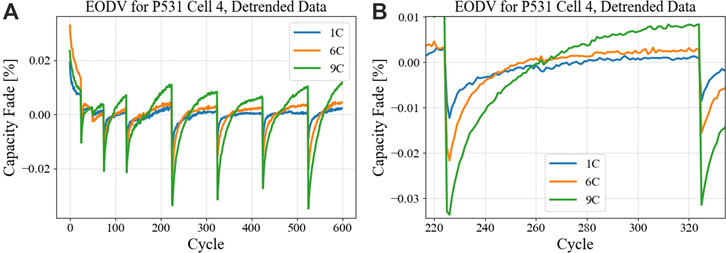
FIGURE 9. CBC profiles for EODV of NMC811/Gr cells cycling at a 1, 6, and 9C CCCV charge rates, (A) covering the entire test period and (B) isolating a between-RPT segment to demonstrate the magnitudes of PH that vary with rate. In (B) the plots are expanded for the sake of clarity.
3.5 Example outcomes from differential methods for CBC data (SRE approach)
Using data from the aforementioned LMO/LTO cells from cycle-life testing, differential plots for capacity loss and conductance loss are given in Figure 10 and Figure 11. Representative cells were used from each group, where three replicates were tested for each condition. Note that the differential is with respect to cycle count, which can be converted to a time basis simply by considering the number of cycles per day. Figure 10 shows modest values for the capacity differential data (dCapacity/dncyc), generally less than 0.005 percent per cycle, while most cells are under 0.002 percent per cycle following early-life aging which is dominated by loss of lithium inventory. Data variance per cell is relatively low. Mechanistic trends are visible, such as gas formation in cell J-81 evidenced by an increasing rate after the first 6,000 cycles. However, Figure 11 shows that conductance loss differential values have considerably more noise and larger values. Data variance per cell is relatively high compared to capacity loss data (same scales used). Some of the noise appears random, with many points in the negative rate region, which strictly speaking would be a non-physical result. The difference between Figure 10 and Figure 11 are that Figure 10 relies essentially on data for current, while Figure 11 relies on the ratio of current over voltage, such that there is a compounding of measurement error, whether that error is sourced from equipment inaccuracies or from other sources mentioned above.
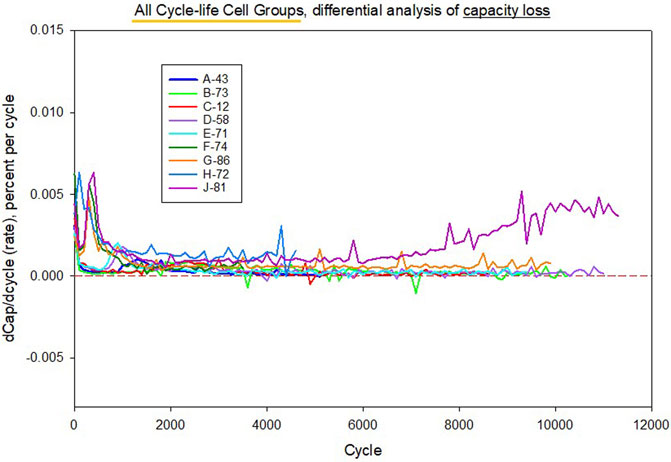
FIGURE 10. Differential rate analysis of C/1 capacity loss for representative LMO/LTO cells tested under nine different cycle-life conditions. Data variance per cell is relatively low. Mechanistic trends are visible, such as gas formation in cell J-81 evidenced by an increasing rate after the first 6,000 cycles.
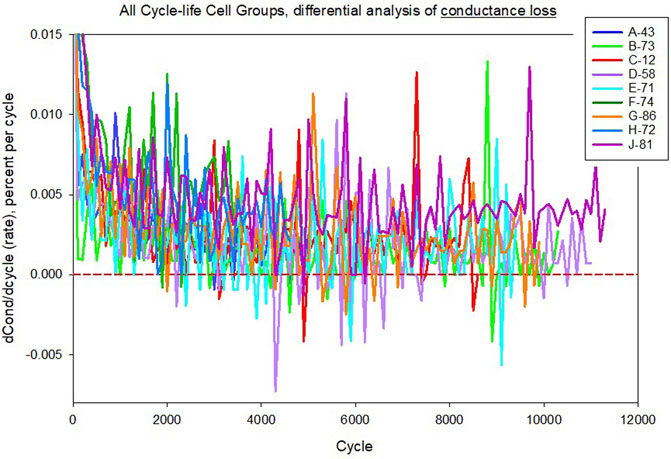
FIGURE 11. Differential rate analysis of conductance loss for representative LMO/LTO cells tested under nine different cycle-life conditions. Data variance per cell is relatively high compared to capacity loss data (same scales used as in Figure 10). Some of the noise appears random, with many points in the negative rate region.
To help set the context for the magnitude of “noise” in the differential conductance data, the SRE basis was used to synthesize smooth analytical curves for the differentials over cycle count. Figure 12A shows the outcome for four selected cells. Differential profiles from SRE are overlaid on data for these four cells. SRE parameters were obtained from regression of conductance data, typically with R2 ≥ 0.999. In many instances the magnitude of the data spikes exceeds the magnitude of the SRE value, exposing worse cases of measurement variance. However, some trends appear not to be completely random. Figure 12B shows the corresponding temperature data for cells J-81 and D-58. Inspection of the trends for the conductance data reveal that there is a correspondence to that of the temperature trends, especially for cell D-58 after 6,000 cycles. This is a plausible physical connection, given the relatively high sensitivity of battery resistance to temperature. A chief contributor of this sensitivity is the electrolyte. As an example, a common Li-ion battery electrolyte for research is the system ethylene carbonate (EC) plus ethyl-methyl carbonate (EMC) at a mass ratio of (3:7) with 1 molal LiPF6. At around room temperature this electrolyte resistance has a variability due to temperature of 1.75% per degree centigrade, and it is reasonable to expect that comparable electrolytes for other Li-ion systems would have similar variances. Therefore, it is probable that temperature variance plays a role in measurement uncertainty for cell conductance of the LMO/LTO cells.
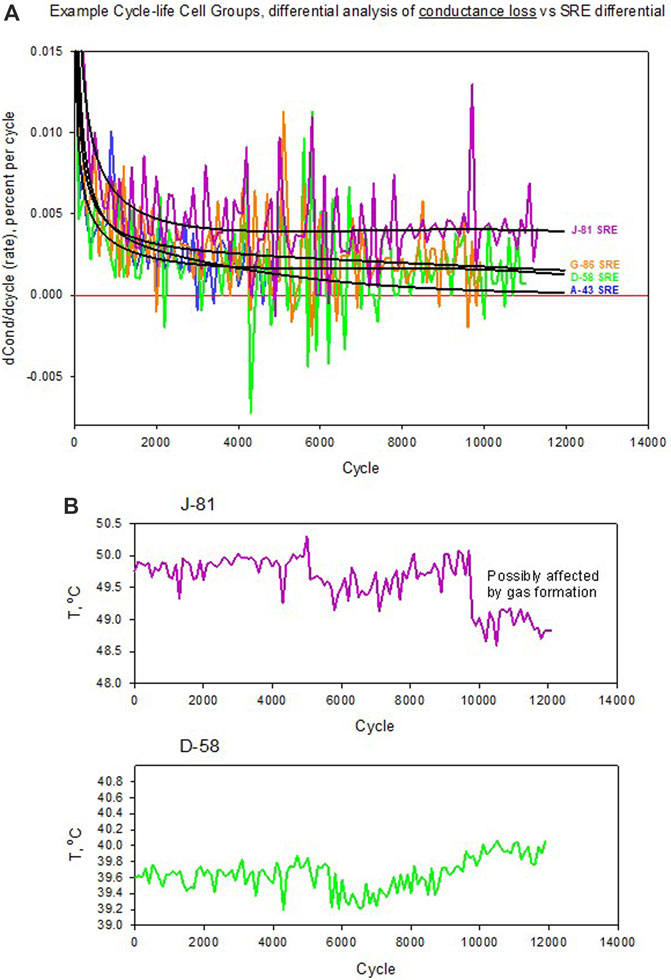
FIGURE 12. Differential rate analysis of conductance loss for four selected cells from Figure 11, where (A) Differential profiles from SRE are overlaid on data for these cells. SRE parameters were obtained from regression of conductance data, typically with R2 ≥ 0.999. In many instances the magnitude of the data spikes exceed the magnitude of the SRE value, exposing worse cases of measurement variance. Panel (B) shows the accompanying skin temperatures of two of the cells, where the case of cell D-58 demonstrates a correspondence of the rate of conductance loss with temperature rise starting around 6,000 cycles.
To validate the current accuracy, the LMO/LTO cells were discharged and charged at C/20 rate in these three testing ranges for the reference performance test, where the constant-current condition was 0.145 A. Based on the data analysis, only by using the current range of ±500 mA is the accuracy at 0.145 A maintained within ±0.025%. When using the other current ranges of ±5 A and ±50 A the measurement error at 0.145 A exceeds ±0.025%. Figure 13A shows that increasing the testing range causes enlarged data scattering, and the standard deviations from the low range to the high range are 2.424 × 10⁻⁵, 1.381 × 10⁻⁴ and 9.203 × 10⁻⁴, respectively. Correspondingly, the real accuracies in these three ranges are ±0.0167%, ±0.0952% and ±0.634%. Within an appropriate range selection, the current measurement accuracy is outside the value that the tester claims. Recall the voltage accuracy claimed by the tester is ±0.02% at full scale.
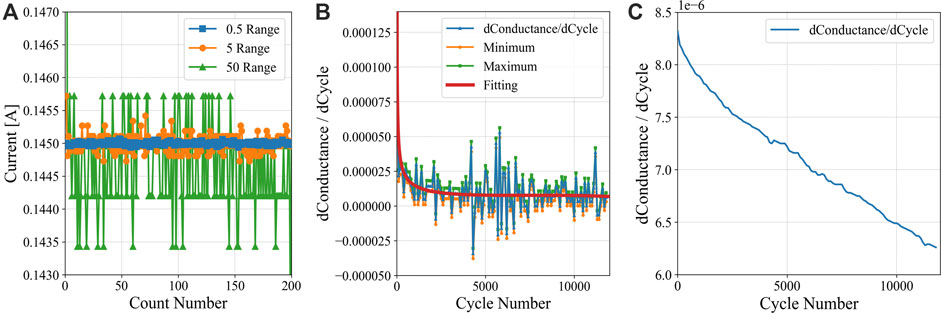
FIGURE 13. Analyses of an LMO/LTO cell at a C/20 rate, showing (A) variance of current measured by a Maccor test channel at 0.5, 5 and 50 A ranges. Panel (B) shows the differential conductance profiles (dK/dn) for cell D-58, showing the original profile and profiles adjusted for the maximum (green) and minimum (orange) errors (per Eqs. 2 and 3). The SRE differential outcome is included in (B). Panel (C) shows the differences between these maximum and minimum error outcomes over cycle count.
When both current and voltage accuracies affect the measurement simultaneously and in an opposite way,
4 Discussion and conclusion
Battery data is used toward a number of objectives, including but not limited to battery materials design and optimization, performance validation, lifecycle diagnostic and predictive analyses, and decisions toward possible second use versus materials recycle. Toward these objectives it is crucial that the battery data measurement accuracies meet or exceed the intended accuracy of each objective. This is fundamentally import to economic factors ties to battery valuation over an entire lifecycle.
To meet this broad goal, battery data must be acquired under consistent, well-defined and reproducible conditions. Measurement equipment must be rated to handle the voltage and current ranges foreseen for the battery operating conditions, and such equipment should undergo periodic calibration to confirm accuracy is within manufacturer’s specifications.
Three primary sources of measurement uncertainty affect data usability. First is the use of test channels not well matched to test conditions, such as using a high-amperage channel to measure very low currents. Second, variations in temperature are a source of measurement uncertainty due to cell ohmic heating as well as imperfect thermal management that is a result of the combination of the cell fixture and surrounding thermal environment. Cells can heat faster than environmental chambers can react, causing a time lag in thermal management. And, temperature profiles within cells can cover several degrees of variation. All said, choosing a single temperature to assign to a given set of battery data can quickly become problematic, and routes should be sought to identify representative if not averaged values that might vary over time. Third, cell polarization is a chief cause for data uncertainty as it causes a reversible source of voltage shift that obscures outcomes tied to capacity determination, impedance quantification, and achievable power. Sufficient rest of cells between cycles is required to avoid polarization hysteresis. While polarization and underlying CP cannot be avoided for some test conditions, it is useful to establish a slow-rate baseline (e.g., C/20 or C/10) to define the true irreversible aging consequences. Understanding the basic physics behind polarization will help the battery practitioner understand conditions under which polarization can be more severe, and what routes can be used to detect, avoid or manage it. It is noted that cell aging can exacerbate the above sources of data uncertainty as cells become more resistive. Regardless of the sources of uncertainty, it is highly advised to employ error bars, when feasible, to bound the confidence intervals of the data, a useful practice for BMS as well as human-decision activities.
In addition to these sources of uncertainty, data acquisition rates should be chosen that support quantitative analyses while not becoming a computational burden in terms of processing times and storage space. For example, data acquisition rates for polarization relaxation of EOCV and EODV may have a graded approach (frequent at first then slower later) and be different than what is used for CBC or RPT capacity determination. Having sufficient data in the time domain is especially important when kinetic factors are considered.
Differential techniques can be employed to further explore behavior of data uncertainty, such as the dCapacity/dncyc and dK/dncyc methods discussed herein. Conversion from dncyc to dtime is accomplished when the cycles-per-time is known. These techniques reveal the magnitude of uncertainty or “noise” in relation to a physics-based rate expression for cell aging, herein provided by SRE formulae. Our analysis shows that, in general terms, temperature fluctuations have a more profound effect on conductance data uncertainty than equipment measurement errors.
As battery-based energy storage proliferates into more economic sectors, it is a critical challenge for battery stakeholders to ensure data measurement uncertainty is understood and within desirable bounds, and that data usability is high. This will support chain-of-custody issues tied to battery valuation over life, as well as move the industry to more standardization of battery data creation and use. This will also allow more CBC-type data to be used to selectively replace expensive alternatives such as RPT. The findings of this paper support these directions.
Data availability statement
The raw data supporting the conclusions of this article will be made available by the authors, without undue reservation.
Author contributions
KG—Senior and lead author; provided technical content, manuscript concept, proofing and final editing. MS—provided technical content and manuscript proofing, SK—provided technical content and manuscript proofing, CW—provided technical content and manuscript proofing, ED—Senior author; provided technical content and manuscript proofing, QW—provided technical content and manuscript proofing.
Funding
This manuscript has been authored by Battelle Energy Alliance, LLC under Contract No. DE-AC07-05ID14517 for Idaho National Laboratory with the U.S. Department of Energy.
Acknowledgments
The authors gratefully acknowledge support from Simon Thompson and Samuel Gillard from the Vehicle Technologies Office (VTO) of the U.S. Department of Energy’s Office of Energy Efficiency and Renewable Energy. Specific supporting projects include Machine Learning for Accelerated Life Prediction and Cell Design, eXtreme fast charge Cell Evaluation of Lithium ion batteries (XCEL), and Behind the Meter Storage (BTMS), which are all part of the Advanced Battery Cell Research Program. The authors would also like to acknowledge the Cell Analysis, Modeling and Prototyping facility at Argonne National Laboratory for the preparation of some of the cells represented herein. This manuscript has been authored by Battelle Energy Alliance, LLC under Contract Nos. DE-AC07-05ID14517 for Idaho National Laboratory with the U.S. Department of Energy.
Conflict of interest
The authors declare that the research was conducted in the absence of any commercial or financial relationships that could be construed as a potential conflict of interest.
Publisher’s note
All claims expressed in this article are solely those of the authors and do not necessarily represent those of their affiliated organizations, or those of the publisher, the editors and the reviewers. Any product that may be evaluated in this article, or claim that may be made by its manufacturer, is not guaranteed or endorsed by the publisher.
Supplementary material
The Supplementary Material for this article can be found online at: https://www.frontiersin.org/articles/10.3389/fenrg.2023.1125175/full#supplementary-material
References
Chen, B.-R., Kunz, M. R., Tanim, T. R., and Dufek, E. J. (2021). A machine learning framework for early detection of lithium plating combining multiple physics-based electrochemical signatures. Cell. Rep. Phys. Sci. 2, 100352. doi:10.1016/j.xcrp.2021.100352
Dubarry, M., Berecibar, M., Devie, A., Anseán, D., Omar, N., and Villarreal, I. (2017). State of health battery estimator enabling degradation diagnosis: Model and algorithm description. J. Power Sources 360, 59–69. doi:10.1016/j.jpowsour.2017.05.121
Fathi, R., Burns, J. C., Stevens, D. A., Ye, H., Hu, C., Jain, G., et al. (2014). Ultra high-precision studies of degradation mechanisms in aged LiCoO2/graphite Li-ion cells. J. Electrochem. Soc. 161, A1572–A1579. doi:10.1149/2.0321410jes
Gao, N., Kim, S., Chinnam, P., Dufek, E. J., Colclasure, A. M., Jansen, A., et al. (2022). Methodologies for design, characterization and testing of electrolytes that enable extreme fast charging of lithium-ion cells. Energy Storage Mater. 44, 296–312. doi:10.1016/j.ensm.2021.10.011
Gering, K. L. (2017). Novel method for evaluation and prediction of capacity loss metrics in Li-ion electrochemical cells. Electrochim Acta 228, 636–651. doi:10.1016/j.electacta.2017.01.052
Harlow, J. E., Ma, X., Li, J., Logan, E., Liu, Y., Zhang, N., et al. (2019). A wide range of testing results on an excellent lithium-ion cell chemistry to be used as benchmarks for new battery technologies. J. Electrochem. Soc. 166, A3031–A3044. doi:10.1149/2.0981913jes
Kim, S., Yi, Z., Kunz, M. R., Dufek, E. J., Tanim, T. R., Chen, B.-R., et al. (2022a). Accelerated battery life predictions through synergistic combination of physics-based models and machine learning. Cell. Rep. Phys. Sci. 3, 101023. doi:10.1016/j.xcrp.2022.101023
Kim, S., Yi, Z., Chen, B. R., Tanim, T. R., and Dufek, E. J. (2022b). Rapid failure mode classification and quantification in batteries: A deep learning modeling framework. Energy Storage Mater. 45, 1002–1011. doi:10.1016/j.ensm.2021.07.016
Knap, V., Stroe, D-I., Purkayastha, R., Walus, S., Auger, D. J., Fotouhi, A., et al. (2018). Reference performance test methodology for degradation assessment of lithium-sulfur batteries. J. Electrochem. Soc. 165, A1601–A1609. doi:10.1149/2.0121809jes
Kunz, M. R., Dufek, E. J., Yi, Z., Gering, K. L., Shirk, M. G., Smith, K., et al. (2021). Early battery performance prediction for mixed use charging profiles using hierarchal machine learning. Batter Supercaps 4, 1186–1196. doi:10.1002/batt.202100079
Morrison, J. L., Hunt, G. L., Marts, D. J., and Motloch, C. G. (2001). Uncertainty study of INEEL EST laboratory battery testing systems, volume 1: Background and derivation of uncertainty relationships, Idaho national engineering and environmental laboratory external report INEEL/EXT-01-00505. Idaho Falls, Idaho: Idaho National Engineering and Environmental Laboratory Bechtel BWXT Idaho, LLC.
Ng, M.-F., Zhao, J., Yan, Q., Conduit, G. J., and Seh, Z. W. (2020). Predicting the state of charge and health of batteries using data-driven machine learning. Nat. Mach. Intell. 2, 161–170. doi:10.1038/s42256-020-0156-7
Qian, K., Huang, B., Ran, A., He, Y.-B., Li, B., and Kang, F. (2019). State-of-health (SOH) evaluation on lithium-ion battery by simulating the voltage relaxation curves. Electrochim Acta 303, 183–191. doi:10.1016/j.electacta.2019.02.055
Severson, K. A., Attia, P. M., Jin, N., Perkins, N., Jiang, B., Yang, Z., et al. (2019). Data-driven prediction of battery cycle life before capacity degradation. Nat. Energy 4, 383–391. doi:10.1038/s41560-019-0356-8
USABC (2015). Battery test manual for electric vehicles. Detroit, Michigan: United States Advanced Battery Consortium. Revision 3.
Appendix
Maccor “37 A” Specifications (4,000 Series):
Current Range +—500 mA Accuracy +/− 0.025% FS.
Current Range +/−5 A Accuracy +/− 0.025% FS.
Current Range +/−50 A Accuracy +/− 0.025% FS.
Voltage Range 5 V Accuracy +/− 0.02% FS.
Maccor ‘21’ Specifications (4,000 Series):
Current Range +/−30 A Accuracy +/− 0.025% FS.
Voltage Range 5 V Accuracy +/− 0.02% FS.
Keywords: lithium-ion battery, data uncertainty, cycle-by-cycle data, cell polarization, differential analysis
Citation: Gering KL, Shirk MG, Kim S, Walker CM, Dufek EJ and Wang Q (2023) Battery data integrity and usability: Navigating datasets and equipment limitations for efficient and accurate research into battery aging. Front. Energy Res. 11:1125175. doi: 10.3389/fenrg.2023.1125175
Received: 16 December 2022; Accepted: 06 March 2023;
Published: 20 March 2023.
Edited by:
Federico Bella, Polytechnic University of Turin, ItalyReviewed by:
Judith Jeevarajan, UL Research Institutes, United StatesDavide Papurello, Polytechnic University of Turin, Italy
Copyright © 2023 Gering, Shirk, Kim, Walker, Dufek and Wang. This is an open-access article distributed under the terms of the Creative Commons Attribution License (CC BY). The use, distribution or reproduction in other forums is permitted, provided the original author(s) and the copyright owner(s) are credited and that the original publication in this journal is cited, in accordance with accepted academic practice. No use, distribution or reproduction is permitted which does not comply with these terms.
*Correspondence: Kevin L. Gering, S2V2aW4uR2VyaW5nQGlubC5nb3Y=