 Wengang Chen1
 Hongying He
 Diansheng Luo
94% of researchers rate our articles as excellent or good
Learn more about the work of our research integrity team to safeguard the quality of each article we publish.
Find out more
BRIEF RESEARCH REPORT article
Front. Energy Res. , 16 March 2023
Sec. Process and Energy Systems Engineering
Volume 11 - 2023 | https://doi.org/10.3389/fenrg.2023.1123558
This article is part of the Research Topic Advanced Technologies for Planning and Operation of Prosumer Energy Systems, volume II View all 30 articles
Solar photovoltaic power generation has the characteristics of intermittence and randomness, which makes it a challenge to accurately predict solar power generation power, and it is difficult to achieve the desired effect. Therefore, by fully considering the relationship between power generation data and climate factors, a new prediction method is proposed based on sliced bidirectional long short term memory and the attention mechanism. The prediction results show that the presented model has higher accuracy than the common prediction models multi-layer perceptron, convolution neural network, long short term memory and bidirectional long short term memory. The presented sliced bidirectional cyclic network has high prediction accuracy by low root mean square error and mean absolute error of 1.999 and 1.159 respectively. The time cost is only 24.32% of that of long short term memory network and 13.76% of that of bidirectional long short term memory network.
With the progress of the society and the development of the times, human beings rely heavily on new renewable energy. In the 21st century, photovoltaic power generation technology has become the fastest developing new energy technology (Bhang et al., 2019). Therefore, solar energy plays an important role in the development of new energy (Manokar et al., 2018). As a new renewable energy power generation method, solar photovoltaic power generation has the advantages of safety, risk-free, environmental protection and no pollution (Sadamoto et al., 2015). However, photovoltaic power generation is susceptible to the spatio-temporal factors such as weather, season and climate (Hu et al., 2021) (Cao et al., 2022), which makes the power generation of photovoltaic power stations unstable. When the grid is connected, its volatility may cause periodic impact on the power grid and lead to the instability of the power grid. Therefore, it is necessary to formulate adjustment and dispatching plan in advance, coordinate multi-energy sources (Zhang et al., 2022) (Sanjari et al., 2020) and reduce equipment standby before the prediction of the generation power, so as to enhance the security and stability of power grid (Han et al., 2022). In order to make full use of solar energy and reduce the impact of photovoltaic power stations when the grid is connected, it is necessary to accurately predict the photovoltaic power generation (Si et al., 2020; Jia et al., 2021).
In recent years, people have put forward many methods for photovoltaic power generation prediction. There are common prediction methods based on mathematical methods such as grey theory, time series analysis (Yan et al., 2021), machine learning methods such as support vector regression and BP neural network (Feng et al., 2015). In addition, environmental information like the weather forecast, the satellite image (Wang et al., 2020) and cloud distribution (Fu et al., 2021) are used to support photovoltaic output prediction. The prediction method based on environmental information can achieve high prediction accuracy (Manokar, 2020; Sasikumar and calorimetry, 2020), but these methods needs the using of satellite cloud map and large climate database which will increase the cost of the prediction (Chai et al., 2019), multi-layer perceptron (MLP) (Zhang, 2020), convolution neural network (CNN) and long short term memory (LSTM) belongs to the deep learning networks. The CNN network mentioned in document (Kim et al., 2019) needs various auxiliary processing for the photovoltaic prediction, and the prediction effect is not very good. Recurrent neural network (RNN) is suitable for dealing with time series sensitive problems (Lecun et al., 1995). Empirical mode decomposition method in literature (Geddes et al., 2020) and wavelet analysis algorithm mentioned in literature (Lee et al., 2005) decompose the original data into sub data to achieve the prediction. But these methods are relatively complex, which may cause feature loss or reconstruction difficulties in the process of data reorganization. The LSTM network proposed in literature (Xin, 2020) is a typical deep learning model. The prediction accuracy of LSTM model in literature (Huang et al., 2020) is relatively good, these methods can meet the requirements of photovoltaic power generation prediction to a certain extent, but the prediction accuracy still needs to improve. Therefore, based on LSTM network, a prediction method combined sliced bidirectional LSTM with the attention mechanism (SBiLSTM + Attention) is proposed. Testing results indicate the presented Sliced BiLSTM greatly improves the training speed, and the application of the attention mechanism effectively improve the prediction accuracy.
Photovoltaic power generation is easily affected by many factors, these factors also affect each other. The most factors like light intensity, ambient temperature, season and wind speed are the most important factors that affect the prediction. The generation power of photovoltaic silicon plate per unit area is determined by Formula 1.
In Formula 1,
Attention mechanism is a mechanism of distributing weight probability, which can selectively obtain useful information and remove redundant information. The attention mechanism applied in this paper can optimize the model and improve in the training. It effectively solves the problem that the prediction model can not learn a reasonable vector representation due to the too long-time series of the input. The structure of attention mechanism adopted is shown in Figure 1,
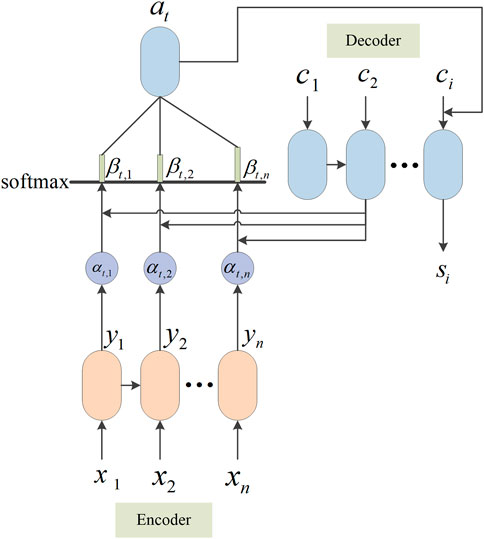
FIGURE 1. Schematic diagram of attention mechanism.
In Figure 1,
The attention score indicates the similarity between the state of the decoder at the previous time and the output of the encoder at present moment. The calculation formula is as follows,
In Formula 3,
The probability distribution equation obtained by softmax conversion of attention score is as follows,
In Formula 4,
The next step is to combine the input of the decoder at the current time with the attention vector to form a new input for decoding. The calculation formula is as follows,
In Formula 5,
The advantage of application of the attention mechanism for the prediction is that the global attention sequence modeling breaks through the limitation of time distance. Therefore, the attention mechanism can be used together with cyclic neural network. First, the attention weight was initialized, historical generating power and total irradiance was set to 30% and 20% respectively, and other influencing factors are set to 10%. Then they will be adaptively adjusted through the training.
The essence of BiLSTM network is to add a hidden layer on the basis of LSTM network. The structure is shown in Figure 2. There are two hidden layers, one in the direction from the front to the back and the other is from the back to the front. There is only one output layer. Both hidden layers point to this output layer. Finally, the data of the two hidden layers are integrated. There is no information interaction between the two hidden layers.
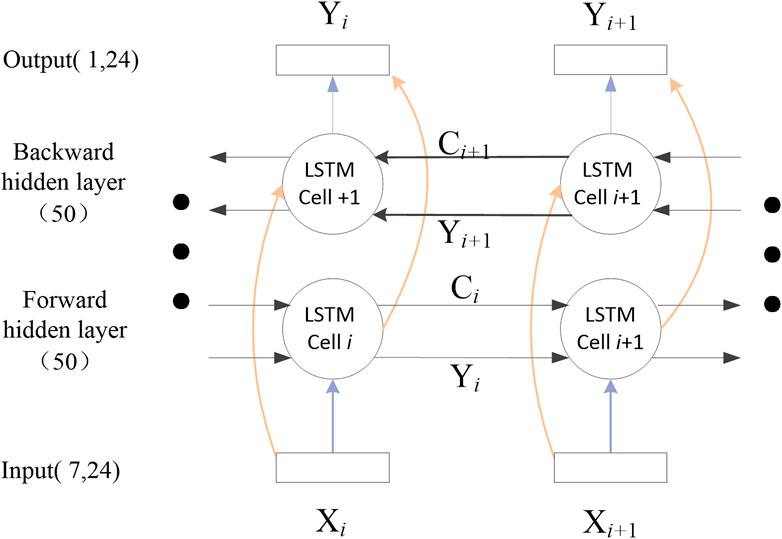
FIGURE 2. The structure diagram of Bidirectional long-term and short-term memory network.
In a normal recurrent neural network, each state depends on the input of the previous state, which makes a lot of time costs on training. In order to decrease the time spending, this paper proposes a new sliced recurrent network structure, as shown in Figure 3,
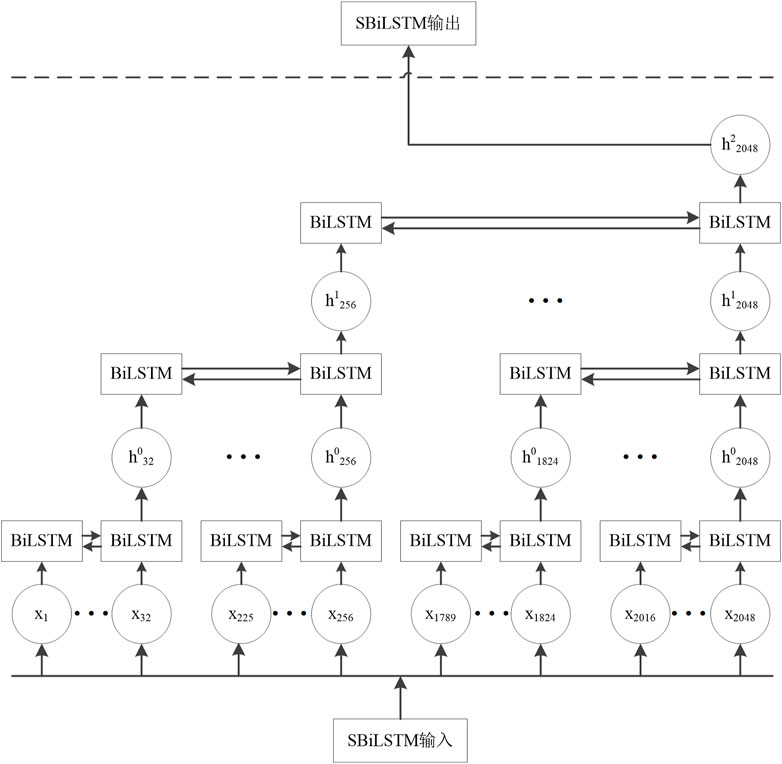
FIGURE 3. The structure of SBiLSTM network.
SBiLSTM + Attention network can divide the input sequence into several small sub-sequences by the same length. The cyclic units on each sub-sequence work at the same time. Slicing a long input sequence into small sequences can greatly reduce the training time. Each sub-sequence is divided into N equal length sequences, and then such divisions are operated K times until the minimum sub-sequence length is appropriate. The k+1 layer network can be obtained through the k times of division. The output of each sub-sequence is merged into a new sequence as the input of the next layer.
In Formula 6, 7,
Taking 2048 input sequences as an example, the sequences are divided into eight sub-sequences twice in total by the presented sliced recurrent network (shown as Figure 3), and the minimum sequence length is 32. Compared with the standard RNN structure, SBiLSTM network can largely reduce the training time. For a network with k+1 layers, the training time formula is as follows,
In Formula 9, r represents the time spent in each cycle unit, T represents the length of the input sequence, n represents the number of divisions, and K represents the number of divisions. The standard RNN network training time is as follows (10),
The superiority on speed of SBiLSTM network over RNN network can be expressed by Formula 11,
In Figure 4, the model structure is divided into three parts. Part A normalizes the PV Plant data collection and divides it into the training set and the testing set. Part B makes use of the attention mechanism, which can reasonably assign the weights of the training set and the test set, adaptively arrange bigger weights to the important influence factors and suppress the weight of unimportant factors. At the same time, the weight matrix W is updated by iteration. Through the automatic adjusting, the information significantly related to the prediction output is allocated big weight and the accuracy of the prediction is improved. Part C is a sliced bidirectional recurrent neural network. In the figure, B represents BiLSTM. The network construction also includes setting the number of hidden layers, training times, adjusting the learning rate, setting the number of divisions N and division times K of the input sequence. The predicted generation power is the output after the training.
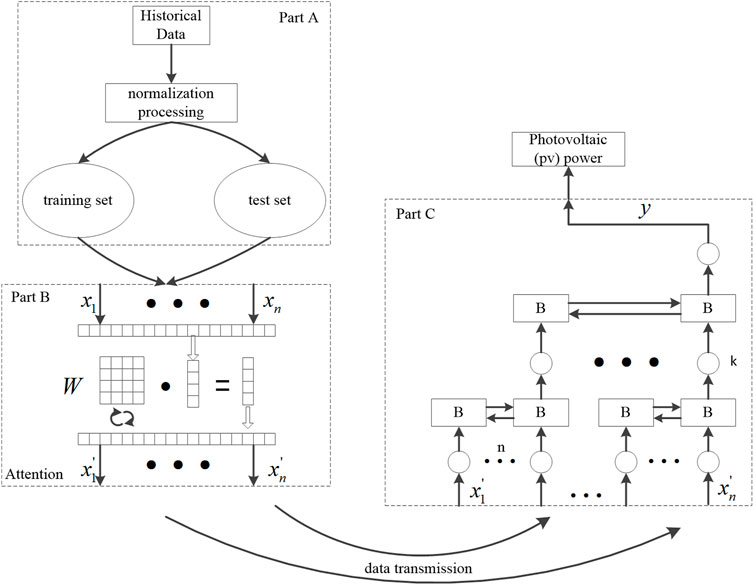
FIGURE 4. Model structure diagram.
The inputs of the prediction model are climate data and historical power generation data, including historical power data, total irradiance, normal direct irradiance, horizontal scattering irradiance, air temperature, air pressure and relative humidity. Similarly, according to the empirical formula and experimental experience, the number of hidden layer nodes of the prediction model is set to 100, the number of iterations is set to 100, and the input sequence is divided twice, each time divide into eight sub-sequences, with a minimum sequence length of 32. An ultra short term power prediction of 15 min after the current moment is obtained by using the historical data 6 h before the prediction. The main processes include data preprocessing, training model and model analysis. The specific steps as follows.
(1) 96 historical photovoltaic data and six historical weather data are used as the input sequence.
(2) The experimental data were normalized.
(3) The prediction model is established. Initialize the network parameters. Using adam optimization algorithm to adjust the learning rate and the number of iterations.
(4) To meet the dimensional requirement of SBiLSTM attention network for input data, the input data is cut.
(5) Selecting 1 month’s historical data as the sample data set, January, July and October include 2976 data sets, and April includes 2880 data sets. In the sample data-set, 500 data are selected as the test set and the rest as the training set.
(6) Compare and analyze the results predicted by the presented model with other models.
The data set used in this paper is provided by the National Institute of Standards and Technology (NIST). The data sampling time is shown in Table 1. The sampling interval is 15 min, and there are 96 data points every day. The required meteorological data are provided by various equipment in the photovoltaic system. The historical data group includes weather data such as power generation data, air temperature, air pressure, relative humidity, total radiance, normal direct irradiance and horizontal scattering irradiance.
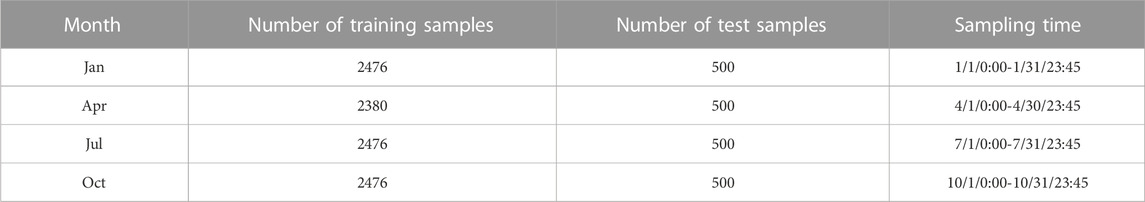
TABLE 1. Date set information.
The data selected in the actual prediction includes historical power generation data and meteorological data. Their units are different and the magnitude is quite different. Because of the characteristics of neurons, the activation function mostly limits the output to [0,1], and the power generation is far greater than this range. In order to reduce the influence of neuron saturation caused by the difference of number size between them, the data is normalized, and the input and the target are limited between [0,1]. The normalization formula is shown in Formula 12,
In Formula 12,
In this paper, the root mean square error (RMSE) is adopted to evaluate the effect of the model, and the formula is shown in (13).
In (13), n is the total amount of data;
At the same time, the error is also calculated by mean absolute error (MAE) through training, shown in Formula 14. The gradient of error is tracked through the training and testing till it reaches the setting value.
Figure 5A shows the comparison of the training loss between the training set and the test set in July. It is obvious from the view of the figure that the two curves are very close when the training times achieve 100, and the training loss of the test set is very low (In Figure 5A, the RMSE value of this model is 1.999 and the MAE value is 1.159.), which indicates that the parameters obtained from the training are very suitable for predicting. Figure 5B is the 15-mintues prediction results, it shows that the prediction curve fits the actual power output generation curve well.
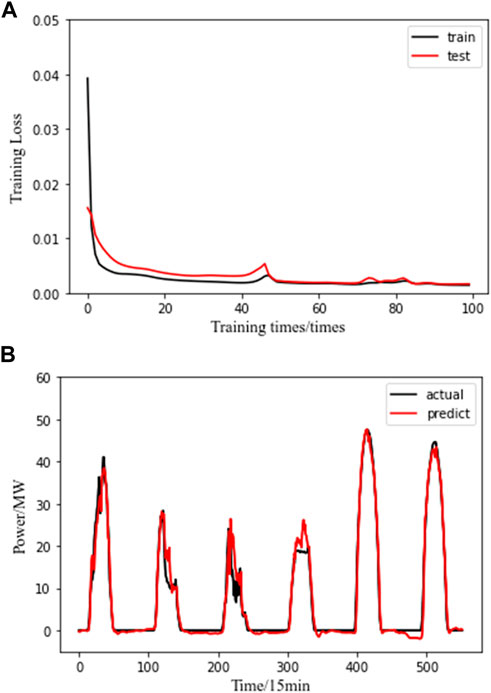
FIGURE 5. Forecast result.
Table 2 lists the comparison of errors predicted by different network models in different months and the total training time.
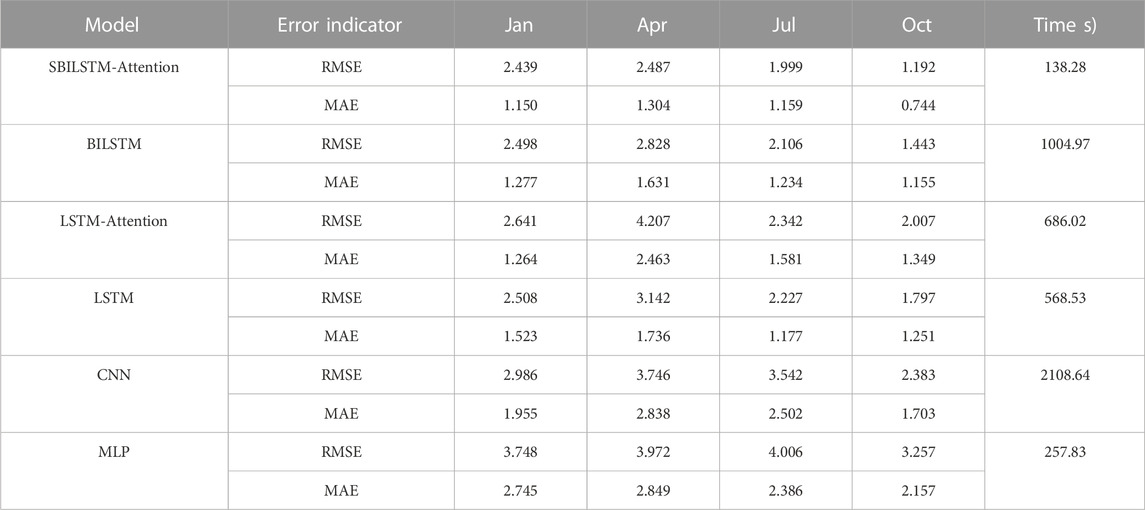
TABLE 2. Summary of error evaluation indicators.
The prediction effect can be seen intuitively from the table. For ultra short-term prediction, the SBiLSTM attention network model has the smallest prediction error value, followed by the BiLSTM neural network model. The prediction result of the basic CNN network model and MLP network model is very general. The prediction result of the LSTM model with only attention mechanism is far worse than that of the LSTM model with attention mechanism and Bi-direction, which shows that the Bi-direction benefits in optimizing the algorithm and improving the accuracy of the prediction model. The prediction effects of six network models are also compared. The performance of the SBiLSTM attention model proposed in this paper is the best, and the training time of the SBiLSTM attention network model is 13.76% of that of the BiLSTM network model, which shows the effectiveness of the slicing.
Figure 6 lists the final power predictions of different network models in 4 months (January, April, July and October). It can be clearly seen from the figure that the photovoltaic power generation power prediction curve has a certain periodicity, because the light intensity at night is zero, the output of the photovoltaic array is zero, and in the daytime, the power generation of the photovoltaic array will increase with the increase of the light intensity. Among the six models, SBILSTM Attention network model has the best prediction effect. In addition, the error value of different months fluctuates greatly, and the prediction error of all models in October is the smallest. This is because the sample data collected in different months are different, and the weather conditions are also different, resulting in a large fluctuation of the error value predicted in different months.
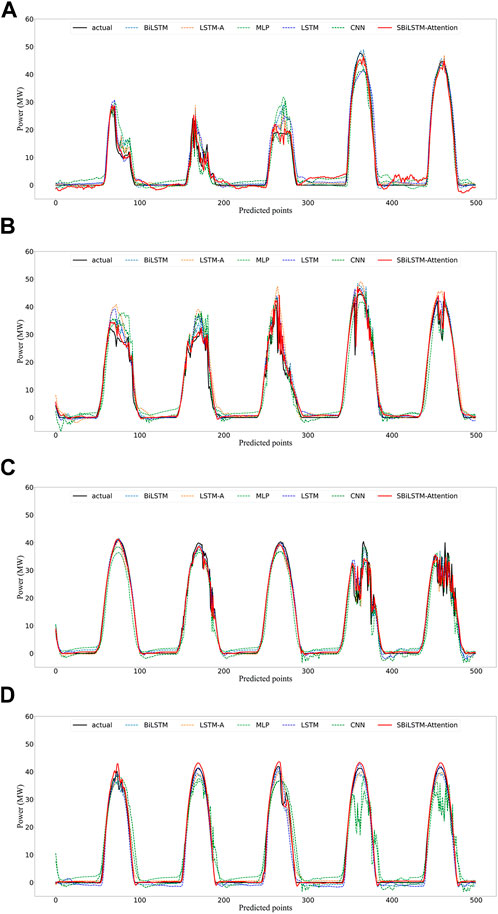
FIGURE 6. Comparison of January, April, July and October forecasts.
Comparing the power prediction comparison of different months by Table 2, the error of July and October is smaller than that of January and April, and their predicted waveform shapes have little difference. However, the wave forms of January and April fluctuate greatly, which indicates that the light intensity of the forecast day in January and April changes greatly. The change of light intensity in July and October is relatively small, thus the daily generating power is relatively stable. The prediction errors based on SBiLSTM attention network model from April 26 to April 30 are listed below. See Table 3 below.
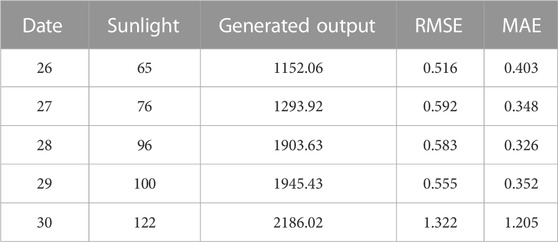
TABLE 3. Comparison diagram of 5-day error model.
On the 28th and 29th, it was cloudy. On the 26th and 27th, the light intensity was weak for light rain weather, and the change of light intensity was small. On the 30th, it was cloudy, and the light intensity was relatively large. However, at noon, affected by clouds and strong winds, the change of light intensity was relatively large. It can be clearly seen from Table 3 that the prediction error on the 30th day is obviously large, which is due to the relatively large change of the sunlight intensity, and the change in sunlight intensity from the 26th to the 29th day is small. Therefore, the SBiLSTM attention network model is very suitable for predicting the weather with stable climate and small change in light intensity throughout the day. However, even if the weather conditions fluctuate greatly, the prediction error is relatively small.
The SBiLSTM-Attention network model presented in this paper applies the slicing idea to the photovoltaic power prediction. Slicing the cyclic neural network shortens the training time and improves the prediction efficiency. The prediction model considers multiple meteorological factors, fully considers and optimizes the over fitting problem brought by neural network, and uses Adam optimization algorithm to adjust the learning rate and iteration times to obtain the best prediction model. The application of attention mechanism and bidirectional mechanism into LSTM can fully adaptive assign weight to the impact factors which improves the prediction accuracy, reduces the dimension of data and optimize the algorithm. Testing results show that the prediction accuracy is high, and the RMSE and MAE is 1.999 and 1.159 respectively, the training time is 24.32% of that of LSTM network and 13.76% of that of BILSTM network. It is not affected by weather fluctuations, even in severe weather and climate fluctuations, the prediction error is relatively small, and the accuracy rate is very high in stable weather.
The raw data supporting the conclusion of this article will be made available by the authors, without undue reservation.
WC and DL contributed to the development and design of the model. JL implemented the programming of the proposed model algorithm. JY collected experimental data. KZ designed the experiment to prove the superiority of the proposed method. All authors wrote parts of the manuscript. All authors have read and agreed to the submission of the manuscript.
The research is supported by the Science and Technology Project of State Grid Shanxi Electric Power Co., LTD., China (No. SGSXJC00YCJS2100679).
WG, JL, JY, and KZ were employed by the company State Grid Jincheng Power Supply Company.
The remaining authors declare that the research was conducted in the absence of any commercial or financial relationships that could be construed as a potential conflict of interest.
All claims expressed in this article are solely those of the authors and do not necessarily represent those of their affiliated organizations, or those of the publisher, the editors and the reviewers. Any product that may be evaluated in this article, or claim that may be made by its manufacturer, is not guaranteed or endorsed by the publisher.
Bhang, B. G., Lee, W., Kim, G. G., Choi, J. H., Park, S. Y., and Ahn, H.-K. (2019). Power performance of bifacial c-Si PV modules with different shading ratios. IEEE J. Photovoltaics 9, 1413–1420. doi:10.1109/jphotov.2019.2928461
Cao, Y., Zhou, B., Chung, C. Y., Shuai, Z., Hua, Z., and Sun, Y. (2022). Dynamic modelling and mutual coordination of electricity and watershed networks for spatio-temporal operational flexibility enhancement under rainy climates. IEEE Trans. Smart Grid, 1–1. doi:10.1109/tsg.2022.3223877
Chai, M., Xia, F., Hao, S., Peng, D., Cui, C., and Liu, W. (2019). PV power prediction based on LSTM with adaptive hyperparameter adjustment. IEEE Access 7, 115473–115486. doi:10.1109/access.2019.2936597
Feng, C., Wang, R., Bian, Z., Doiron, T., and Hu, J. (2015). Memory dynamics and transmission performance of bundle protocol (BP) in deep-space communications. IEEE Trans. Wirel. Commun. 14, 2802–2813. doi:10.1109/twc.2015.2394397
Fu, Y., Chai, H., Zhen, Z., Wang, F., Xu, X., Li, K., et al. (2021). Sky image prediction model based on convolutional auto-encoder for minutely solar PV power forecasting. IEEE Trans. Industry Appl. 57, 3272–3281. doi:10.1109/tia.2021.3072025
Geddes, J., Mehlsen, J., and Olufsen, M. S. (2020). Characterization of blood pressure and heart rate oscillations of POTS patients via uniform phase empirical mode decomposition. IEEE Trans. Biomed. Eng. 67, 3016–3025. doi:10.1109/TBME.2020.2974095
Han, H., Liu, H., Zuo, X., Shi, G., Sun, Y., Liu, Z., et al. (2022). Optimal sizing considering power uncertainty and power supply reliability based on LSTM and MOPSO for SWPBMs. IEEE Syst. J. 16, 4013–4023. doi:10.1109/jsyst.2021.3137856
Hu, W., Zhang, X., Zhu, L., and Li, Z. (2021). Short-term photovoltaic power prediction based on similar days and improved SOA-DBN model. IEEE Access 9, 1958–1971. doi:10.1109/access.2020.3046754
Huang, D., Zhang, C., Li, Q., Han, H., Huang, D., Li, T., et al. (2020). “Prediction of solar photovoltaic power generation based on MLP and LSTM neural networks,” in Proceedings of the 2020 IEEE 4th Conference on Energy Internet and Energy System Integration (EI2), 2744–2748.October 2020 Wuhan, China. doi:10.1109/ei250167.2020.9347223
Jia, P., Zhang, H., Liu, X., and Gong, X. (2021). Short-term photovoltaic power forecasting based on VMD and ISSA-GRU. IEEE Access 9, 105939–105950. doi:10.1109/access.2021.3099169
Kim, J., Nguyen, A. D., and Lee, S. (2019). Deep CNN-based blind image quality predictor. IEEE Trans. Neural Netw. Learn Syst. 30, 11–24. doi:10.1109/TNNLS.2018.2829819
Lecun, Y., Bengio, Y. J. H. O. B. T., and Networks, N. (1995).Convolutional networks for images, speech, and time-series Proceedings of the Handbook of Brain Theory and Neural Networks.Cambridge, MA, USA January 1995
Lee, S., Ibey, B. L., Xu, W., Wilson, M. A., Ericson, M. N., and Cote, G. L. (2005). Processing of pulse oximeter data using discrete wavelet analysis. IEEE Trans. Biomed. Eng. 52, 1350–1352. doi:10.1109/TBME.2005.847538
Manokar, A. M. J. D. P. (2020). Experimental study on effect of different mass flow rate in an inclined solar panel absorber solar still integrated with spiral tube water heater.Desalination Water Treat. 176:285–291. doi:10.5004/dwt.2020.25531
Manokar, A. M., Winston, D. P., Kabeel, A. E., and Sathyamurthy, R. (2018). Sustainable fresh water and power production by integrating PV panel in inclined solar still. J. Clean. Prod. 172, 2711–2719. doi:10.1016/j.jclepro.2017.11.140
Sadamoto, T., Ishizaki, T., Koike, M., Ueda, Y., and Imura, J. I. (2015). Spatiotemporally multiresolutional optimization toward supply-demand-storage balancing under PV prediction uncertainty. IEEE Trans. Smart Grid 6, 853–865. doi:10.1109/tsg.2014.2377241
Sanjari, M. J., Gooi, H. B., and Nair, N. K. C. (2020). Power generation forecast of hybrid PV–wind system. IEEE Trans. Sustain. Energy 11, 703–712. doi:10.1109/tste.2019.2903900
Sasikumar, C. M., Muthuvimala, A., Winston, M., Kabeel, D., Sathyamurthy, A. E., Ravishankarchamkha, J., and Chamkha, I. J. (2020). Journal of thermal analysis and calorimetry. in Experimental studies on passive inclined solar panel absorber solar still,Springer Berlin, Germany139.
Si, Z., Yang, M., Yu, Y., Ding, T., and Li, M. (2020). “A hybrid photovoltaic power prediction model based on multi-source data fusion and deep learning,” in Proceedings of the 2020 IEEE 3rd Student Conference on Electrical Machines and Systems (SCEMS)),December 2020, Jinan, China. 608–613. doi:10.1109/scems48876.2020.9352398
Wang, C., Lu, X., Zhen, Z., Wang, F., Xu, X., and Ren, H. (2020). “Ultra-short-term regional PV power forecasting based on fluctuation pattern recognition with satellite images,” in Proceedings of the 2020 IEEE 3rd Student Conference on Electrical Machines and Systems (SCEMS)),December 2020, Jinan, China. 970–975. doi:10.1109/scems48876.2020.9352318
Xin, W. (2020). “Forecast of photovoltaic generated power based on WOA-LSTM,” in Proceedings of the 2020 5th International Conference on Mechanical, Control and Computer Engineering (ICMCCE)),December 2020 Harbin, China 1143–1147. doi:10.1109/icmcce51767.2020.00251
Yan, J., Hu, L., Zhen, Z., Wang, F., Qiu, G., Li, Y., et al. (2021). Frequency-domain decomposition and deep learning based solar PV power ultra-short-term forecasting model. IEEE Trans. Industry Appl. 57, 3282–3295. doi:10.1109/tia.2021.3073652
Zhang, D. A. S., Ye, J., and Entezami, M.EDWARD AND YE, JIAQI AND ENTEZAMI, MANI AND ROBERTS (2020). Roller bearing degradation assessment based on a deep MLP convolution neural network considering outlier regions. IEEE Trans. Instrum. Meas. 69, 2996–3004. doi:10.1109/TIM.2019.2929669
Keywords: photovoltaic power generation system, power prediction, sliced recurrent network, bidirectional long short term memory, attention mechanism
Citation: Chen W, He H, Liu J, Yang J, Zhang K and Luo D (2023) Photovoltaic power prediction based on sliced bidirectional long short term memory and attention mechanism. Front. Energy Res. 11:1123558. doi: 10.3389/fenrg.2023.1123558
Received: 14 December 2022; Accepted: 01 March 2023;
Published: 16 March 2023.
Edited by:
Jian Zhao, Shanghai University of Electric Power, ChinaReviewed by:
Shouxiang Li, Beijing Institute of Technology, ChinaCopyright © 2023 Chen, He, Liu, Yang, Zhang and Luo. This is an open-access article distributed under the terms of the Creative Commons Attribution License (CC BY). The use, distribution or reproduction in other forums is permitted, provided the original author(s) and the copyright owner(s) are credited and that the original publication in this journal is cited, in accordance with accepted academic practice. No use, distribution or reproduction is permitted which does not comply with these terms.
*Correspondence: Diansheng Luo, MTUzODEzMTg0NUBxcS5jb20=; Hongying He, bGh4MjAwNzAzMjJAc2luYS5jb20=
Disclaimer: All claims expressed in this article are solely those of the authors and do not necessarily represent those of their affiliated organizations, or those of the publisher, the editors and the reviewers. Any product that may be evaluated in this article or claim that may be made by its manufacturer is not guaranteed or endorsed by the publisher.
Research integrity at Frontiers
Learn more about the work of our research integrity team to safeguard the quality of each article we publish.