 Aqsa Ayub1
 Syed Fahad Ali Shah2
 Muhammad Abdul Qyyum3Dur-e-Yab Habib1Malik Ashir Murtaza1
 Mohammad Rehan4Meisam Tabatabaei5,6Mortaza Aghbashlo7Muhammad Waqas8
 Abdul-Sattar Nizami1,4*
- 1Sustainable Development Study Center, Government College University, Lahore, Pakistan
- 2Department of Economics, University of Chitral, KPK, Pakistan
- 3Petroleum and Chemical Engineering Department, College of Engineering, Sultan Qaboos University, Muscat, Oman
- 4Center of Excellence in Environmental Studies (CEES), King Abdulaziz University, Jeddah, Saudi Arabia
- 5Higher Institution Centre of Excellence (HICoE), Institute of Tropical Aquaculture and Fisheries (AKUATROP), Universiti Malaysia Terengganu, Terengganu, Malaysia
- 6Department of Biomaterials, Saveetha Dental College, Saveetha Institute of Medical and Technical Sciences, Chennai, India
- 7Department of Mechanical Engineering of Agricultural Machinery, Faculty of Agricultural Engineering and Technology, College of Agriculture and Natural Resources, University of Tehran, Karaj, Iran
- 8Department of Environmental Sciences, Kohat University of Science and Technology, Kohat, Pakistan
The current study aims to examine the economically viable biomass feedstocks for bioenergy generation and their export potential. The Product Space Model (PSM) is the primary tool used to achieve the aim by accomplishing certain objectives. The study’s findings show that Pakistan has abundant biomass resources for energy production. Canola oil, leather flesh wastes, and poultry fattening show the highest PRODY values, 46,735, 44,438, and 41,791, respectively. These have high-income potential and are considered feasible for export after meeting local energy demand. While goat manure, cashew nutshell, and cotton stalk show lower income potential having values of 3,641, 4,225, and 4,421, respectively. The biowastes having low-income potential are more beneficial to utilize in energy generation plants within the country. The United States is observed to make the most sophisticated products, indicated by an EXPY value of 36296.89. While the minimum level of sophistication is observed for Indonesia, as revealed by its EXPY value of 22235.41 among all considered countries. The PSM policy map analysis of the current study shows that Pakistan and Argentina are located in the Parsimonious Policy quadrant, suggesting shifting toward unexploited products closely related to the existing export baskets. Although the United States, China, India, Indonesia, and Brazil are found in the most desired Let-it-be Policy quadrant. They have more room to diversify their industries and enhance their export potential. The study has practical applications in economic, social, and environmental perspectives, focusing on economic, clean, and sufficient energy. Furthermore, exportable biomass feedstocks are identified to strengthen the economy. Further research must be conducted to evaluate other indicators of the PSM to explore the proximity aspect of PSM, as it would provide a clearer picture of bioenergy and biomass export prospects.
1 Introduction
The environmental factors and exhaustion of conservative fuels indicate a dire need for renewable energy sources to harness sufficient and clean energy using feasible technologies. Global energy requirements will rise by 48% from 2012 to 2040 (Conti et al., 2016). Conversely, non-renewable energy sources will be reduced to 84% in 2040 compared to 91% in 1990. Therefore, the demand for renewable energy sources is predicted to increase from 9% to 16% to meet global energy needs. The increasing energy demand also indicates that renewable energy share in electricity production will decline from 78% to 71% in 2040. Many renewable energy sources can be utilized to extract energy, such as solar, wind, hydro, and biomass. These sources are abundantly available both in developing and developed countries. Furthermore, renewable resources emit almost negligible amounts of carbon compared to hazardous emissions from conventional fuels. Hence, renewable sources are eco-friendly and valuable in combating climate change (Thapar et al., 2016). There are various conversion technologies for biomass bioenergy production, and biochemical conversion has been one of the most effective. With the help of the biochemical conversion method, any organic waste can be converted into biogas. This biogas can be used for cooking, power generation, and many other purposes (Roopnarain & Adeleke, 2017).
Numerous countries have intended to produce biomass in terms of fuel sources. The energy from fuel extracted from biomass considers bioenergy. As biomass is considered a renewable energy resource, it can be utilized as an alternative feedstock for sustainable and green energy production. In ancient times, biomass was eventually used as an energy source in firewood through combustion. Various feedstocks are currently available in industrialized countries for biofuel manufacturing, including forestry residues, agricultural residues, industrial waste, and municipal solid waste (MSW). The biofuels generated by utilizing the feedstock are classified as second-generation biofuels. While the biofuels produced using edible food crops, including sugarcane, corn, wheat, coconut, sunflower, and soya bean, belong to first-generation biofuels. Lignocellulosic materials, including wood, jatropha, straw, and biomass residues, produce these biofuels (Naik et al., 2010; Sims et al., 2010). Therefore, biofuel production can tackle the waste disposal issue from biomass residue.
Biomass residues can be classified into primary, secondary, and tertiary groups. The leftovers of main food crops and forest products are primary residues (corn stalks, stems, leaves, and straw). In contrast, the biomass waste produced during the processing of food crops for other valuable products is secondary biomass residues (woodchips, coffee husk, rice hulls, and sugarcane bagasse). Municipal solid waste can be described as tertiary biomass residue produced when humans or animals consume the biomass-derived product (Chen et al., 2015). Waste cooking oil is also an efficient example of tertiary biomass residue. Therefore, agricultural residues and waste cooking oil seem promising for bioenergy production among all biomass residues.
Livestock is considered an essential source of biomass residue in animal manure, which could be used for biogas synthesis through anaerobic digestion. This biogas may be employed to produce electricity for the farm. Therefore, this practice is both economically and ecologically viable. Various studies in the United States revealed that around 60 million tons of manure could be adapted to generate bioenergy in 2030. Additionally, China is a chief producer of wheat, rice, and corn. Hence, China is one of those countries that can produce bioenergy by utilizing an enormous amount of available resources. It can significantly reduce the use of coal for energy generation (Mohammed et al., 2018). There are different conversion technologies present to convert biowaste into bioenergy. Some are biochemical processes, while others are thermochemical, such as gasification, pyrolysis, and combustion. Transesterification and anaerobic digestion are biochemical processes.
The bioenergy economic potential is mainly assessed by technology and fuel expenditures. Moreover, it includes the financial issues that a particular region faces (Portugal-Pereira et al., 2015). Limited technologies are available in underdeveloped countries, and electricity is comparatively expensive because of the lack of modern technologies. Conversely, the feedstock cost is lower for agricultural countries with abundant biomass, reducing overall cost. Hence, bioenergy is more feasible for agricultural economies than fossil fuels (Paolotti et al., 2017). Brazil is also one of those countries having advantageous conditions and large amounts of biomass resources to increase biofuel production. Brazil has been characterized as a global giant due to the great potential for biofuel feedstocks that can enhance its production levels further. The country is significant in bioenergy generation as it has the potential to synthesize plantation crops such as sugarcane, the primary feedstock for bioethanol (Welfle, 2017). In addition, Brazil can enhance biomass residue production by utilizing vast areas of arable savannas for crop cultivation without compromising forest deterioration (Welfle, 2016).
Forest biomass can generate bioenergy, which is abundantly present in Indonesia. This forest biomass resource can economically benefit bioenergy production through various conversion technologies. In 2013, Indonesia was found to have 132 PJ of potential biomass resources available to convert into bioenergy. Approximately 50.4% and 49.6% could be generated from harvesting residues and wood processing residual materials, respectively. Using forest biomass for bioenergy would generate revenue for the country. It would also aid in poverty alleviation through a noticeable reduction in import bills (Simangunsong et al., 2017). This study aims to evaluate economically feasible biomass feedstocks in all considered biomass-enriched countries using the Product Space Model (PSM). The potent feedstocks for bioenergy production are analyzed and identified by PSM, illustrating a global network of exportable products depending on their resemblances. In addition, it identifies the relation among different products produced by a country. This analysis also indicates the income potential associated with specific products. Furthermore, it describes the sophistication level of a country’s export basket and associated economic benefits.
2 Methodology
The PSM is a novel economic model with a strong explanatory power that can appraise the income potential and sophistication at the country and product levels. Initially, PSM measures the product level sophistication of the globally exportable products and then measures a country’s total sophistication level by assessing its export basket. In other words, it assesses a country’s production capacity or total capability set. Once a country-level sophistication is calculated, it identifies and prioritizes the unexploited feasible products and sectors within the country’s reach. This study employs the PSM approach to assessing the biowaste convergence potential of the selected countries into bioenergy. Figure 1 represents the flow pattern for product sophistication and economic growth analysis using PSM.
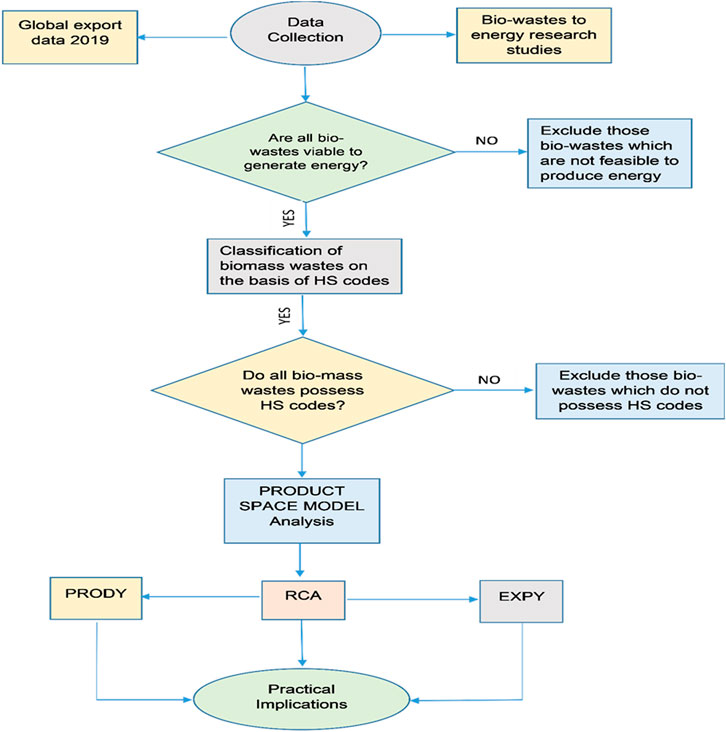
FIGURE 1. Flow pattern for product sophistication and economic growth analysis utilizing PSM.
2.1 Data collection
A detailed literature review was done initially to find the maximum possible biowaste for bioenergy-based research studies. Later, different biomass feedstocks were considered for the proposed study from the collected studies. The 25 biowastes and seven biomass-enriched countries were selected. The countries were nominated depending on their biowaste export share. In the next phase, these biomass feedstocks were assigned Harmonized System (HS) codes from the HS-6 digit code list in 2019. Only those biowastes considered for this study which have HS codes. The HS-code list was downloaded from the UN-Comtrade website, the United Nations international trade database for all the member countries. There are different categories of trade data, and HS is one of those categories. This database recorded global export as well as import data per annum. The Observatory of Economic Complexity (OEC) extracted global export data in 2019 comprising all exportable products. This data was used as input to calculate PSM indicators.
2.2 Data processing tool
The PSM was employed to assess the feasibility of economically efficient feedstocks for bioenergy production. Significantly, PSM was used as a tool for data processing. PSM is a network of global exportable products that describes the relatedness among various exportable products. It facilitates the formation of a network of related products to encourage industrialization, leading to economic growth. PSM consists of two regions: a core region and the other is known as a peripheral region. The products lying in core region are considered more sophisticated, with technical skills and high-value additions. The products present in the peripheral region are less sophisticated with low-value addition.
Furthermore, the PSM method outlines the paths and relatedness between products. To exemplify, if any country synthesizes product A, its existing production infrastructure facilitates the prediction of whether the country can manufacture product B or not by showing the extent of relatedness between them. It also depends if the products share similar inputs related to productive data in producing those particular products (Hidalgo et al., 2007). Therefore, a product space map of the country reflects future export diversification and economic growth. In addition, numerous international organizations, including World Bank, United Nations, and the OECD (The Organization for Economic Co-operation and Development), have used the PSM technique to evaluate the capability of diverse nations and assist them in exploring new unexploited exports for upcoming feasible industrialization and economic development authenticating its application elsewhere (Hausmann and Klinger, 2008b; Qyyum et al., 2021).
The PSM technique has several indicators: EXPY, path, PRODY, proximity, distance, density, open forest, and strategic value. Calculating the indicators can predict the potential of a country’s predicted export diversification. Each of the indicators provides information regarding different aspects of likely product diversification. The PSM approach revolves around two basic traits: sophistication and distance or proximity. The sophistication can be described as incorporating advanced technical skills and value addition. It was calculated by the PRODY and EXPY using Eqs 1, 2. PRODY measures the sophistication level of a required product, while EXPY refers to the overall sophistication level of the country’s export basket. On the contrary, proximity assesses the distance of the provided product to the existing production capacity and between other products. The present investigation focuses on the sophistication aspect of the PSM approach. This study has used PRODY, EXPY, and Revealed Comparative Advantage (RCA) to appraise the economically efficient biomass feedstocks for bioenergy production.
2.2.1 PRODY
It refers to a product-based indicator that measures the income potential of exportable goods and associates the per capita income of all nations exporting that product. Moreover, it reflects the income potential of a given product by analyzing its sophistication level. The more sophisticated products have high-income potential because of high-value addition (Hausmann and Klinger, 2008a). Generally, developed countries export more sophisticated products and multifaceted attributes, while developing countries export less sophisticated and low-value-added products. It is calculated using the formula given below, where Xc,p is the export of product p by country c, ∑ p Xc,p indicates the total exports of country c, and Yc is the per capita income of country c (Hausmann and Klinger, 2010).
2.2.2 EXPY
It can be described as a country-specific indicator, which depicts the total sophistication level of the export basket in a country. It reveals the extent of value addition in the goods that the country exports. In addition, it denotes the average PRODY value of the country’s exports and the average income linked to it. Therefore, the EXPY is a substantial determinant of predicted economic development (Grancay et al., 2015).
2.2.3 Revealed comparative advantage
It is an index representing a country’s relative merits and demerits in a specific category of goods. It is a ratio between the domestic share of a product and the global share of that product. This index indicates whether a country is an effective exporter of that product or not. It is calculated by the given formula, where the numerator denotes the product p’s share in the country c’s overall exports, while the denominator symbolizes the product p’s share in the worldwide exports (Balassa, 1965). A higher domestic share depicts that the country is a viable product exporter.
3 Results and discussion
This study analyzed biomass-enriched countries and assessed their economic development and exporting diversification prospects using PSM indicators. Figure 1 validates the flow pattern of analysis using the PSM method. Three PSM indicators were calculated in this study, including RCA, PRODY, and EXPY, by using Eqs 1–3, respectively.
3.1 Product sophistication analysis
PRODY is an indicator that determines the potential income generation of different products. Biomass-enriched countries are supposed to produce extensive biowastes, which can benefit their growing economy, particularly for a developing country. The 25 biowastes were considered for this study. The PRODY of all biowastes was calculated to appraise their income potential biowaste. According to the findings, some biowastes have higher PRODY values than others. Therefore, all the considered biowastes are categorized into three groups according to their PRODY values as Low-Income Potential (LIP), Medium-Income Potential (MIP), and High-Income Potential (HIP) in Tables 1–3, respectively. biowaste.
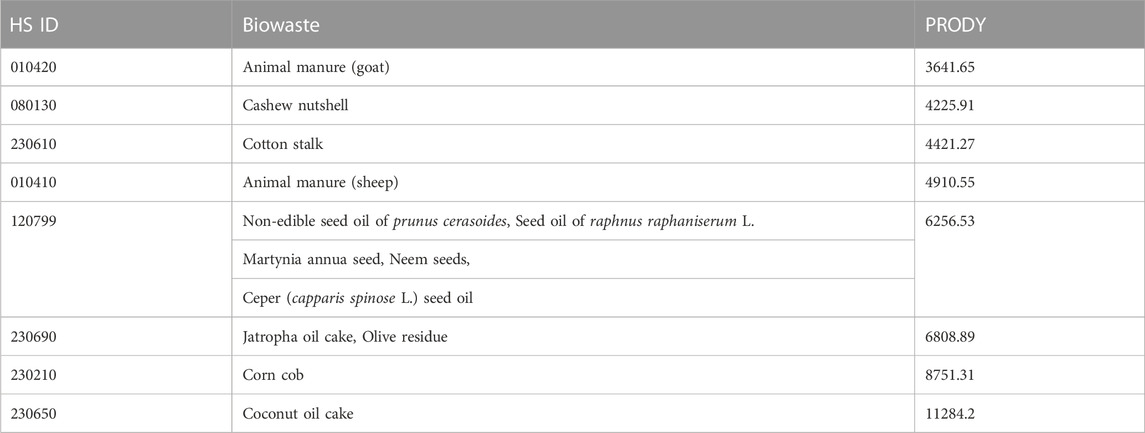
TABLE 1. Low-Income Potential (LIP).
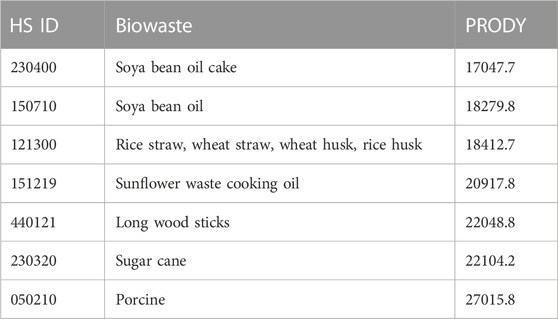
TABLE 2. Medium-Income Potential (MIP).
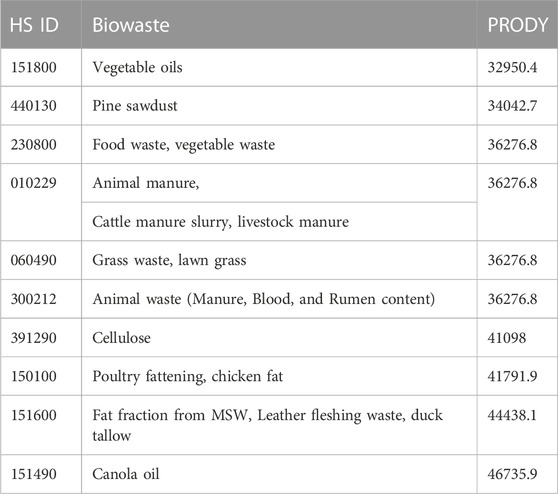
TABLE 3. High-Income Potential (HIP).
The biowastes showing minimum values of PRODY are placed in (Table 1). The biowastes categorized as Group 1 have PRODY values ranging between 3641.65–11284.2. Therefore, they have lower income potential as well as are the least beneficial in terms of export. The second category consists of the biowastes (Table 2) with PRODY values ranging from 17047.7 to 27015.8, indicating their moderate-income potential. They can be perceived as more advantageous than the previous category due to their higher PRODY values. Finally, the biowastes having the highest income potential among all considered biowastes are placed in Group 3. Their PRODY values range between 32950.4–46735.9 (Table 3). The criteria for categorizing biowastes with low, medium, and high-income potential is presented in Table 4. Among the studied biomass feedstocks, 40% belong to the high-income potential group, while medium and low-income potential groups include 28% and 32%, respectively.
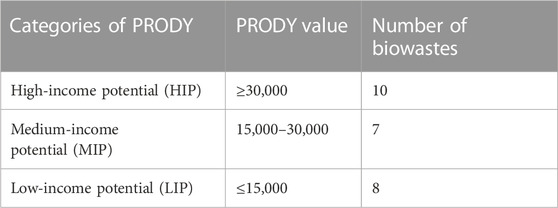
TABLE 4. Biowastes PRODY categorization.
The higher values of HIP products show they can be economically beneficial if exported. Therefore, moderate-income potential biomasses are beneficial both for export and energy generation. Furthermore, low-income potential biomass products are more suitable for energy production within the country. In this way, they can save non-renewable energy costs. This study revealed that the maximum PRODY value was found for canola oil 46,735, and the minimum value of 3,641 was observed for animal manure (goat), as presented in Table 3 and Table 1, respectively. The higher PRODY value of canola oil suggests it has high-income potential and can be exported. While goat manure having the lowest value indicates its low-income potential. Therefore, using it for energy production rather than exporting it can be more beneficial.
3.2 Country-level sophistication
The EXPY value depicts how sophisticated products a country can produce. In addition, it informs the level of incorporation of advanced technologies and skills into the products made by the country. In this study, seven countries were considered, and their EXPY values were calculated using (Eq. (2)) as mentioned in the methodology for 2019. Figure 2 represents the different levels of sophistication for products of different countries.
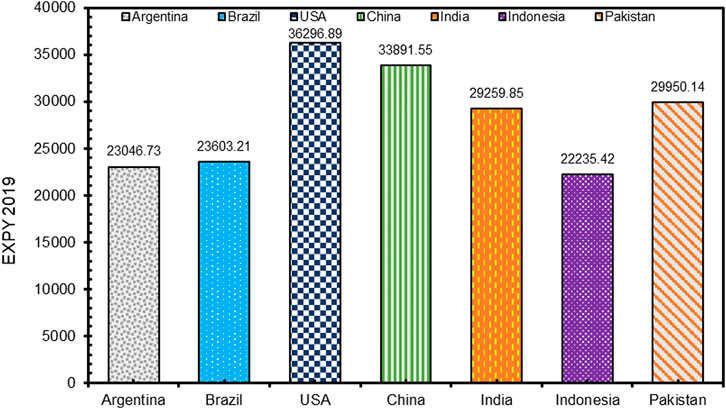
FIGURE 2. EXPY of all the investigated countries in 2019.
Figure 2 shows that USA made the most sophisticated products, indicated by EXPY value 36296.89. While the minimum level of sophistication was observed for Indonesia, as shown by its EXPY value of 22235.41 among all considered countries. A country with higher EXPY value is considered rich in complex productive knowledge and strong economically. Therefore, EXPY was calculated to determine the sophistication level of biomass-enriched countries from 2002 to 2019. The EXPY trends of considered countries are illustrated in Figure 3, it illustrates the progress in sophistication level of a country’s export basket over the years.
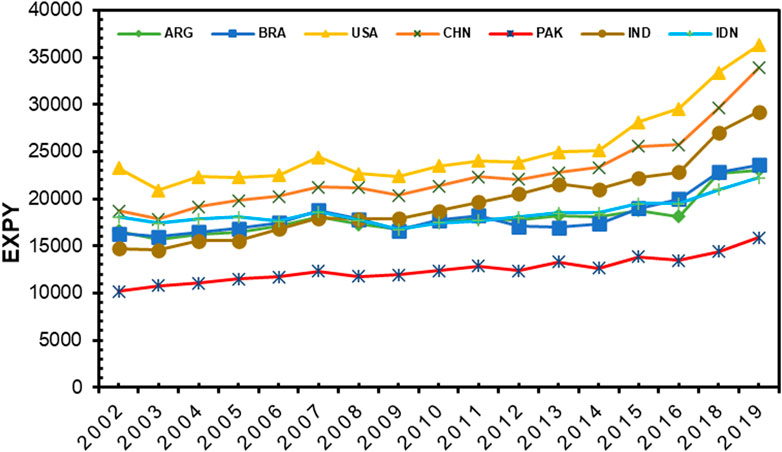
FIGURE 3. EXPY trend of considered countries from 2002 to 2019.
In Figure 3, India’s EXPY experienced extreme growth at 49.76%, followed by China, Pakistan, the United States, Brazil, Argentina, and Indonesia, with a growth rate of 44.78%, 36.03%, 35.86%, 30.86%, 27.94%, and 18.66%, respectively during 2002–2019. Surprisingly, China witnessed a low EXPY growth rate despite being a continuously growing economy. Moreover, despite being a solid economy, the United States has a low EXPY growth rate compared to India, China, and Pakistan, indicating a less accumulation of newer productive knowledge because of the saturation of their unexploited products. On the other hand, the continuous development in a country’s EXPY value is considered a positive signal for economic growth. This issue is because it indicates the constant addition of more advanced skills and technologies in all products a country export. Furthermore, this continuous increase in EXPY’s growth has positive implications for a country’s economy by earning more monetary benefits from more sophisticated products.
3.3 Revealed comparative advantage analysis
The revealed comparative advantage (RCA) value of a product depicts whether a country is a feasible exporter of the given product or not. Having the RCA value for a particular product shows that the country considers an essential exporter. Countries with RCA values greater than 1 are considered efficient product exporters and vice versa. Table 5 presents the RCA values of the studied countries to appraise biowaste’s potential in bioenergy production.
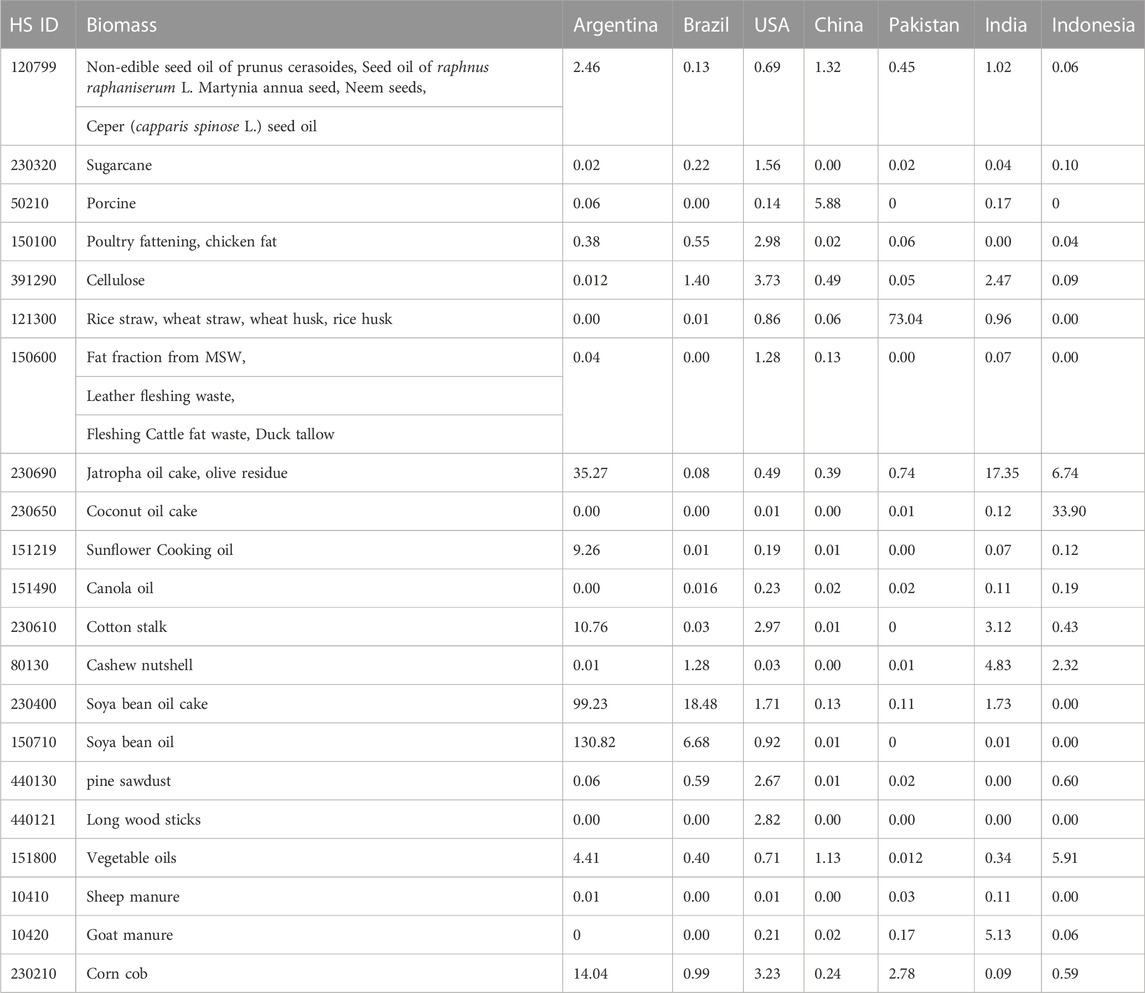
TABLE 5. RCA values of Biowastes for studied countries.
In Table 5, Argentina, China, and India have RCA values of 2.45, 1.32, and 1.02, respectively, for seed, whereas Brazil, the United States, Pakistan, and Indonesia have RCA values of less than 1. Therefore, Argentina, China, and India export non-edible seeds efficiently. The United States is observed as a viable exporter of bagasse due to an RCA of 1.56, while the rest of the studied countries have an RCA of less than 1 for bagasse. Despite the production of large amounts of food waste, it is not exported; therefore, it would be useful to generate energy from it. The United States is also a proactive cellulose exporter, followed by India and Brazil. Interestingly, Pakistan has the highest value of RCA 73.04 for cereal crop waste, including wheat and rice waste. Therefore, cereal waste export is highly beneficial for Pakistan compared to other agricultural countries considered for this study. Furthermore, animal fat, including leather fleshing waste, duck tallow, and cattle fat waste, is also effectively exported by the United States, having a value of 1.28. In contrast, the remaining countries can use their animal fat wastes for energy production to add value.
It is clear from Table 5 that Argentina is the biggest exporter of olive residues among other countries in the present study, followed by India and Indonesia. The reported value of RCA for Argentina is 35.27, whereas the highest value of RCA (33.90) was reported for coconut oil cake in Indonesia. The rest countries have RCA values of less than 1 for coconut oil cake. Waste cooking oil is produced significantly regularly but has no RCA value greater than 1, except for Argentina. The RCA value of waste cooking oil for Argentina is 9.26. Cotton is an essential crop for its use in the textile industry. Therefore, much cotton stalk is produced as biowaste during cotton harvesting. This cotton stalk has the highest value of RCA for Argentina, followed by India and the United States at 10.76, 3.11, and 2.97, respectively, exhibiting their efficiency in exporting cotton stalk.
Soya bean oil and soya bean oil cake can contribute significantly to energy production and a country’s economy by export. The highest RCA (99.23) value was observed for soya bean oil cake in Argentina, followed by Brazil and the United States of America. In the case of soya bean oil, the highest value has been noticed for Argentina, 130.8. Therefore, Argentina is an efficient exporter of soya bean oil and soya bean oil cake. All other countries considered for this study can utilize this waste to aid their energy sector. Argentina and Indonesia are also feasible exporters of vegetable oils indicated by their RCA values. Corn cob, which is also produced in large amounts, is efficiently exported by Argentina owing to the RCA value of 14. Pakistan has an RCA value of 2.77 for corn cob; hence it has great potential to export corn cob.
Agricultural countries are not exporting animal waste and manure, despite their existence in significant quantities. Although many other biowastes mentioned in Table 5 have negligible RCA values, they can be used for energy production to strengthen the economy of countries having these wastes. They can also export energy manufactured by utilization of biowastes.
3.4 Global export value linkage with PRODY
The PRODY value of a product illustrates the total income associated with the export of that product by all countries. Table 6 represents the worldwide export values (million USD) and the biowastes’ PRODY values. Comparing global export values in Table 6 identifies major exportable biowastes among all considered biowastes. For example, soya bean oil cake is the most exportable biowaste. Its global export value is 24,649 million USD, followed by cashew nutshell, soya bean oil, and pine sawdust 7,289, 7,055, and 5,006, respectively. Conversely, the minimum export value is noticed for grass waste at 0.0028, followed by animal manure and food waste at 0.0225 and 0.08, respectively. The biowastes providing higher global income values are more suitable for export than energy production. In contrast, the products with low-income potential value are more suitable for clean energy production.
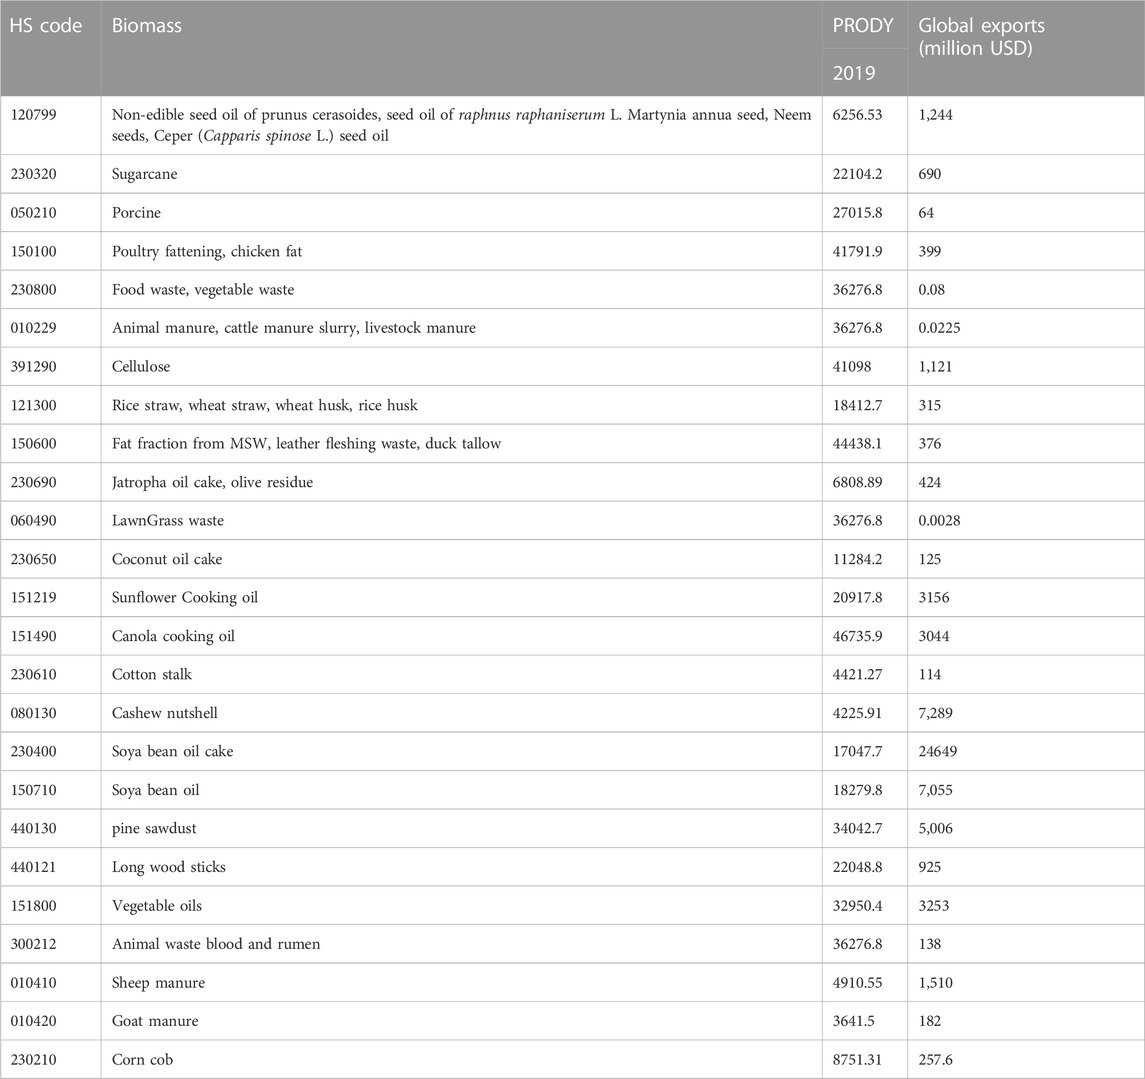
TABLE 6. Global export share of biomass wastes and their PRODY values.
3.5 Policy recommendations for industrialization in the selected countries
Successful industrialization and export diversification need prudent industrial policy geared with the government’s utmost commitment. In this regard, the PSM approach provides an incredibly instrumental tool named “Policy Map Analysis”, which identifies appropriate industrial policy for successful future industrialization considering a country’s current production capacity (Qyyum et al., 2022). For example, in Figure 4, the policy map diagram illustrates the four quadrants with different industrial policies.
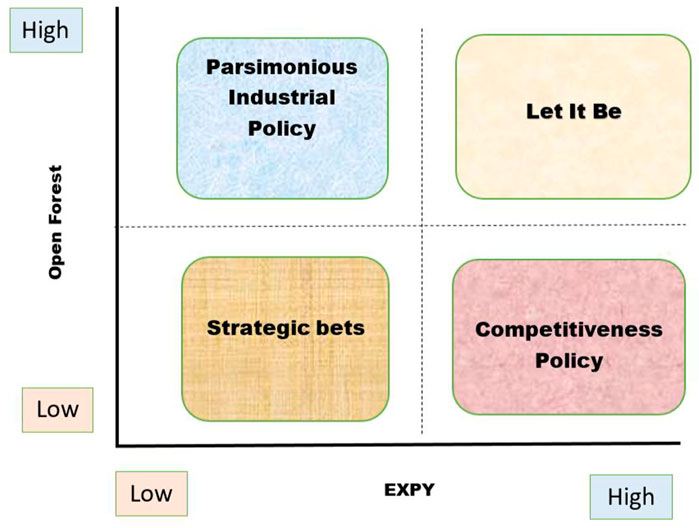
FIGURE 4. Policy Map Diagram for Future Industrialization and export diversification.
In Figure 4, the Policy Map Diagram provides four different industry-level policies for various countries, considering the orientation in the product space. Moreover, the “Strategic-Bets” quadrant presents that the country’s current export is at a low sophistication level in the peripheral region of product space; therefore, the country has limited prospects for future industrialization. The “Competitiveness-policy” quadrant indicates fair opportunities for the countries in this quadrant, where they must focus on improving existing exportable products. While the “Parsimonious-industrial-policy” quadrant shows higher prospects for future industrialization. Countries in this quadrant need to move to unexploited products closely related to current exported products. Finally, the “Let-it-be” quadrant shows the highest prospects for industrialization. Countries in this quadrant are advantageous because of their strong positioning in the product space. Therefore, these countries can move to produce the remaining unexploited products.
The Policy Map diagram depends on the results of two regression models; i) In the first regression model, the EXPY values of selected countries are run on GDP per capita data of the same countries. The obtained residual from the regression is used as the “X-axis” of the Policy Map. ii). In the second regression model, the Open Forest values of the selected countries are run on GDP per capita. The obtained residual from the second regression is used in a “Y-axis” of the policy map. The values used in both regression models are in logs of the 30 selected countries.
In Figure 5, this study’s PSM Policy Map results revealed that the studied countries are located mainly in two quadrants. Pakistan and Argentina are in the Parsimonious Policy quadrant, where they are suggested to start moving to exportable products with higher relevance and proximity to existing products. Therefore, they have a moderate and decent level of opportunities for their future export diversification and industrialization. While the United States, China, India, Indonesia, and Brazil are based in the most desired Let-it-be Policy quadrant. These countries can move to the remaining unexploited products with much ease. These countries must opt for the PSM-suggested industrial policies to scale their industrialization.
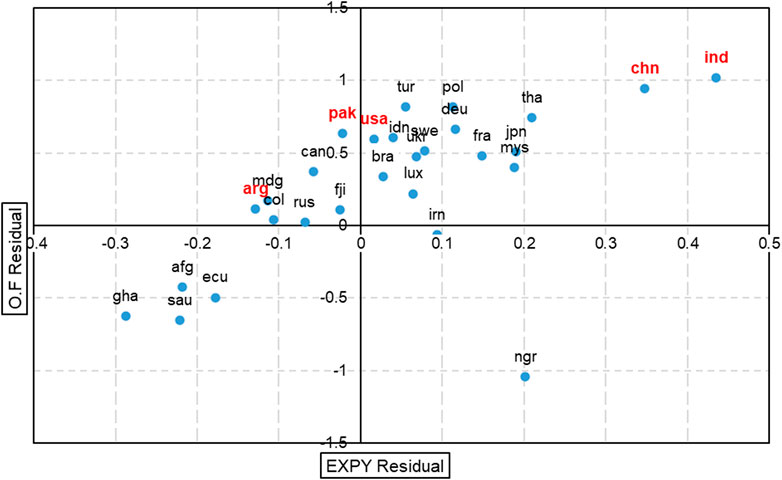
FIGURE 5. PSM, industrial policy map.
3.6 Proximity and sophistication analysis in similar studies
The PSM tool is highly effective for various kinds of analysis, including product value, export expansion, determining the existing capability set of a country, and appropriate directions for future growth. It also has useful applications for assessing different research aspects, such as bioenergy, waste reduction, and economic strength.
PSM was used to estimate the potential of different polymers to produce polymeric membranes, which have beneficial applications in industrial processes and environmental remediation. The study outcomes showed the favorable industrialization prospects for United Kingdom, Italy, Poland, and India revealed by proximity and policy analysis. Canada and Indonesia have intermediary opportunities for progress in their polymer membrane industry, whereas Russia and Saudi Arabia face challenges in utilizing unexploited polymers for membrane production (Khan et al., 2022).
A study conducted by Qyyum et al. (2021) used thePSM to evaluate feasible feedstocks and technologies for hydrogen production, a clean energy source. The availability of feedstocks was analyzed on a global level. The results showed that Natural gas is the most exportable hydrogen feedstock with a high global export value. Natural gas, coal, electrical energy, and nuts are exportable. The products with low-income potential are more suitable for energy production than export. This study evaluated exportable feedstocks only for hydrogen production, while the current study assessed the exportable and feasible feedstocks for the different bioenergy forms, including biogas, biodiesel, and bio-oil. Qyyum et al. (2021) evaluated production sophistication and proximity, while the current study focused on product sophistication. The current study has evaluated the product sophistication of the country’s export basket.
Another study determined the bioenergy production potential of developing countries using the PSM approach. Both sophistication and proximity were measured for considered biowastes, and the study findings showed that Argentina had the most exports (9.59 billion USD) while all the considered biowastes had low-income potential. Thailand was revealed to produce the most sophisticated products, followed by India, Brazil, Ukraine, and Argentina. Adopting bioenergy in Thailand and Ukraine can gain significant monetary benefits (Qyyum et al., 2021). The reported study analyzed the model’s relatedness and value-addition aspects, while the current study focused on sophistication. This study emphasizes the conduction of such research works in the future, which will help the economies achieve their economic growth targets and energy efficiency. The current study is significant in economic analysis because of the ecocentric approach. The studies illustrate the validity of the findings of this study and the dynamic role in policy development.
4 Conclusion
This study used the PSM to show biomass-enriched countries an organized and concise pathway to feasible, viable, and sustainable economic development by exporting biowastes and utilizing them to generate energy. The PSM technology is an excellent tool for assessing exportable products based on sophistication and relatedness. Therefore, this study analyzed the level of sophistication of biomass waste products and their major producer countries. The conclusions of the current study are summarized as follows:
• The United States produced the most sophisticated products, followed by China and India in 2019, while India experienced the highest EXPY growth from 2002 to 2019, followed by China, Pakistan, the United States, Brazil, Argentina, and Indonesia. EXPY growth defines the direction for further progress in the industrial sector of any economy. Producing more sophisticated products and utilizing biowastes can strengthen studied countries’ economies and reduce the cost of fuel importation for energy needs.
• Product level sophistication analysis illustrated that canola oil has the highest income potential among all selected biowastes, and the considered biomass-enriched countries are inefficient exporters of canola oil, indicating the need to explore their growth opportunities. Canola oil was also found to have a fair share of global export income, indicating the potential monetary benefits of its export. Therefore, all the investigated countries must export canola oil to boost their economy owing to its high-income prospect.
• RCA findings showed that the United States is an efficient exporter of bagasse because of an RCA of 1.56, while the rest of the studied countries have an RCA of less than 1 for bagasse, presented in the results section. Therefore, bagasse can be a valuable feedstock for bioenergy production in these countries because of the large amounts produced there.
• Soya bean oil cake is the most exportable biomass feedstock indicated by the global export value. Therefore, it predicts a substantial benefit for countries having higher production of soya bean oil cake.
• Agricultural countries are not exporting animal waste and manure, despite their existence in significant quantities. Although many other biowastes considered in this research have non-significant RCA values, they can be used for energy production to strengthen the economy of countries having these wastes. They can also export energy manufactured by biowaste utilization.
• PSM policy map analysis revealed that of the studied countries, Pakistan and Argentina are in the Parsimonious quadrant of the Policy Map, with moderate opportunities for future industrialization. However, they must move towards unexploited products closely connected to the current exports.
• The United States of America, China, India, Indonesia, and Brazil are in the most desired Let-It-be quadrant of the policy map, where they can be moved in every direction to explore unexploited materials for industrial growth. They have ample space to diversify their export basket and product line.
4.1 Future directions/recommendations
This research assessed the bioenergy and biomass export potential for selected countries. Other countries with weak economies and energy crises must be analyzed using the PSM tool. It would provide suitable industrial growth directions to resolve the issues mentioned. Non-exportable biomass feedstocks were not included in the analysis, and therefore suitable methodologies must explore their local energy potential. Moreover, proximity analysis must be carried out in further research works.
Author contributions
AA: Data curation, Writing—original draft, Conceptualization, Investigation. SA: Formal Analysis, Validation. MQ: Validation, Visualization, Review and Editing Resources, Conceptualization. D-e-YH: Formal Analysis, Visualization. MM: Formal Analysis, Visualization. MR: Review and Editing Resources. MT: Formal Analysis, Validation. MA: Formal Analysis, Validation. MW: Writing-review and editing. A-SN: Supervision, Formal Analysis, Writing-review and editing, Conceptualization.
Conflict of interest
The authors declare that the research was conducted in the absence of any commercial or financial relationships that could be construed as a potential conflict of interest.
Publisher’s note
All claims expressed in this article are solely those of the authors and do not necessarily represent those of their affiliated organizations, or those of the publisher, the editors and the reviewers. Any product that may be evaluated in this article, or claim that may be made by its manufacturer, is not guaranteed or endorsed by the publisher.
Abbreviations
HIP, High-Income Potential; HS, Harmonized System; LIP, Low-Income Potential; MIP, Medium-Income Potential; OEC, Observatory of Economic Complexity; OECD, The Organization for Economic Co-operation and Development; PSM, Product Space Model; RCA, Revealed Comparative Advantage; UN, United Nations.
References
Balassa, B. (1965). Trade liberalisation and revealed comparative advantage. Manch. Sch. 33 (2), 99–123. doi:10.1111/j.1467-9957.1965.tb00050.x
Chen, D., Yin, L., Wang, H., and He, P. (2015). Reprint of: Pyrolysis technologies for municipal solid waste: A review. Waste Manag. 37, 116–136. doi:10.1016/j.wasman.2015.01.022
Conti, J., Holtberg, P., Diefenderfer, J., LaRose, A., Turnure, J. T., and Westfall, L. (2016). International energy outlook 2016 with projections to 2040. Washington, DC, United States: USDOE Energy Information Administration.
Grancay, M., Grancay, N., and Dudas, T. (2015). What you export matters: Does it really? Contemp. Econ. 9 (2), 233–244. doi:10.5709/ce.1897-9254.169
Hausmann, R., and Klinger, B. (2008a). Achieving export-led growth in Colombia. CID Working Paper Series.
Hausmann, R., and Klinger, B. (2010). Structural transformation in Ecuador. Inter-American Development Bank Policy Brief.
Hausmann, R., and Klinger, B. (2008b). Structural transformation in Pakistan. Cambridge: Center for International Development, Harvard University.
Hidalgo, C., Klinger, B., Barabasi, A.-L., and Hausmann, R. (2007). “The product space and its consequences for economic growth,” in Proceedings of the Paper presented at the APS March Meeting Abstracts, Las Vegas, Nevada, March 5–10, 2023.
Khan, A., Shah, S. F. A., Majeed, K., Hameed, I., Najam, M., Hasan, M., et al. (2022). Polymeric membranes for environmental remediation: A product space model perspective. Chemosphere 304, 135236. doi:10.1016/j.chemosphere.2022.135236
Mohammed, N. I., Kabbashi, N., and Alade, A. (2018). “Significance of agricultural residues in sustainable biofuel development,” in Agricultural waste and residues (London, England.: Intechopen), 71–88.
Naik, S. N., Goud, V. V., Rout, P. K., and Dalai, A. K. (2010). Production of first and second generation biofuels: A comprehensive review. Renew. Sustain. Energy Rev. 14 (2), 578–597. doi:10.1016/j.rser.2009.10.003
Paolotti, L., Martino, G., Marchini, A., and Boggia, A. (2017). Economic and environmental assessment of agro-energy wood biomass supply chains. Biomass bioenergy 97, 172–185. doi:10.1016/j.biombioe.2016.12.020
Portugal-Pereira, J., Soria, R., Rathmann, R., Schaeffer, R., and Szklo, A. (2015). Agricultural and agro-industrial residues-to-energy: Techno-economic and environmental assessment in Brazil. Biomass bioenergy 81, 521–533. doi:10.1016/j.biombioe.2015.08.010
Qyyum, M. A., Dickson, R., Shah, S. F. A., Niaz, H., Khan, A., Liu, J. J., et al. (2021). Availability, versatility, and viability of feedstocks for hydrogen production: Product space perspective. Renew. Sustain. Energy Rev. 145, 110843. doi:10.1016/j.rser.2021.110843
Qyyum, M. A., Shah, S. F. A., Qadeer, K., Naquash, A., Yasin, M., Rehan, M., et al. (2022). Biowaste to bioenergy options for sustainable economic growth opportunities in developing countries: Product space model analysis and policy map development. Renew. Sustain. Energy Rev. 169, 112832. doi:10.1016/j.rser.2022.112832
Roopnarain, A., and Adeleke, R. (2017). Current status, hurdles and future prospects of biogas digestion technology in Africa. Renew. Sustain. Energy Rev. 67, 1162–1179. doi:10.1016/j.rser.2016.09.087
Simangunsong, B., Sitanggang, V., Manurung, E., Rahmadi, A., Moore, G., Aye, L., et al. (2017). Potential forest biomass resource as feedstock for bioenergy and its economic value in Indonesia. For. Policy Econ. 81, 10–17. doi:10.1016/j.forpol.2017.03.022
Sims, R. E., Mabee, W., Saddler, J. N., and Taylor, M. (2010). An overview of second generation biofuel technologies. Bioresour. Technol. 101 (6), 1570–1580. doi:10.1016/j.biortech.2009.11.046
Thapar, S., Sharma, S., and Verma, A. (2016). Economic and environmental effectiveness of renewable energy policy instruments: Best practices from India. Renew. Sustain. Energy Rev. 66, 487–498. doi:10.1016/j.rser.2016.08.025
Welfle, A. (2017). Balancing growing global bioenergy resource demands-Brazil’s biomass potential and the availability of resource for trade. Biomass Bioenergy 105, 83–95. doi:10.1016/j.biombioe.2017.06.011
Welfle, A. (2016). Exploring the sustainable development opportunities from generating low carbon sustainable energy from brazilian waste and residue biomass resources. Paper presented at the Annals of IV Workshop: Production and Appropriation of New Energy Sources: Effects, Conflicts and Alternatives.
Keywords: biomass, bioenergy, product space model, sustainability, circular economy
Citation: Ayub A, Ali Shah SF, Qyyum MA, Habib D-e-Y, Murtaza MA, Rehan M, Tabatabaei M, Aghbashlo M, Waqas M and Nizami A-S (2023) Sustainable economic growth potential of biomass-enriched countries through bioenergy production: State-of-the-art assessment using product space model. Front. Energy Res. 11:1123262. doi: 10.3389/fenrg.2023.1123262
Received: 13 December 2022; Accepted: 07 March 2023;
Published: 03 April 2023.
Edited by:
Marcin Zieliński, University of Warmia and Mazury in Olsztyn, PolandReviewed by:
Ioana Ionel, Politehnica University of Timișoara, RomaniaMaciej Dzikuć, University of Zielona Góra, Poland
Copyright © 2023 Ayub, Ali Shah, Qyyum, Habib, Murtaza, Rehan, Tabatabaei, Aghbashlo, Waqas and Nizami. This is an open-access article distributed under the terms of the Creative Commons Attribution License (CC BY). The use, distribution or reproduction in other forums is permitted, provided the original author(s) and the copyright owner(s) are credited and that the original publication in this journal is cited, in accordance with accepted academic practice. No use, distribution or reproduction is permitted which does not comply with these terms.
*Correspondence: Abdul-Sattar Nizami, YXNuaXphbWlAZ2N1LmVkdS5waw==