 Chen Qing
 Nengling Tai
 Feilong Fan2*
- 1Department of Electrical Engineering, Shanghai Jiao Tong University, Shanghai, China
- 2College of Smart Energy, Shanghai Jiao Tong University, Shanghai, China
- 3Department of Electrical and Electronic Engineering, The University of Hong Kong, Pokfulam, Hong Kong SAR, China
Increasing operation costs and carbon emissions have brought great challenges to the development of port systems, which are regarded as prosumers that comprise various renewable energy sources and diversiform electric loads. In this paper, an energy transaction framework for the green port with a multiport power electronic transformer (PET) is established to optimize the operation of the port system in day-ahead energy and reserve markets. The market behavior of the port system is formulated as a bi-level stochastic optimization model. The energy source schedule, berth allocation, and quay crane (QC) assignment are optimized to minimize the total operation cost at the upper level, whereas energy and reserve market clearing problems are settled at the lower level. The aforementioned nonlinear bi-level optimization problem is solved as a mathematical program with equilibrium constraints (MPECs). Karush–Kuhn–Tucker conditions and duality theory convert the proposed nonlinear bi-level problem into a linear single-level problem. Numerical simulations show that the proposed strategy can achieve the lowest total operation cost for the green port.
1 Introduction
As world trade and economic globalization develop, ports and their surroundings become crucial energy consumers and pollution sources due to their high-power demands in mechanical devices, shiploads, and logistics processes (Acciaro et al., 2014; Bektas et al., 2019; Fan et al., 2022a). In order to reduce energy consumption and greenhouse gas emissions, full electrification is widely promoted in the ports. Due to the port electrification, the reduction of CO2, SO2, NOx, and black carbon (BC) emissions in ports can be in the range of 48%–70%, 3%–60%, 40%–60%, and 57%–70%, respectively (Zis et al., 2014). As the ports become more electrified, demands on the local electricity network’s infrastructure (Buiza et al., 2015) increase. The electricity networks in the green port consist of AC and DC systems (Thanh et al., 2008). Energy storage, electric vehicles, shore power, and renewable energy power generation units (photovoltaic and wind power) are the main components in the AC and DC systems of the green port.
The future renewable electric energy delivery and management (FREEDM) system proposed a new-type power electronic device called the power electronic transformer (PET) to manage diversiform renewable energy sources (RESs), dispatchable energy resources, energy storage, and shore power connected to the port power system (Heydt, 2010; Huang et al., 2011). The multiport PET has power flow regulation ability and fast response characteristics, which can build flexible pathways between multiple AC and DC systems of different voltage levels, support the flexible access of RESs, and realize the conversion for a larger amount of energy (Li Z. et al., 2018). Rashidi et al. (2019) studied a four-port solid-state transformer and a control scheme to control the power flow and output voltage, and the power references of all ports are determined by the load demand, generation capacity of the distributed generation system, and the state of charge of the energy storage. Yang et al. (2019) proposed an equivalent circuit and mathematical model of the multiport and multi-function power electronic transformer (MPMF-PET)-based mixed AC/DC power grids. A decentralized optimal power flow (OPF) model, considering the multiport coordinated control strategy of PET, for running autonomous AC/DC hybrid microgrids is proposed (Dong et al., 2019). Geng and Hu (2019) studied the OPF for AC and DC grids based on PET and aimed to minimize the generation cost of the system losses. Therefore, the functional characteristics of the PET can perfectly support its application in the green port system.
Based on the PET, more novel technologies, such as smart grids, microgrids, and electrical power distribution systems, should be promoted in green ports (Parise et al., 2016). Roy et al. (2020) listed technological breakthroughs and up-to-date reviews of microgrid development in seaports worldwide. Molavi et al. (2020)evaluated the application of microgrids at ports and the benefits of purposeful planning for microgrid integration through a systematic framework. Iris and Lam (2021) produced an initial baseline plan that includes day-ahead operation and energy management plans considering all port and energy-related parameters with expected RES power generation. In order to achieve sustainable port energy management, renewable DC microgrids should be implemented with appropriate energy storage technologies (Misra et al., 2017). Large ports are regarded as prosumers that comprise a variety of flexible loads and local renewable energy resources (Kanellos, 2017).
Based on the abovementioned studies, logistics systems are the main flexible components in green port electricity networks. The logistics system mainly focuses on the scheduling of berths, quayside cranes, and ships to achieve the optimal logistics cost (Alnaqbi et al., 2016; Idris and Zainuddin, 2016). Iris et al. (2015) proposed novel generalized set partitioning formulations for the berth allocation and quay crane assignment problem (BACAP), considering both time-variant and time-invariant QC assignment policies. Malekahmadi et al. (2020) studied the berthing possibility in terminals depending on water depth and tide conditions. Tan et al. (2021) investigated the automated quay crane scheduling problem (AQCSP) for the automated container terminal considering the trade-off operation efficiency and energy consumption. The aforementioned literature widely discussed the energy management of the green port system and the integrated model for berth allocation, QC assignment, and ship scheduling. However, energy transactions for green port systems in multiple electricity markets, such as energy and reserve markets, are rarely studied in past studies.
The research on multiple electricity markets has been subjected to the wide development of microgrids and smart grids. Energy trading between islanded microgrids is established in a distributed convex optimization framework (Gregoratti and Matamoros, 2015). Li J. et al. (2018) integrated a bilateral energy trading mechanism with the OPF technique to increase economic benefits to individual participants. Meanwhile, they ensured the reliability and security of the system operation. Each microgrid can be an energy provider or a consumer according to its energy generation and local demand (Park et al., 2016). The battery energy storage system (BESS) can provide energy arbitrage and frequency regulation support (Fan et al., 2022b). Shayegan-Rad et al. (2017) assumed that a virtual power plant (VPP) provides the required reserve through its synchronous distributed generation and small pumped storage plant based on the delivery request probability of the day-ahead market. Doostizadeh and Ghasemi (2013) incorporated distributed energy resources along with network constraints and load and wind uncertainties to achieve optimal decisions in day-ahead energy and reserve markets. Guo et al. (2021) proposed a novel joint energy and reserve market where all agents can freely negotiate with neighboring agents over the quantities and prices of energy and reserve. The abovementioned studies mainly focused on operation optimization for common microgrids. The application of green port microgrids in multiple electricity markets was rarely studied.
This study proposes a bi-level stochastic scheduling scheme for the green port considering the multiport PET in day-ahead energy and reserve markets. The main contributions of this work are summarized as follows:
1) A coordinated operation strategy for energy source scheduling, berth allocation, and QC assignment, considering an AC/DC zonal structure of the green port with multiport PET, is proposed.
2) An energy transaction framework for the green port is established to optimize the operation of the port system in day-ahead energy and reserve markets.
3) A bi-level stochastic optimization model is formulated to describe the market behavior of the port system with the consideration of uncertainty. Game theory is applied to solve market clearing problems in multiple markets.
The rest of this study is organized as follows: Section 2 depicts the framework of the proposed problem. Section 3 provides detailed mathematical formulations. In Section 4, case studies are conducted to demonstrate the effectiveness of the model. Conclusions and future works are presented in Section 5.
2 Problem statement
2.1 Structure of the green port with multiport PET
In this paper, the green port consists of gas turbines (GTs), wind generators (WGs), photovoltaics (PVs), BESs, QCs, and ships. The aforementioned devices are connected to the AC and DC ports of the proposed multiport PET system, which reduces the steps of energy conversion and improves energy efficiency. The structure of the green port with multiport PET system is shown in Figure 1.
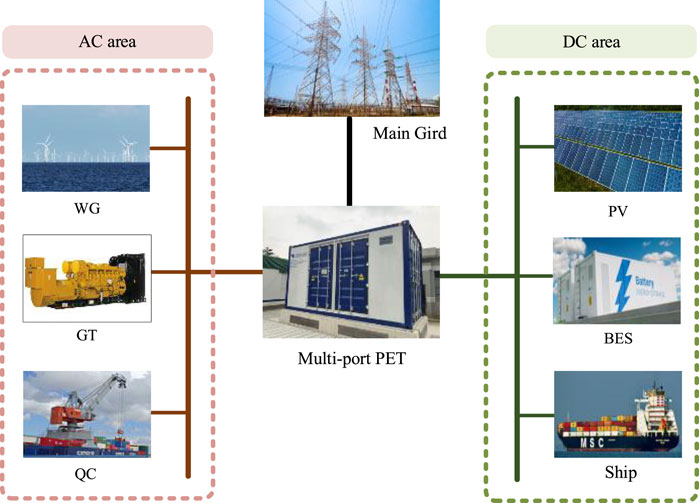
FIGURE 1. Structure of the green port with the multiport PET system.
Figure 1 shows that the proposed multiport PET system is simplified and equivalent to a three-port power electronic device: high-voltage alternating current (HVAC), low-voltage alternating current (LVAC), and low-voltage direct current (LVDC) ports. Specifically, WGs, GTs, and QCs in the AC area are connected to the LVAV port through the AC bus. PVs, BESs, and ships in the DC area are connected to the LVDV port through the DC bus. Moreover, the MVAV port is connected to the main grid for participating in day-ahead markets.
The multiport PET system can manage the power flow direction according to the power surplus or deficit of each port, ensuring the power balance of each area and the whole green port. Notably, the reactive power of the AC area is left out of consideration due to the reactive compensation function of PET. The power balance of the green port with a multiport PET system is as follows:
Eqs 1–3 represent the energy balance model of the MVAC, LVAC, and LVDC ports, respectively. t is the index of time periods; k is the index of scenarios; and s, e, p, w, l, and d are the indices of GTs, BESs, PVs, WGs, QCs, and ships, respectively.
2.2 Logistics system scheduling model for the green port
The key to the logistics system in green port is dispatching the QCs for the efficient loading and unloading of ships. In other words, the number of QCs is directly related to the duration of the ship in the port and then affects the status of the ship in the port.
The rule of dispatching in the port requires that the ships must leave before the latest time of departure within a certain range, as shown in Eq. 4. During the scheduling cycle, ships arrive at the port only once and do not return after leaving the port, as modeled in Eq. 5:
where
Due to the limitation to ship length and cargoes loaded and unloaded, the numbers of QCs allocated cannot exceed the minimum and maximum QC demands of ships, as shown in Eq. 6. Meanwhile, the number of QCs in operation at some point should be limited to the total number of QCs in the port and defined in Eq. 7. Eq. 8 indicates that containers can be unloaded at one time within the specified time:
where
2.3 Framework of day-ahead markets
In this paper, the green port is considered an aggregator that can purchase or sell energy in the energy market, providing reserves in the reserve market and trading carbon credit in the carbon market. Generation companies (Gencos) are the other participants of the multiple markets. The framework of multiple markets in the green port is shown in Figure 2.
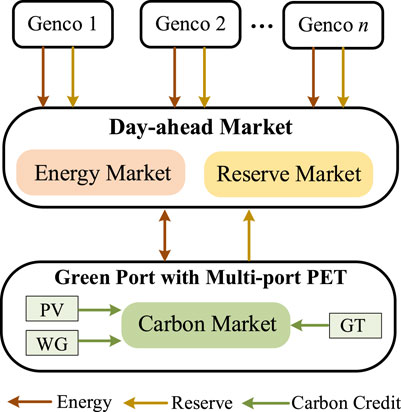
FIGURE 2. Framework of multiple markets in the green port.
To be specific, the green port and Gencos provide energy and reserve to meet the requirements of the main grid in the day-ahead market. In the inner carbon market, a carbon credit is set as a commodity to participate in market transactions. Units with high carbon emissions may have to pay high costs to buy carbon credits in the carbon market; units with low carbon emissions may purchase additional carbon credits from the carbon market as a means of reducing their carbon footprint.
In other words, the green port can trade and obtain carbon credit in the process of GT, WG, and PV generation. Whenever the green port dispatches GTs to generation, it also has to purchase carbon credits for itself. The dispatch of WT and PV can result in corresponding carbon credits, which can be sold on the carbon trading market to gain economic benefits.
In the perspective of the proposed bi-level stochastic optimization model, which considers the uncertainties, the operation scheme of the green port is modeled in the upper-level problem, and the lower-level problem consists of clearing the energy (problem Ⅰ) and reserve market (problem Ⅱ), as shown in Figure 3. The behavior of other participants (Genco and consumers) is not strategic, and their bids are only modeled in the lower-level problem.

FIGURE 3. Structure of the bi-level stochastic optimization model.
Before solving the problem, the uncertainties of stochastic parameters are described as stochastic processes, and the Monte Carlo simulation (MCS) (Chin et al., 2003) approach is used to generate scenarios. Uncertainties in PVs, WGs, and loads in the main grid are considered in this work. With each parameter obtained, the sets of generated scenarios are joined to form a scenario tree. Because the number of created scenarios directly impacts the complexity of the optimization problem’s computation, it must be reduced to a smaller number of scenarios that adequately represent the uncertainties. In order to lessen the stochastic procedure’s computational overhead, the simultaneous backward reduction (SBR) (Heitsch and Romisch, 2003) algorithm is employed as a proper scenario-reduction strategy to reduce the scenario tree to a reasonable level of possibilities.
3 Methodology and formulation
In this paper, the strategic behavior of the green port system is modeled in the energy and reserve markets. The problem is cast as a bi-level stochastic optimization model, which is, in fact, a type of Stackelberg game with a single leader and one or multiple followers. In other words, the operation of the green port is modeled in the upper level as a leader, and the market-clearing problem for energy and reserve markets is described in the lower level as followers, respectively.
3.1 Operation model of the green port
In the upper-level problem, the green port system aims to minimize the operation cost and profit from the energy market, reserve market, and carbon trade, as presented in Eqs 9–13. Eq. 9 presents the objective function of the green port’s operation problem consisting of seven terms.
where
3.1.1 Green port’s transaction constraints
The limitations to bid/offer quantity for energy and reserve markets of the green port’s output and input modes are modeled in constraints (Eqs 17–26). The operation modes for the green port are defined in Eqs 27, 28. The constraint (Eq. 29) enforces the non-negativity of bidding/offering prices in the energy and reserve markets:
where
3.1.2 Green port’s AC and DC area constraints
The limitations to the energy quantity of LVAC and LVDC ports of PET connected to AC and DC areas are modeled in constraints (Eqs 30–33). Constraints in Eqs 34–37 determine the operation mode of the LVAC and LVDC ports of PET:
where
3.1.3 Power generation equipment constraints
The maximum output limits of GTs are shown in (38). The operational constraints of WPs and PVs are modeled based on the forecasted power outputs in Eqs 39, 40:
where
3.1.4 BES’s Constraints
The minimum and maximum limits of power charging, power discharging, and battery energy are described in Eqs 41–44, respectively. The relationship between the state of charge of EES at times t and t-1 is described in Eqs 45, 46:
where
3.2 Modeling the energy market
In the first lower-level problem, the green port participates in the energy market. The objective function of the energy market clearing model is shown in Eqs 47–49.
subject to
where
3.3 Modeling the reserve market
The reserve market is cleared as the second lower-level problem given by Eq. 52, which consists of two terms.
subject to
where
3.4 Solution method
In this paper, the decision-making process of the green port is modeled as a bi-level stochastic optimization model, which is considered a Stackelberg game, where the upper level is given by Eqs 1–46, the first lower level by Eqs 47–51, and the second lower level by Eqs 52–60. The whole process of the solution method is described in Figure 4.
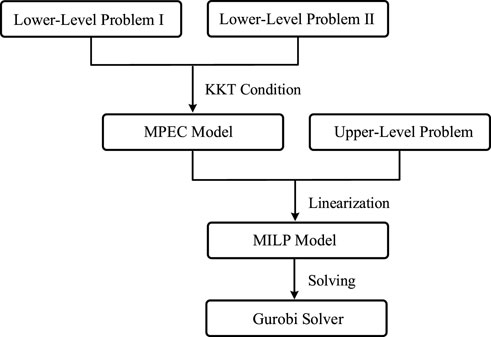
FIGURE 4. Process of the proposed solution method.
First, because the decision variables of the upper-level problem are considered parameters in the lower-level problem, the lower-level problem can be transformed into a convex and linear one and replaced with its KKT optimality conditions by the Lagrangian method (Bahramara et al., 2015) as follows:
Then, the Big-M method (Talbi, 2013) is used to linearize the complementarity requirement, transforming Eqs 69–76 into Eqs 77–92. Note that
Therefore, the bi-level problem is transformed into a single-level problem generating a mathematical program with equilibrium constraints (MPECs). Furthermore, the nonlinear terms of the upper-level objective function need to be linearized based on the strong duality theorem (Kazempour et al., 2011), as described in detail in Eq. 93, which is a mixed-integer linear programming (MILP) model:
The constraints of the MPEC include 1) the constraints of the upper-level problem (Eqs 1–46), 2) the KKT optimality conditions of lower-level problems (Eqs 61–76), and 3) the complementarity conditions (Eqs 77–92).
4 Numerical results
In this section, a detailed green port scheduling model considering multiport PET and logistics system is established to illustrate the effectiveness of the proposed model. The proposed stochastic bi-level market clearing problem is modeled in the MATLAB 2021b platform and solved by Gurobi and YALMIP. All numerical results are implemented on a computer with Intel(R) Core (TM) i7-9750H and 32 GB of RAM.
4.1 Simulation setup
A hypothetical marketing structure is established in this test green port system, composed of the operator of the green port system and three Gencos that participate in the energy, reserve, and carbon market. In the simulation, the time step is 1 h, and the dispatching cycle is 24 h. This test green port system contains a multiport PET, PVs, WGs, BESs, and QCs and is connected to the main grid. The forecasted values for the power generation of WGs, PVs, and the load demand in the main grid are shown in Figure 5. Based on the forecasted values, 2,000 scenarios are generated using the MCS approach. Then, the SBR algorithm is adopted to reduce the scenario to a reasonable level of possibilities. The corresponding probabilities are 0.305, 0.155, 0.23, 0.115, and 0.195, respectively.
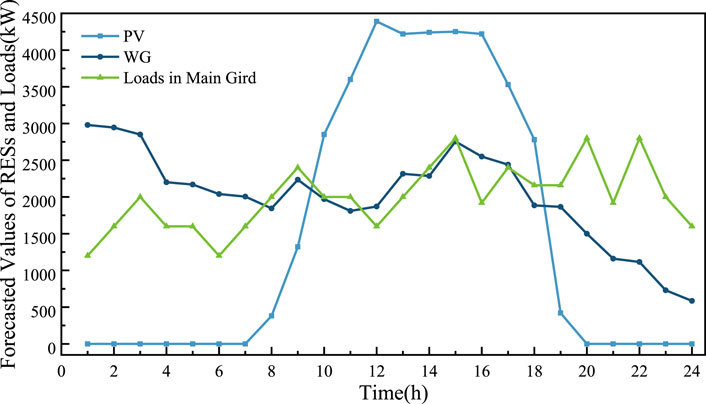
FIGURE 5. Forecasted values of RESs and loads.
The operational characteristics of the green port system are listed in Table 1. In Table 2, the relevant parameters of Gencos are reported. The relevant parameters of the port logistics system are shown in Table 3.
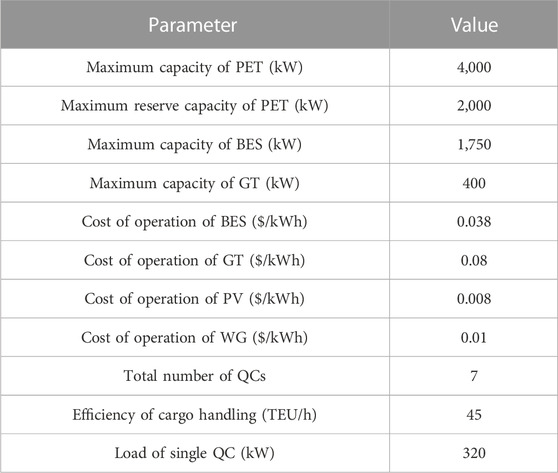
TABLE 1. Parameters of the green port.

TABLE 2. Parameters of generation company.
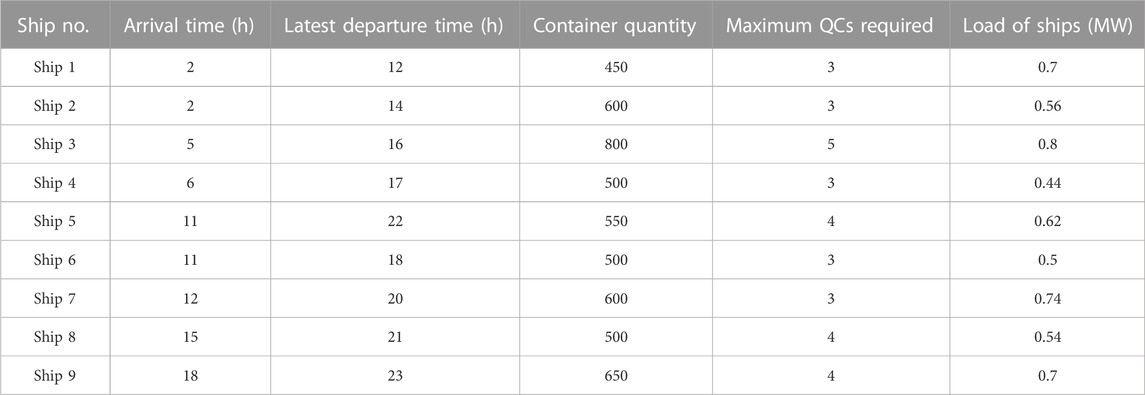
TABLE 3. Parameters of the port logistics system.
The carbon trading price in the carbon market is assumed as $0.0013/kW. The hourly maximum upward and downward reserve requirements in the main grid are considered to be 20% of its load. In order to demonstrate the effectiveness of the proposed strategy, the operation results are shown in the following section.
4.2 Analysis of optimal scheduling results
Based on the proposed bi-level stochastic optimization strategy, this section analyzes the operation of each power generation equipment, energy storage equipment, and port logistics equipment in the green port, considering intimal carbon trading as described in the upper level. Furthermore, the operator of the green port participates in external markets, including energy and reserve markets; then, the corresponding market clearing results are discussed in the following paragraphs.
In the aspect of the operation scheduling of the green port, the dispatching results of GT, PV, WG, BES, and loads are shown in Figure 6. The positive values in the figure represent the supplied power, and the negative values represent the consumed power.
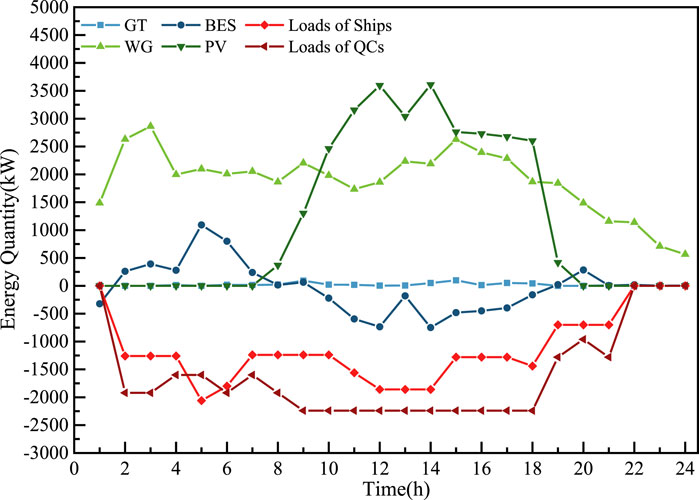
FIGURE 6. Power dispatching schedule.
Figure 6 shows that GTs barely run due to their high operation cost. BESs are in the charging mode in hours 9–18 due to the abundant power generation of PVs. Moreover, energy consumption on ships approaching and berthing and containers loading and unloading by QCs is the main load source in the green port. It is assumed that the energy consumption of ships during berthing is provided by the port.
The operation results of port logistics are shown in Figures 7, 8. More specifically, Figure 7 presents details of each ship’s berthing schedule. Compared to Table 3, each ship can leave the port before the latest departure time, arrive only once, and do not return after leaving. Furthermore, containers’ loading and unloading are finished by dispatching the QCs, as shown in Figure 8. The numbers of QCs assigned to each ship at each time period do not exceed the maximum QCs required of each ship. Moreover, the numbers of the operating QCs in each hour are within the range of the total quantity of QCs in the port.
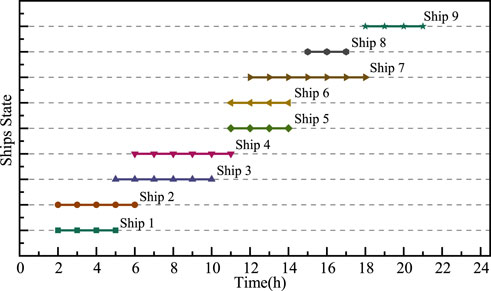
FIGURE 7. Berthing schedule of ships.

FIGURE 8. Allocation scheme of QCs.
In terms of marketing activities, the clearing results in the energy market are shown in Figure 9, in which the negative value represents the green port purchasing energy from the main grid and the positive value represents the green port selling energy to the main grid. The clearing results in the reserve market are shown in Figure 10, in which the negative/positive values correspond to the downward/upward reserve. The clearing prices in the energy and reserve markets are shown in Figure 11.

FIGURE 9. Clearing results in the energy market.

FIGURE 10. Clearing results in the reserve market.
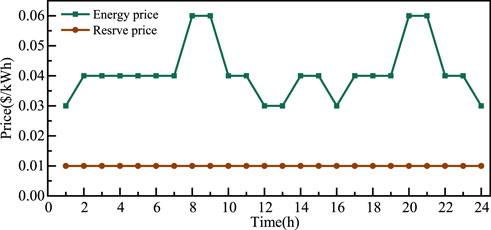
FIGURE 11. Clearing price in the energy and reserve markets.
The data in Figure 9 show that the green port sells energy to the main grid in hours 1 and 9–24 on account of a reduction in local load or an increase in local renewable energy power generation. In hours 10, 12, 13, 16, and 24, Genco 3 is involved with the energy market separately among the three-generation companies, thus resulting in the lowest energy trading prices equivalent to the offer price of Genco 3, as shown in Figure 11. In hours 2–7, 11, 14, 15, 17–19, 22, and 13, Genco 2 is added to the market to meet the growing load demand in the main grid. At these times, the energy price is the same as the price of Genco 2. Furthermore, the clearing prices in the energy market are the highest in hours 8, 9, 20, and 21, equal to the offer price of Genco 1, as presented in Figure 11.
As shown in Figure 10, the upward reserve and downward reserve requirements are met by Genco 3 and the green port system. Note that the reserve prices are identical to the reserve offer price of Genco 3, as presented in Figure 11.
4.3 Comparison study
In order to evaluate the effectiveness of the proposed market strategy in this study, the following different strategies are compared in this section.
1) Case 1: Strategy for the single energy market,
2) Case 2: Strategy for the energy and reserve markets,
3) Case 3: The proposed strategy for the external energy and reserve markets and internal carbon market.
The green port system’s operation cost and expected market profits in different strategies are shown in Table 4.

TABLE 4. Operation cost and expected profit of the green port.
Table 4 shows that compared to the different strategies with a combination of different markets, the proposed strategy results in a lower total cost for the operation of the green port system and gains more profit from the day-ahead energy market, day-ahead reserve market, and carbon trading market.
Moreover, in case 1, the strategy for the single energy market only gains profit from the day-ahead energy market, and the revenue is less than the operation cost. In case 3, the revenue from the energy market is the lowest because the requirements for less GT generation in carbon trading lead to a decrease in green port participation in the energy market.
Generally, the aforementioned results indicate that the green port system participating in multiple markets can generate more revenue to cover the system operation cost.
5 Conclusion
A novel energy transaction framework to optimize the operation of the green port with multiport PET in day-ahead energy and reserve markets is established in this study. The decisions of the port system in multiple markets are made according to a bi-level stochastic optimization model. The coordinated operation strategies for the energy source schedule, berth allocation, and QC assignment are presented in the upper level. The energy and reserve market clearing problems are solved at a lower level. Based on KKT conditions and duality theory, the proposed nonlinear optimization model is converted to a single-level linear optimization model. Simulation results show that the proposed method can reduce the operation cost of the green port. This study focuses on the electrical power system in green ports. An integrated port energy system will be carried out in our future works.
Data availability statement
The raw data supporting the conclusion of this article will be made available by the authors, without undue reservation.
Author contributions
CQ wrote the manuscript and overall conception. NT put forward suggestions for the revision and improvement of the paper. FF put forward suggestions for the revision and improvement of the paper. JY put forward the structure of the multiport PET system. JW put forward suggestions on the revision. YH put forward suggestions for the revision and improvement of the paper.
Funding
This work was supported by the National Key Research and Development Program (2019YFE0102900), the Shanghai Pujiang Program (22PJ1405000), and the Innovation Program of Shanghai Municipal Education Commission (2019-01-07-00-02-E00044).
Conflict of interest
The authors declare that the research was conducted in the absence of any commercial or financial relationships that could be construed as a potential conflict of interest.
Publisher’s note
All claims expressed in this article are solely those of the authors and do not necessarily represent those of their affiliated organizations, or those of the publisher, the editors, and the reviewers. Any product that may be evaluated in this article, or claim that may be made by its manufacturer, is not guaranteed or endorsed by the publisher.
References
Acciaro, M., Ghiara, H., and Cusano, M. I. (2014). Energy management in seaports: A new role for port authorities. Energy Policy 71, 4–12. doi:10.1016/j.enpol.2014.04.013
Alnaqbi, B., Alrubaiai, H., and Al Alawi, S. (2016). “Combination of a dynamic-hybrid berth allocation problem with a quay crane scheduling problem,” in 7th International Conference on Information, Intelligence, Systems and Applications (IISA).
Bahramara, S., Moghaddam, M. P., and Haghifam, M. R. (2015). Modelling hierarchical decision making framework for operation of active distribution grids. Iet Generation Transm. Distribution 9, 2555–2564. doi:10.1049/iet-gtd.2015.0327
Bektas, T., Ehmke, J. F., Psaraftis, H. N., and Puchinger, J. (2019). The role of operational research in green freight transportation. Eur. J. Operational Res. 274, 807–823. doi:10.1016/j.ejor.2018.06.001
Buiza, G., Cepolina, S., Dobrijevic, A., Del Mar Cerban, M., Djordjevic, O., and Gonzalez, C. (2015). “Current situation of the Mediterranean container ports regarding the operational, energy and environment areas,” in International Conference on Industrial Engineering and Systems Management, 530–536.
Chin, W., Marcolin, B. L., Newsted, P. R., and Effects, A. P. (2003). Results from a Monte Carlo simulation study and an electronic-mail emotion/adoption study.
Dong, L., Zhang, T., Pu, T., Chen, N., and Sun, Y. (2019). A decentralized optimal operation of AC/DC hybrid microgrids equipped with power electronic transformer. Ieee Access 7, 157946–157959. doi:10.1109/access.2019.2949378
Doostizadeh, M., and Ghasemi, H. (2013). Day-ahead scheduling of an active distribution network considering energy and reserve markets. Int. Trans. Electr. Energy Syst. 23, 930–945. doi:10.1002/etep.1630
Fan, F., Aditya, V., Xu, Y., Cheong, B., and Gupta, A. K. (2022a). Robustly coordinated operation of a ship microgird with hybrid propulsion systems and hydrogen fuel cells. Appl. Energy 312, 118738. doi:10.1016/j.apenergy.2022.118738
Fan, F., Xu, Y., Zhang, R., and Wan, T. (2022b). Whole-lifetime coordinated service strategy for battery energy storage system considering multi-stage battery aging characteristics. J. Mod. Power Syst. Clean Energy 10, 689–699. doi:10.35833/mpce.2021.000034
Geng, Q., and Hu, Y. (2019). “Optimal power flow for AC and DC grids based on power electronic transformer,” in 8th Renewable Power Generation Conference, 1–8. (RPG 2019)).
Gregoratti, D., and Matamoros, J. (2015). Distributed energy trading: The multiple-microgrid case. IEEE Trans. Industrial Electron. 62, 2551–2559. doi:10.1109/tie.2014.2352592
Guo, Z., Pinson, P., Chen, S., Yang, Q., and Yang, Z. (2021). Chance-constrained peer-to-peer joint energy and reserve market considering renewable generation uncertainty. IEEE Trans. Smart Grid 12, 798–809. doi:10.1109/tsg.2020.3019603
Heitsch, H., and Romisch, W. (2003). Scenario reduction algorithms in stochastic programming. Comput. Optim. Appl. 24, 187–206. doi:10.1023/a:1021805924152
Heydt, G. T. (2010). Future renewable electrical energy delivery and management systems: Energy reliability assessment of FREEDM systems.
Huang, A. Q., Crow, M. L., Heydt, G. T., Zheng, J. P., and Dale, S. J. (2011). The future renewable electric energy delivery and management (FREEDM) system: The energy internet. Proc. Ieee 99, 133–148. doi:10.1109/jproc.2010.2081330
Idris, N., and Zainuddin, Z. M. (2016). “A simultaneous integrated model with multiobjective for continuous berth allocation and quay crane scheduling problem,” in International Conference on Industrial Engineering, Management Science and Applications (ICIMSA).
Iris, Ç., and Lam, J. S. L. (2021). Optimal energy management and operations planning in seaports with smart grid while harnessing renewable energy under uncertainty. Omega 103, 102445. doi:10.1016/j.omega.2021.102445
Iris, Ç., Pacino, D., Ropke, S., and Larsen, A. (2015). Integrated berth allocation and quay crane assignment problem: Set partitioning models and computational results. Transp. Res. Part E Logist. Transp. Rev. 81, 75–97. doi:10.1016/j.tre.2015.06.008
Kanellos, F. D. (2017). Real-time control based on multi-agent systems for the operation of large ports as prosumer microgrids. Ieee Access 5, 9439–9452. doi:10.1109/access.2017.2706091
Kazempour, S. J., Conejo, A. J., and Ruiz, C. (2011). Strategic generation investment using a complementarity approach. Ieee Trans. Power Syst. 26, 940–948. doi:10.1109/tpwrs.2010.2069573
Li, J., Zhang, C., Xu, Z., Wang, J., Zhao, J., and Zhang, Y.-J. A. (2018a). Distributed transactive energy trading framework in distribution networks. IEEE Trans. Power Syst. 33, 7215–7227. doi:10.1109/tpwrs.2018.2854649
Li, Z., Gao, F., Zhao, C., Wang, Z., Zhang, H., Wang, P., et al. (2018b). Research review of power electronic transformer technologies. Proc. Chin. Soc. Electr. Eng. 38, 1274–1289.
Malekahmadi, A., Alinaghian, M., Hejazi, S. R., and Saidipour, M. a. A. (2020). Integrated continuous berth allocation and quay crane assignment and scheduling problem with time-dependent physical constraints in container terminals. Comput. Industrial Eng. 147, 106672. doi:10.1016/j.cie.2020.106672
Misra, A., Venkataramani, G., Gowrishankar, S., Ayyasam, E., and Ramalingam, V. (2017). Renewable energy based smart microgrids - a pathway to green port development. Strategic Plan. Energy Environ. 37, 17–32. doi:10.1080/10485236.2017.11907880
Molavi, A., Shi, J., Wu, Y., and Lim, G. J. (2020). Enabling smart ports through the integration of microgrids: A two-stage stochastic programming approach. Appl. Energy 258, 114022. doi:10.1016/j.apenergy.2019.114022
Parise, G., Parise, L., Martirano, L., Ben Chavdarian, P., Chun-Lien, S., and Ferrante, A. (2016). Wise port and business energy management: Port facilities, electrical power distribution. IEEE Trans. Industry Appl. 52, 18–24. doi:10.1109/tia.2015.2461176
Park, S., Lee, J., Bae, S., Hwang, G., and Choi, J. K. (2016). Contribution-based energy-trading mechanism in microgrids for future smart grid: A game theoretic approach. IEEE Trans. Industrial Electron. 63, 4255–4265. doi:10.1109/tie.2016.2532842
Rashidi, M., Altin, N. N., Ozdemir, S. S., Bani-Ahmed, A., and Nasiri, A. (2019). Design and development of a high-frequency multiport solid-state transformer with decoupled control scheme. Ieee Trans. Industry Appl. 55, 7515–7526. doi:10.1109/tia.2019.2939741
Roy, A., Auger, F., Olivier, J.-C., Schaeffer, E., and Auvity, B. (2020). Design, sizing, and energy management of microgrids in harbor areas: A review. Energies 13, 5314. doi:10.3390/en13205314
Shayegan-Rad, A., Badri, A., and Zangeneh, A. (2017). Day-ahead scheduling of virtual power plant in joint energy and regulation reserve markets under uncertainties. Energy 121, 114–125. doi:10.1016/j.energy.2017.01.006
Tan, C. M., Yan, W., and Yue, J. T. (2021). Quay crane scheduling in automated container terminal for the trade-off between operation efficiency and energy consumption. Adv. Eng. Inf. 48, 101285. doi:10.1016/j.aei.2021.101285
Thanh, T., Nahavandi, S., and Reid, R. (2008). Power demand and energy usage of container crane: Comparison between AC and DC drives.
Yang, Y., Pei, W., Deng, W., and Zhang, S. (2019). Benefit analysis of using multi-port and multi-function power electronic transformer connecting hybrid AC/DC power grids. J. Engineering-Joe 2019, 1076–1080. doi:10.1049/joe.2018.8446
Keywords: green port, power electronic transformer, energy transaction framework, day-ahead markets, bi-level stochastic optimization
Citation: Qing C, Tai N, Fan F, Yu J, Wang J and Hu Y (2023) Optimal operation of the green port system considering the multiport power electronic transformer in day-ahead markets. Front. Energy Res. 11:1120636. doi: 10.3389/fenrg.2023.1120636
Received: 10 December 2022; Accepted: 26 January 2023;
Published: 15 February 2023.
Edited by:
Fei Wang, Shanghai University, ChinaCopyright © 2023 Qing, Tai, Fan, Yu, Wang and Hu. This is an open-access article distributed under the terms of the Creative Commons Attribution License (CC BY). The use, distribution or reproduction in other forums is permitted, provided the original author(s) and the copyright owner(s) are credited and that the original publication in this journal is cited, in accordance with accepted academic practice. No use, distribution or reproduction is permitted which does not comply with these terms.
*Correspondence: Nengling Tai, bmx0YWlAc2p0dS5lZHUuY24=; Feilong Fan, ZmVpbG9uZ2ZhbkBzanR1LmVkdS5jbg==