 Zhe Jiang1
 Zhenghua He
- 1Power Grid Technology Center, State Grid Shandong Electric Power Research Institute, Jinan, China
- 2School of Electrical Engineering, Shandong University, Jinan, China
As more and more distributed photovoltaics (PVs) are installed in distribution networks, the dynamic characteristics of PVs affect the operation of the bulk power system. Accurate simulation of PV characteristics is essential for the needs of power system transient security and stability analysis. However, because of the large number of distributed PVs, detailed modeling of each PV significantly increases the electromechanical transient simulation time. The equivalent study of distribution networks with distributed PVs is needed to improve simulation efficiency. However, existing equivalent methods of PVs mainly focus on centralized PVs but are unsuitable for distributed PVs with significantly different dynamic characteristics. To improve simulation efficiency, this paper proposes an equivalent method of the distribution network with distributed PVs for electromechanical transient study based on user-defined (UD) modeling. Firstly, the equivalent structure of the distribution network is established. The static equivalent of the transmission lines and the dynamic equivalent model of loads are carried out. Then, a UD model based on PSASP is established for the dynamic equivalent of the distributed PVs. Compared with the current PV models in simulation software, the UD model has multiple sets of parameters for the equivalent of distributed PVs with different dynamic characteristics. Finally, the particle swarm optimization (PSO) algorithm is used to obtain the parameters of the equivalent PV. The effectiveness of the proposed method is verified under an example of a distribution network with PVs in PSASP.
1 Introduction
With the continuous development of photovoltaic (PV) power generation, the rate rate of PVs in power systems gradually increased. Furthermore, because distributed PVs are less constrained by geographical and other factors than centralized plants, distributed PV rate has grown significantly in recent years. According to the reports from the international energy agency, the annual installed capacity of distributed PVs has consistently exceeded the centralized ones from 2013 to 2021 (International Energy Agency, 2022). Therefore, it is necessary to study the characteristics of distribution networks with high rate of distributed PVs.
When the distributed PV rate was low, the impact of PVs on the characteristics of power systems was small. Therefore, distributed PVs were usually approximately modeled as loads. However, with the continuous increase of PV rate, the fluctuation and stochasticity of PVs affect the characteristics of power systems more significantly than before (Shah et al., 2010; Kim et al., 2014). The method of modeling distributed PVs as loads cannot reflect these effects and reduce the accuracy of the simulation.
In order to study the impact of the large-scale PV on power system operation, it is necessary to develop detailed modeling methods of PVs to simulate accurate characteristics of distribution networks with high PV rate. In the existing studies, some mature PV stand-alone models with PV arrays (Villalva et al., 2009; Feng et al., 2015), the PV inverter controller (Toledo et al., 2010), and the low voltage ride through (LVRT) part (Chang et al., 2012; Chao et al., 2021)are established. These models can accurately simulate the characteristics of a single PV. However, due to the large number of PV units, detailed modeling of each distributed PV adds a large number of nodes in distribution networks, which leads to low simulation efficiency (Wadhah et al., 2014). Therefore, it is necessary to study the equivalent method of the distribution network with distributed PVs to reduce simulation time.
At present, there are relatively few studies on PV equivalent method. Since both wind turbines and PVs are new energy sources and both have small capacities, the equivalent of PV plants can be borrowed from the wind farm. Referring to the multi-turbine and single-turbine equivalent methods for wind turbines (Wang et al., 2012; Li et al., 2014), the multi-panel equivalent can be regarded as the multiple single-panel equivalents for PVs with different characteristics (Han et al., 2019). These PVs are classified according to their operating characteristics to form multiple single-panel equivalent nodes (Wu et al., 2018). The single-panel equivalent of centralized PVs with similar dynamic characteristics can be achieved through weighted parameters (Meng et al., 2017).
However, the methods do not apply to the equivalent of distributed PVs. Though the equivalent using the multi-panel method has high accuracy, but obtaining the structure of the equivalent system is not practicable. It is because the distribution network with high penetration distributed generation usually uses flexible topology structure that changes frequently to manage the power flow in order to actively control and manage distributed energy (Shan et al., 2016). Therefore, the single-panel equivalent of PVs should be used to obtain an unchanged structure of the equivalent system. However, the voltage differences among distributed PVs are usually more significant than centralized ones because of the large number and wide distribution in the distribution network (Li et al., 2014). The operating states and dynamic characteristics of distributed PVs vary greatly. The single-panel equivalent that uses existing PV stand-alone models with a single set of parameters (Zhang et al., 2022) cannot represent the different characteristics of the distributed PVs accurately. Therefore, a model with multiple groups of parameters is needed to achieve high accuracy in the single-panel equivalent of distributed PVs with different characteristics.
To solve above problems, this paper proposes an equivalent method of distribution network with distributed photovoltaics for electromechanical transient study based on user-defined modeling. The rest of the paper is organized as follows. An equivalent structure of a distribution network including distributed PVs, transmission lines, and loads is constructed in section 2. Based on the power system analysis software package (PSASP), a user-defined (UD) model is established in section 3, and the number of parameter groups are increased for the equivalent of PVs in different operating states. The equivalent parameters are optimized by particle swarm optimization (PSO) in section 4. The fitness calculation of PSO simultaneously considers multiple faults to improve the generalization capability of the equivalent parameters. A study validation is used to verify the viability of the equivalent distribution network with the UD model in section 5, and the conclusions are shown in section 6.
2 Equivalent structure of the distribution network with distributed PVs
With the increase of modeling fineness and the abundant data acquisition methods of power systems, the simulation model of the distribution network is becoming more and more detailed. However, the number of nodes in distribution networks increases significantly with a large number of PVs installed, leading to longer simulation times. Therefore, it is necessary to carry out the equivalent for the detailed distribution network model with PVs as shown in Figure 1, which includes distribution lines, loads, and distributed PVs.
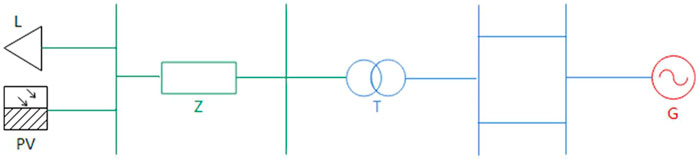
FIGURE 1. Equivalent structure of distribution network.
In the figure, G is the power generation side; T is the step-up transformer of the distribution network; Z is the equivalent distribution network lines; L is the equivalent ZIP load, and PV is the equivalent of distributed PVs.
2.1 Equivalent of the distribution lines
Besides control parameters of the facilities in distribution networks, the initial operating state also affects the equivalent accuracy. Because the dynamic characteristics of distributed PVs and loads are determined by the voltage at the entry point, this paper adopts the principle of a constant voltage difference for the line impedance equivalent. The voltage difference between the PV entry point and the step-up transformer in the equivalent system is the same as that of the original distribution network (Liu, 2018). The calculation of the weighted average voltage difference between the equivalent PV and the step-up transformer is shown in Eq. 1:
where
where, Zeql is the impedance of the distribution network lines, UT is the voltage of the step-up transformer. The equivalent impedance of the line can be calculated by solving simultaneous Eq 1, 2, which is shown in Eq. 3:
2.2 Equivalent of loads
At present, the typical loads in the distribution network are mainly ZIP loads, and the characteristics are shown in Eq. 4:
where U0 is the voltage of the load at the initial steady-state moment; P0 and Q0 are the active power and reactive power absorbed by the load at the initial steady-state moment; P and Q are the active power and reactive power absorbed by the load when the terminal voltage is U; ap, bp, and cp are active component coefficients, and ap + bp + cp = 1; aq, bq, and cq are reactive component coefficients, respectively, and aq + bq + cq = 1.
The equivalent of ZIP loads in the proposed equivalent model is achieved by summing the capacity of loads and weighting the component coefficients as Eq. 5:
where Pe and Qe are the active and reactive power of the equivalent load; Pi and Qi are the active and reactive power of each original load; aPe, bPe, cPe, aQe, bQe, and cQe are active and reactive component coefficients of the equivalent load; aPi, bPi, cPi, aQi, bQi, and cQi are the component coefficients of each original load.
2.3 Analysis of equivalent difficulties on distributed PVs
Due to the small capacity of each unit, distributed PVs are usually not required to have reactive power support ability. Therefore, this paper only considers the active power characteristics of PVs. The static characteristics of distributed PV are similar to the constant power load. The main difference between them is that distributed PVs have the LVRT state when the voltage falls below a preset threshold. At this time, the active power of the PV in LVRT state maintains at a low level after a rapid decline, but it remains unchanged for the load. The active power characteristics of distributed PVs are shown in Eq. 6:
where PG is the distributed PV active power; P0 is the active power of the distributed PV at initial steady-state moment; λ is the active power control parameter during LVRT, and 0 ≤ λ ≤ 1; U is the entry point voltage; ULVRT is the voltage threshold for PV to enter LVRT state; t is the duration of LVRT state; tcut is the preset out-of-service protection time for PV. The PV is in the normal state when the U > ULVRT, LVRT state when U < ULVRT and t < tcut, and out-of-service state when U < ULVRT and t > tcut.
The active power and control parameters of the equivalent PV can be obtained as Eq. 7:
where PPVe and PPVi are the active power of equivalent PV and each original PV; λe and λi are the control parameter of equivalent PV and each original PV. Because the weighted calculation of PVs with different dynamic characteristics reduces the accuracy of the equivalent, PVs in the original system should be classified by dynamic characteristics before the equivalent (Li et al., 2010; Ma et al., 2012). Based on the significantly distinct dynamic characteristics of PVs in different operating states, original PVs can be classified by operating states.
However, because of the large number and wide distribution, the operating states of distributed PVs are significantly different. As explained in the introduction, the PV models currently used in simulation software can only represent a group of PVs with the same operating state. A large number of PV nodes are left in the equivalent distribution network, leading to low simulation efficiency. It is necessary to increase the number of LVRT control parameter groups in PV models for the equivalent of distributed PVs in different states to reduce simulation time.
3 User defined modeling of the distributed PV
Since the models in simulation software are mostly encapsulated and cannot be modified, this paper builds a UD model based on PSASP. The model is established with different functional parts to simulate the characteristics described in Eq. 6. Then, the number of control parameter groups is increased for the equivalent of PVs in different operating states.
3.1 Establishment of each functional part
Based on the characteristics described in Eq. 6, the model needs to have the following functional parts:
The enter-exit judgment part of LVRT is shown in Eq. 8:
where the FLVRT is the LVRT enter-exit judgment parameter, PV is in the normal state when FLVRT = 0 and enters the LVRT state when FLVRT = 1.
The out-of-service protection part is shown in Eq. 9:
where tstart and tend are the start and end times of the LVRT state, respectively; Fcut is the out-of-service judgment parameter. When the LVRT operating state of the PV lasts longer than the preset time threshold, the judgment parameter switches from 0 to 1, and the PV is in the out-of-service state.
The active power control part is shown in Eq. 10:
where PG is the distributed PV active power; P0 is the active power at the initial moment of the PV; α is the control parameter of PV active power in the LVRT state and meets 0<α < 1.
The data coordinate transformation part is shown in Eq. 11:
where ITR and ITI are the real and imaginary parts of the active current, respectively; θ is the phase-angle difference between the active current and the voltage. Since the simulation of PSASP takes current as the input, this part converts the output of the UD model from active power into the real and imaginary parts of the active current.
3.2 Increase of the parameter group number
A UD model is established with the above parts to simulate the characteristics shown in Eq. 6. By analyzing Eqs 8–11, it can be seen that the active power characteristics of the UD model are determined by Eqs 8, 10.
To increase the number of parameter groups in the UD model for the equivalent of PVs in different states, the enter-exit judgment part of LVRT and the active power control part shown in Eqs 8, 10 are merged as the LVRT control part and shown in Eq. 12:
where αm is different control parameters and meets 0 ≤ αm ˂ ... ˂α1 ≤ 1; ULm is different voltage thresholds and meets 0 ≤ ULm ˂… ˂UL1 ≤1 (p.u.). By increasing control parameter groups, the equivalent of original PVs under different states can be achieved as multiple sets of parameters in the UD model instead of different nodes in the equivalent system.
3.3 Process of UD modeling based on PSASP
UD modeling method in PSASP is designed by connecting logical calculation parts. According to the above functional parts, the logic block diagram of the UD model is built as shown in Figure 2.

FIGURE 2. Logic block diagram of UD model.
The specific description of the UD model is as follows:
Block 1 is the LVRT control part. This part uses the terminal voltage as input, and the output is the active power control parameters corresponding to different voltage thresholds as shown in Eq. 12.
Block 2 is the out-of-service protection part. This part records the duration of the LVRT state by integrating the LVRT enter-exit judgment parameter FLVRT in block 6. When the integration is greater than the preset time tcut, the PV enters out-of-service state as shown in Eq. 9 and output a active power control parameter. When the fault is removed and the terminal voltage returns above the threshold, the integration is reset if it is less than the preset time, otherwise, the integration remain unchanged if the PV is in the out-of-service state.
Block 3 is the monitoring part. This part uses mathematical operations to obtain the output active power and monitor it. By adding an oscilloscope such as shown in the block 5, the monitored parameters can be added as needed.
Block 4 is the data coordinate transformation part. This part uses the phase angle of terminal voltage as input, and converts the output of the UD model from active power into the real and imaginary parts of the active current to access to PSASP for simulation as shown in Eq. 11. As mentioned in section 2.3, distributed PVs usually do not have reactive power support ability. Therefore, the UD model built in this paper does not consider the establishment of reactive power control parts. If the future PV have reactive power support with the development of technology, the corresponding control parts can be added in the UD model as needed.
4 Dynamic equivalent parameter optimization of the UD model
In existing studies, the equivalent parameters of LVRT control part are usually obtained by weighted average (Ma et al., 2016). However, it is difficult to get multiple parameters of the UD model simultaneously. Therefore, this paper adopts the evolutionary algorithm to optimize the LVRT control parameters.
Among the commonly used evolutionary algorithms include genetic algorithm, artificial neural network, and PSO. The use of genetic algorithms can avoid falling into local optimum, but it is not efficient and prone to premature convergence (He et al., 2008). Artificial neural network has the ability to find optimized solutions at high speed, but neural networks require a lot of data. PSO has high search efficiency and is easy to operate with few parameters (Ishaque et al., 2012). Due to the parameters ULm and αm are one-to-one correspondence, the optimization is not easy to fall into local optimum. Collecting the data required to build a neural network is a large amount of work and hard to achieve. Therefore, this paper considers to obtain the parameters of the equivalent PV through the PSO algorithm because of its high efficiency.
4.1 Dynamic equivalent parameter optimization based on PSO
The basic principle of PSO can be described as follows: In the p-dimensional space representing the optimization target, there is a set of particles with a size of n in each dimension. The optimization takes the distance between each particle and the optimization target as the fitness to determine whether the iteration converges. The speed and position of the ith particle can be expressed in vi and xi. The direction of optimization can be updated as Eq. 13 and Eq. 14:
where i represents the ith particle; j represents the jth-dimensional space; t is the number of iterations; Pb is the best position in the tth iteration; Gb is the best position in all historical iterations; ε1 and ε2 are random numbers uniformly distributed between 0 and 1; ωg is the inertia weight; c1 and c2 are the individual and group learning factors, respectively. The specific process of optimization is shown in Figure 3.
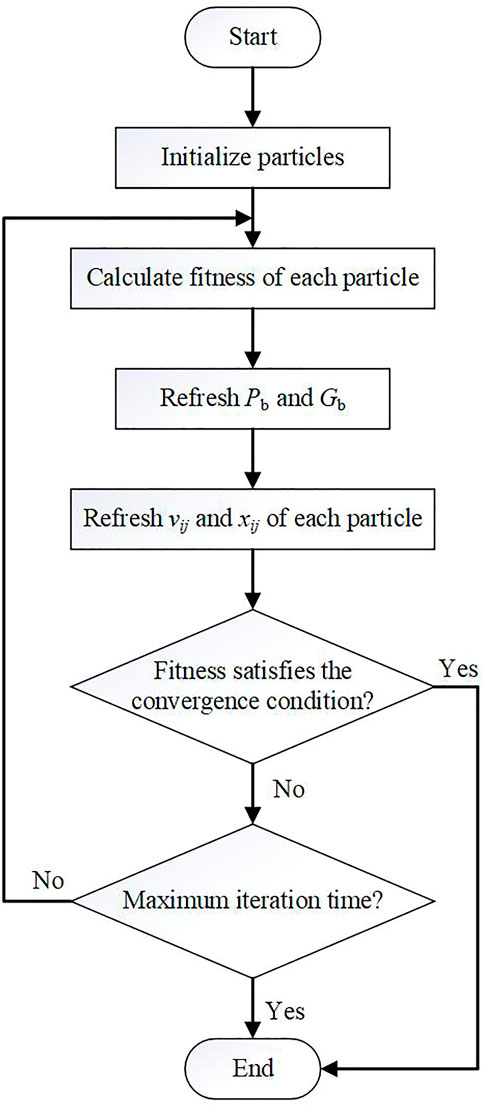
FIGURE 3. Process of PSO.
It can be seen from Figure 3 to determine whether the iteration converges, the optimization needs to preset a threshold of fitness and the maximum iteration time. Because distributed PVs mainly have active power control ability, this paper takes root mean squared error (RMSE) of the active power between the original and equivalent system as the fitness. The calculation of the fitness is shown in Eq. 15:
where F is the fitness; Pori and Peql are the active power of the original and equivalent system; trec is the time that the PV returns to the normal state from the LVRT state.
However, setting the convergence threshold for fitness is impossible because the minimum RMSE is uncertain. Therefore, this paper determines whether the optimization results converge according to Eq. 16:
where Fn is the fitness calculated according to the equivalent parameters of the nth generation optimization. When Fn+k = Fn, it means that no better result is produced by the continuous k generations from the nth generation, and the optimization result converges.
4.2 Improvement of optimized process
The control parameters obtained by the PSO can realize the equivalent of the distribution network with distributed PVs under a single fault. The control parameters need to be re-acquired when different faults occur or the operating state changes, which cannot meet the safety and stability analysis needs of the power system. Therefore, it is necessary to adjust the optimization of parameters to improve the generalization ability of the equivalent. This paper uses Pori and Peql under multiple faults when calculating the fitness to improve the optimized process of PSO. With the improved PSO, the obtained control parameters can be used in the equivalent system under multiple faults and operating states.
However, the characteristics of PVs under some faults are consistent. Taking these faults into account simultaneously when calculating the fitness cannot enhance the generalization ability of equivalent parameters but decreases optimization efficiency. Furthermore, it is impossible to consider all faults in the PSO process. Therefore, it is necessary to obtain typical faults through clustering according to the difference in characteristics of PVs to improve the optimized process of PSO. Because the number of clusters cannot be obtained in advance, this paper uses the density-based spatial clustering of applications with noise (DBSCAN) to get clusters.
DBSCAN has two parameters: eps is the swept radius, minPts is the minimum number of inclusion points. When clustering, it starts with any unvisited point and finds all nearby points within eps of distance. If the number of nearby points is less than minPts, that point is marked as a noise point. If the number of nearby points is greater than or equal to minPts, the point forms a cluster with nearby points, and the starting point is marked as visited. The cluster is then extended recursively by processing all points not marked as visited in the same way. In this paper, the active power characteristic of the original system is selected as the clustering metric because it determines the fitness calculation shown in Eq. 15.
Besides clustering, the weight of faults with significant differences in PV operating states should be increased in the optimization process to enhance the generalization ability of equivalent parameters. In this paper, the active power of PVs in different operating states is taken as the weights, and the fitness under different faults is weighted and summed as Eq. 17:
where n is the number of clusters; i represents the ith fault; PiF1, PiF2, and PiF3 are the active power of original PVs running in the normal operating state, LVRT state, and out-of-service state, respectively; Pi is the active power at the initial moment of original PVs. When calculating the weights, this paper uses (PiF + 1) instead of active power to avoid the situation that no PV running in a certain state leads to the calculation results of weights is 0.
Through Eq. 17, the faults that vary significantly in the operating state of each PV have higher weights when calculating the fitness. By obtaining typical faults through DBSCAN and adjusting the calculation of fitness, the improvement of the PSO process can be achieved. It enables obtained parameters to realize the equivalent of the original distribution network with distributed PVs in different operating states.
5 Study validation
5.1 Test system
In order to verify the UD model, a test system is established based on the PSASP, as shown in Figure 4. The transmission grid side is an ideal power supply. Seven distributed PVs and seven static loads are set up on the low-voltage distribution network side. The PV parameters in the system are shown in Table 1.
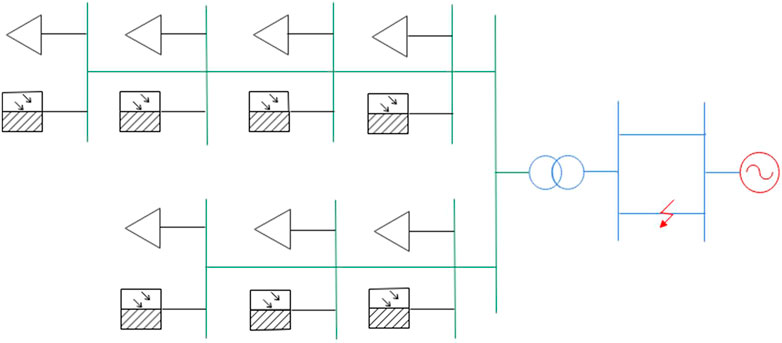
FIGURE 4. Schematic of the test system.

TABLE 1. Original parameters of PVs.
The control parameters of the LVRT state are consistent, and the LVRT voltage threshold is 0.8p.u.; the active power decreases to 50% in the LVRT state; PVs enter the out-of-service state if the LVRT state lasts more than 0.3 s.
5.2 Optimization of equivalent parameters
In this paper, simulation faults are set from 1 to 1.2 seconds, and two typical faults are selected with the method described in Section 4. The grounding impedance is set as (p.u.): Zf1 = 0 + j0.002, Zf2 = 0 + j0.003.
All faults are three-phase short-circuit faults set on the transmission line as shown in Figure 4. The parameters of the equivalent PV are optimized by the conventional and improved PSO, of which k is set to 30 generations. The optimization process are shown in Figures 5A, B.
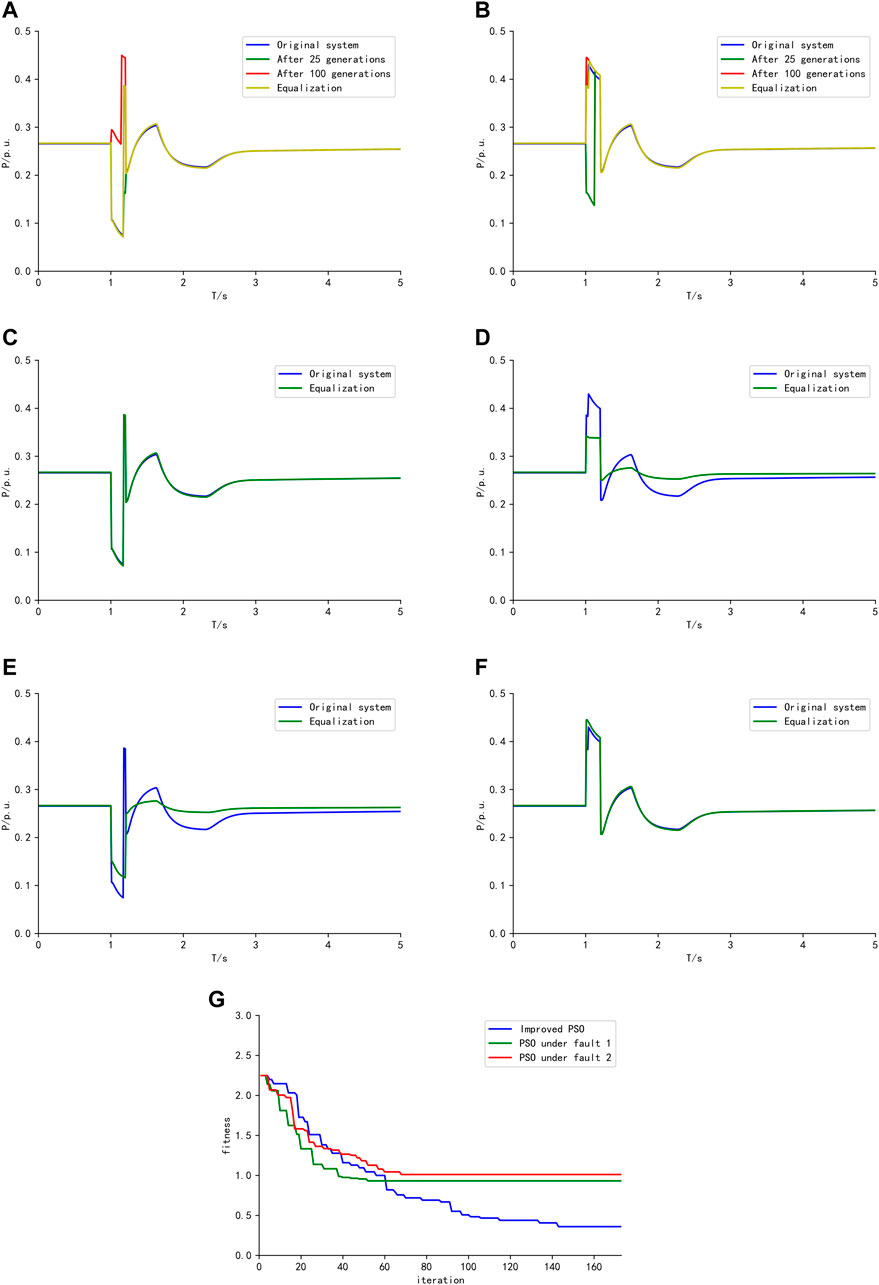
FIGURE 5. Comparison of equivalent results. (A) Improved PSO optimization process under fault 1, (B) Improved PSO optimization process under fault 2, (C) PSO under fault 1, (D) PSO under fault 2, (E) PSO under fault 1, (F) PSO under fault 2, (G) Sum of the fitness.
It can be seen that with the improved PSO after 25 generations, the equivalent result with the obtained parameters under fault 1 is ideal. It is because all PVs enter the LVRT state when fault 1 occurs. However, with part of PVs exiting the LVRT state before the fault 1 clears, the equivalent result is inaccurate. Furthermore, under fault 2, the equivalent result is poor. After 100 generations, it can be seen that the error of the equivalent result under fault 2 is reduced, and the equivalent result of fault 1 becomes worse than after 25 generations. Furthermore, compared with the equivalent result after 25 generations, the sum of fitness under the two faults decreases after 100 generations. When the optimization is completed, the equivalent results of the obtained parameters by the improved PSO under the two faults are both ideal.
To verify the accuracy of the improved PSO, the conventional PSO is also used in this paper to optimize the equivalent parameters under fault 1 and 2 respectively and the equivalizations are shown in Figures 5C, F. Furthermore, the optimized parameters under fault 1 and 2 are separately used for the equivalent of fault 2 and 1, the equivalizations are shown in Figures 5D, E. The sum of the fitness under fault 1 and 2 during the optimization process is shown in Figure 5G. It can be seen that the parameters obtained by the conventional PSO is not accuracy when using for the equivalent under different faults.
The equivalent parameters obtained by improved PSO are shown in Table 2. In order to verify the UD model with the equivalent parameters, it is necessary to set different faults.

TABLE 2. Equivalent parameters of the UD model.
5.3 Verification of the equivalent parameters
To verify the equivalent system of using the UD model, two additional faults are set as (p.u.): Zf3 = 0 + 0.001p.u. And Zf4 = 0 + j0.004. The equivalent results with the UD model are compared with those using the existing type 2 PV model in PSASP. The active power of the original and equivalent system is shown in Figure 6. Under fault 3, because the grounding impedance is small, the voltage drop is severe, and PVs mainly run in the LVRT state when the fault occurs. Therefore, the equivalent with the existing type 2 PV model and the UD model is both ideal. Under fault 4, because the grounding impedance is large, the voltage drop is light, and some PVs exit the LVRT state before the fault removal. Therefore, the equivalent system using the type 2 PV model cannot accurately simulate the active power characteristics of the original distribution network with PVs in different states. However, the equivalent system using the UD model established in this paper can fit the characteristics of the original system under fault 4. Overall, the accuracy of the equivalent system with the UD model is higher than using the type 2 PV model.
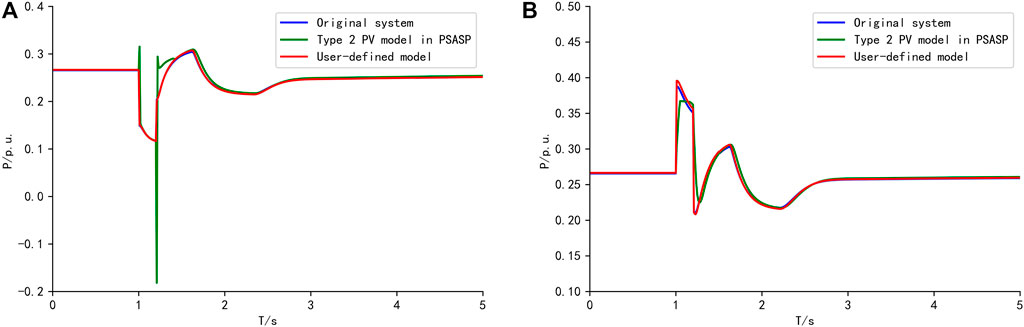
FIGURE 6. Comparison of equivalent results. (A) Fault 3, (B) Fault 4.
Different operating conditions also need to be considered to verify the generalization capability of the equivalent parameters. In this paper, the following three operating conditions are set according to the out-of-service, power-increment, and reduction of PVs.
(1) PV 4 and 7 are in out-of-service state. The comparison of active power characteristics is shown in Figure 7.
(2) The active power of PV 1, 3, and 7 is increased by 50%. The comparison is shown in Figure 8.
(3) The active power of all PVs is halved. The comparison is shown in Figure 9.
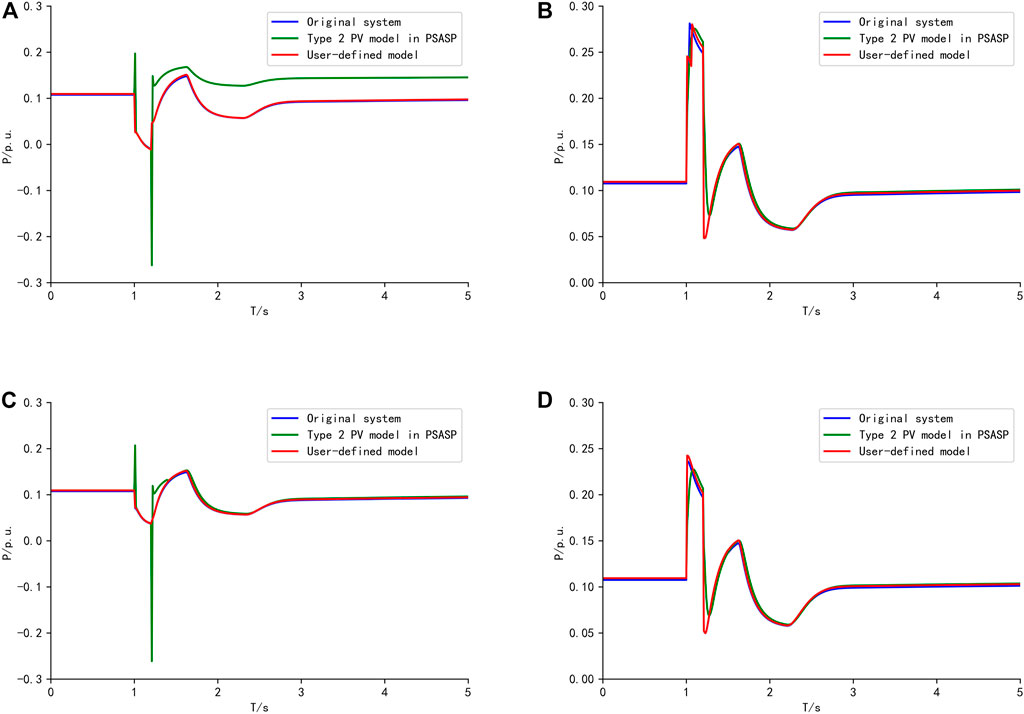
FIGURE 7. Comparison of active power response of condition 1. (A) Fault 1, (B) Fault 2, (C) Fault 3, (D) Fault 4.
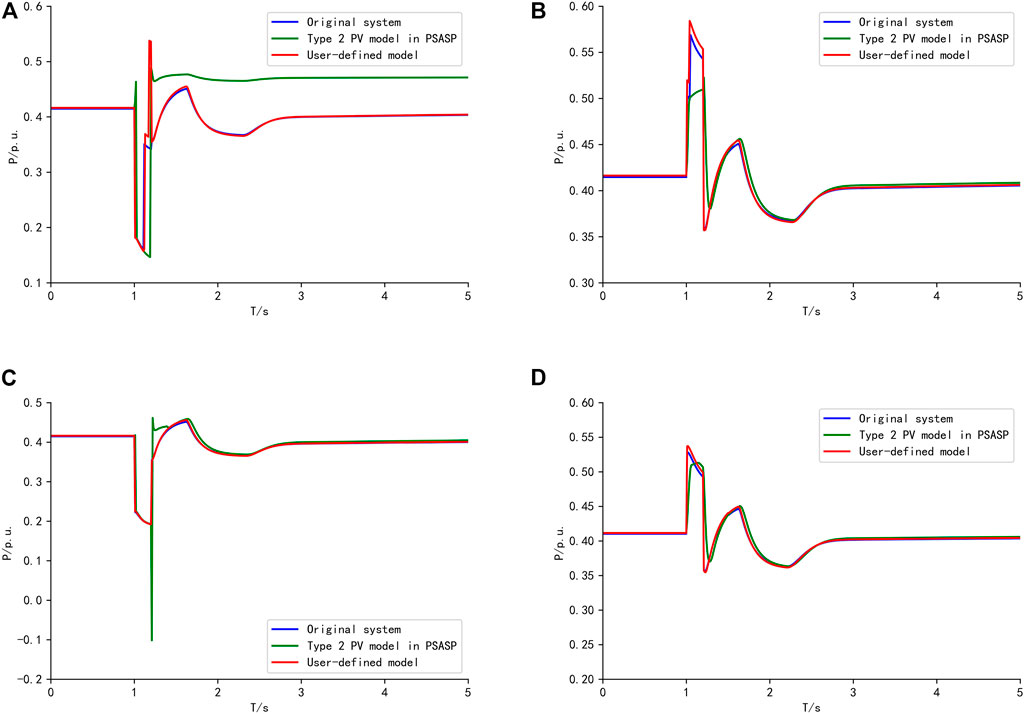
FIGURE 8. Comparison of active power response of condition 2. (A) Fault 1, (B) Fault 2, (C) Fault 3, (D) Fault 4.
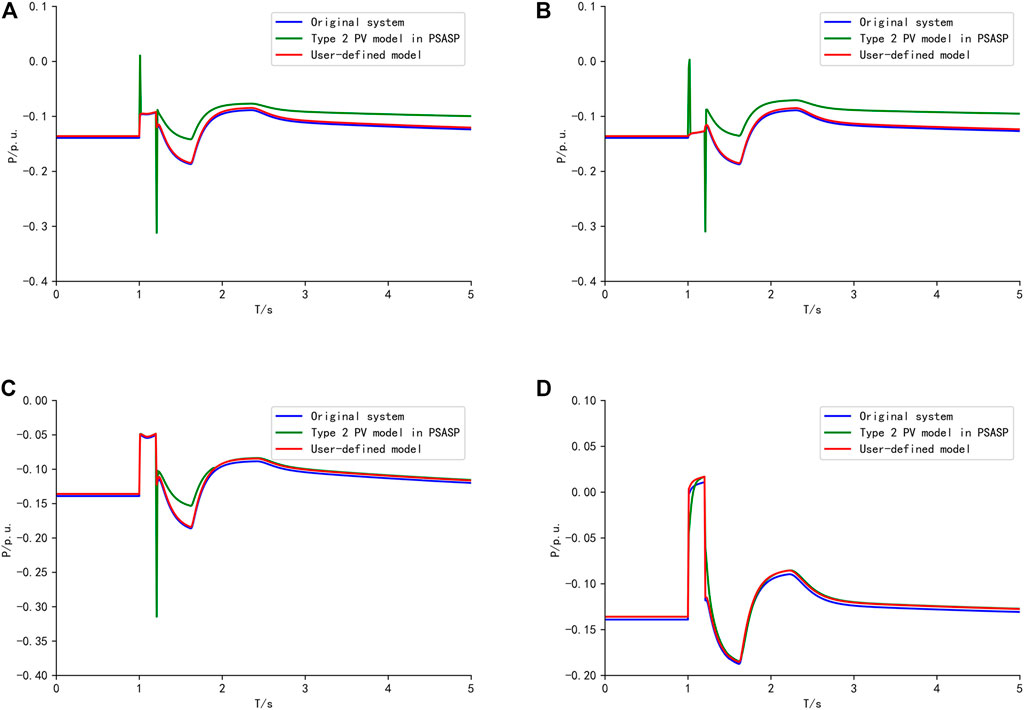
FIGURE 9. Comparison of active power response of condition 3. (A) Fault 1, (B) Fault 2, (C) Fault 3, (D) Fault 4.
The equivalent parameters in Table.2 are used for the equivalent of the above three operating conditions. The RMSE of the active power between the original system and the equivalent system with the UD model and the type 2 PV model is shown in Table 3.
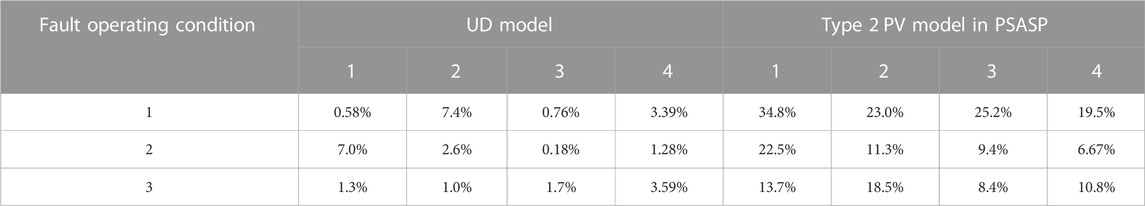
TABLE 3. Comparison of equivalent results using the UD model and type 2 PV model.
It can be seen that compared with the type 2 PV model in PSASP, the RMSE of equivalent results using the UD model is decreased significantly. Therefore, the single-panel equivalent of the distribution network with PVs can be achieved by using the UD model. Furthermore, the parameters obtained by the improved PSO can be used under multiple faults and operating conditions.
6 Conclusion
This paper proposes an equivalent method of the distribution network with distributed PVs for electromechanical transient study based on UD modeling. The equivalent structure of the distribution network which includes distribution lines, loads, and distributed PVs is built. A UD model with multiple sets of parameters is established in this paper to achieve the equivalent of distributed PVs in different operating states into one node. The equivalent using the UD model can decrease PV nodes in the equivalent system and improve simulation efficiency. Furthermore, due to the flexibility of the UD modeling method, the established model can be further modified as needed. The multiple equivalent parameters of the UD model are obtained by the PSO algorithm. By improving PSO, the optimization of parameters can be used for the equivalent of the distribution network with distributed PVs under multiple faults and operating conditions.
The results of the simulations in PSASP show that using the UD model established in this paper can achieve the equivalent of the original distribution network under multiple faults and operating conditions with high accuracy.
Data availability statement
The raw data supporting the conclusion of this article will be made available by the authors, without undue reservation.
Author contributions
ZJ identified the research theme. KZ collected the resources and data needed for the study. ZH built the UD model and conducted simulation experiments. ZZ and NZ proposed the equivalent parameters optimizing method and improved it. All authors contributed to the manuscript revision, read, and approved the submitted version.
Funding
This work was supported by Project “Safety and stability risk rapid forward warning technology of power system with high penetration of renewables and inverters” funded by State Grid Shandong Electric Power Company under Grant No. 520626220001.
Acknowledgments
We thank the for State Grid Shandong Electric Power Company and the PV manufacturers giving the necessary resources to conduct the research.
Conflict of interest
The authors declare that the research was conducted in the absence of any commercial or financial relationships that could be construed as a potential conflict of interest.
Publisher’s note
All claims expressed in this article are solely those of the authors and do not necessarily represent those of their affiliated organizations, or those of the publisher, the editors and the reviewers. Any product that may be evaluated in this article, or claim that may be made by its manufacturer, is not guaranteed or endorsed by the publisher.
Supplementary material
The Supplementary Material for this article can be found online at: https://www.frontiersin.org/articles/10.3389/fenrg.2023.1119254/full#supplementary-material
References
Chang, Z., Yang, Z., Song, G., Huang, W., Ku, Y., Su, G., et al. (2012). Analysis on asymmetric fault current characteristics of inverter interfaced distributed generator under positive-sequence and negative-sequence current respective control strategy. Electr. Power Autom. Equip. 38 (1), 44–51. doi:10.16081/j.issn.1006-6047.2018.01.006
Chao, Pupu., Li, Weixing., Peng, Simin., Liang, X., Zhang, L., and Shuai, Y. (2021). Fault ride-through behaviors correction-based single-unit equivalent method for large photovoltaic power plants. IEEE Trans. Sustain. Energy 12 (1), 715–726. doi:10.1109/tste.2020.3017174
Feng, H., Hou, M., Liu, S., and Wang, H. (2015). Analysis of the photovoltaic cells output power based on the door-connection under mismatch, Proceedings of the IEEE PES Asia-Pacific Power and Energy Engineering Conference(APPEEC).Australia November 2015 doi:10.1109/appeec.2015.7380905
Han, P., Lin, Z., Zhang, J., Xia, Y., and Wang, L. (2019). Equivalent modeling of photovoltaic power plant based on factor analysis and Correlation Clustering. IEEE Access 7, 56935–56946. doi:10.1109/access.2019.2913946
He, D., Wang, F., and Mao, Z. (2008). Hybrid genetic algorithm for economic dispatch with valve-point effect. Electr. Power Syst. Res. 78 (4), 626–633. doi:10.1016/j.epsr.2007.05.008
International Energy Agency (2022). Solar PV – analysis - IEA. Available at: https://www.iea.org/reports/solar-pv.
Ishaque, K., Salam, Z., Amjad, M., and Mekhilef, S. (2012). An improved particle swarm optimization (PSO)–Based MPPT for PV with reduced steady-state oscillation. IEEE Trans. Power Electron. 27 (8), 3627–3638. doi:10.1109/tpel.2012.2185713
Kim, G. C., Ibraheem, W. E., and Ghani, M. R. A. (2014). Impact of photovoltaic (PV) systems on distribution networks. Int. Rev. Model. Simulations 7 (2), 298–310. doi:10.1016/j.rser.2015.08.042
Li, H., Pang, S. L., and Huang, J. D. (2014). Equivalent modeling and simulation of large photovoltaic station. Appl. Mech. Mater. 615, 27–30. doi:10.4028/www.scientific.net/amm.615.27
Li, S., Liu, Z., Hao, X., and Jia, S. (2010). Dynamic equivalence to induction generators and wind turbines for power system stability analysis. Proceedingd of the 2nd International Symposium on Power Electronics for Distributed Generation Systems.July 2010 Hefei, China doi:10.1109/pedg.2010.5545879
Liu, Zhongqian. (2018). Equivalence of photovoltaic cluster and identification for inverter controller parameters. Hefei: Hefei University of Technology.
Ma, F., and Vittal, V. (2012). A hybrid dynamic equivalent using ANN-based boundary matching technique. IEEE Trans. Power Syst. 27 (3), 1494–1502. doi:10.1109/tpwrs.2012.2182783
Ma, Z., Zheng, J., Zhu, S., Wei, L., Shen, X., Wang, Z., et al. (2016). Online clustering modeling of photovoltaic power plant with LVRT control function. Proceedingd of the IEEE International Conference on Power System Technology (POWERCON).Australia September 2016 doi:10.1109/powercon.2016.7753851
Meng, H., Ye, X. H., Yang, M. Y., Song, X., Su, Z., Liu, W., et al. (2017). Equivalent modeling and simulation for PV system on dynamic clustering equivalent strategy. Proceedings of the IECON 2017 - 43rd Annual Conference of the IEEE Industrial Electronics Society.October 2017 Beijing, China doi:10.1109/iecon.2017.8217002
Shah, R., Mithulananthan, N., Sode-Yome, A., and Lee, K. Y. (2010). Impact of large-scale PV penetration on power system oscillatory stability. Proceedings of the IEEE PES General Meet.July 2010 Minneapolis, MN, USA doi:10.1109/pes.2010.5589660
Shan, G., Hangwei, J., and Haiteng, H. (2016). Reliability analysis of active distribution network with distributed renewable power plant cluster. Proceedings of the 2016 China International Conference on Electricity Distribution (CICED).August 2016 Xi'an, China doi:10.1109/ciced.2016.7576271
Toledo, O. M., Oliveira Filho, D., and Diniz, A. S. (2010). Distributed photovoltaic generation and energy storage systems: A review. Renew. Sustain. Energy Rev. 14 (1), 506–511. doi:10.1016/j.rser.2009.08.007
Villalva, M. G., Gazoli, J. R., and Filho, E. R. (2009). Comprehensive approach to modeling and simulation of photovoltaic arrays. IEEE Trans. Power Electron. 24 (5), 1198–1208. doi:10.1109/tpel.2009.2013862
Wadhah, E. I., Chin, K. G., and Mohd, R. A. G. (2014). Impact of photovoltaic (PV) systems on distribution networks. Int. Rev. Model. Simulations (I.RE.MO.S.) 7 (2), 298–310.
Wang, X. Y. (2012). Modeling of large scale photovoltaic power station and research on its external characteristics. Beijing: Beijing Jiaotong University.
Wu, H. P., Liu, Z. Q., Chen, Y., Xu, B., and Qi, X. (2018). Equivalent modeling method for regional decentralized photovoltaic clusters based on cluster analysis. CPSS Trans. Power Electron. Appl. 3 (2), 146–153. doi:10.24295/cpsstpea.2018.00014
Keywords: distributed photovoltaic, distribution network, user-defined modeling, dynamic equivalent, transient simulation
Citation: Jiang Z, Zhao K, He Z, Zhang Z and Zhou N (2023) Equivalent of distribution network with distributed photovoltaics for electromechanical transient study based on user-defined modeling. Front. Energy Res. 11:1119254. doi: 10.3389/fenrg.2023.1119254
Received: 08 December 2022; Accepted: 13 January 2023;
Published: 23 January 2023.
Edited by:
Enhua Wang, Beijing Institute of Technology, ChinaReviewed by:
Xiaokang Liu, Politecnico di Milano, ItalyAnwar Shahzad Siddiqui, Jamia Millia Islamia, India
Copyright © 2023 Jiang, Zhao, He, Zhang and Zhou. This is an open-access article distributed under the terms of the Creative Commons Attribution License (CC BY). The use, distribution or reproduction in other forums is permitted, provided the original author(s) and the copyright owner(s) are credited and that the original publication in this journal is cited, in accordance with accepted academic practice. No use, distribution or reproduction is permitted which does not comply with these terms.
*Correspondence: Zhenghua He, aGV6aHVhQG1haWwuc2R1LmVkdS5jbg==