 Zhang Hao
 Lu Hai1
 Wu Zhi
 Tang Chong
- 1Electric Power Research Institute, Yunnan Power Grid Co., Ltd., Kunming, Yunnan, China
- 2Electric Power Research Institute, CSG, Guangzhou, Guangdong, China
- 3School of Electrical Engineering, Southeast University, Nanjing, Jiangsu, China
- 4Dehong Power Supply Bureau, Yunnan Power Grid Co., Ltd., Dehong, Yunnan, China
In order to further promote the interconnection development and construction of the power grids between the Lancang-Mekong countries and Southern China region and facilitate multilateral energy interaction, an assessment mechanism of the power balance and power trade potential between the two areas under long-term operation simulation is proposed. The mechanism first analyzes the energy supply structure, energy use forms, cross-border transmission capacity, and multi-area power trade potential of the power grids of the Lancang-Mekong countries and Southern China. Secondly, a power and electricity optimization model considering the long-period operation characteristics of generating units and regional interconnection transmission constraints is constructed, which can optimize the solution of a typical time-series operation scenario of 8760 h a year and improve the accuracy of regional power trade potential analysis. The results show that the Lancang-Mekong countries and the southern region of China have a significant potential for power trading, and the construction of a unified power trading market is vital for promoting the optimal allocation of power resources, achieving power balance, increasing the proportion of energy consumption, and reducing the cost of electricity consumption.
1 Introduction
Cross-border cooperation and trade in energy have become an important grip for implementing the “Belt and Road” initiative. Southeast Asia is the world’s third most populous region, China’s third-largest trading partner, and the southern route of the “One Belt and One Road”. With the development of “China-Vietnam-Myanmar-Lao” economic cooperation, the contradiction between the fast-growing energy demand and the local energy infrastructure in the border areas and cities in the Lancang-Mekong countries has become more obvious. As the first domestic power grid enterprise to “go global” and the Chinese implementation unit of the Greater Mekong Sub-region (GMS) power cooperation authorized by the State Council, Southern Power Grid is responsible for promoting cross-border power interconnection and sharing the benefits of green energy among bilateral people (She et al., 2021). With the development and promotion of Vietnam’s Vinh Tan coal-fired power plant Phase I BOT project, Laos’ Namtha River No. 1 hydropower plant project, Chile’s ETC equity acquisition project, and Laos’ 230 kV northern power grid EPC project (Wu et al., 2020), while deepening the power trading between the two sides, many problems such as different energy market mechanisms for cross-border trading cooperation and difficulties in bilateral coordination and scheduling have also been revealed.
The Lancang-Mekong region is rich in hydropower resources. However, the degree of hydropower development is generally low, the scale of cross-border power transactions is small, and the potential for optimal allocation of power resources can be huge (Xing, 2017). Suppose the optimal allocation of power resources in the Lancang-Mekong region can be further promoted through cooperation to improve energy utilization efficiency. In that case, it will greatly ease the contradiction between the large power demand and scarce energy resources in the southern region of China, improve the proportion of energy consumption and reduce power consumption costs at the same time.
Europe, North America, and other regions have built a unified regional electricity market to solve the conflict between regional energy demand and shortage. Their market reform, trading scope integration, and expansion of relevant experience and practices can bring some inspiration and reference to constructing a unified electricity market in the southern region of China and the Mekong countries (Ngan, 2010). Taking European countries as an example (Amundsen and Bergman, 2006; Le et al., 2019; Zhang, 2019), Germany has achieved interconnection with seven neighboring countries, and the interconnection capacity exceeds 25% of the maximum system load and 33% of the installed landscape capacity. The complete interconnection with neighboring countries provides essential support for Germany’s high proportion of new energy consumption. Portugal is connected to the Spanish grid with a maximum power exchange capacity of 3.1 million kilowatts, 59% of Portugal’s installed landscape capacity. Spain is connected to France, Portugal, and Morocco grids, with a maximum power exchange capacity of 6.85 million kilowatts and 23.2% of Spain’s installed landscape capacity. The Danish grid is interconnected with Norway, Sweden, and Germany through 14 liaison lines, with a connected capacity of more than 5 GW, close to the total installed capacity of scenery at the end of 2015, using the rich hydropower resources in Northern Europe to play a good regulating role in the consumption of wind power in Denmark. As an Independent System Operator ISO (Independent System Operator), the three main functions of the U.S. PJM power market are grid operation and management, market operation and management, and regional grid planning (Bushnell et al., 2007), which achieves resource complementarity while meeting power demand, improves power system efficiency and promotes the development and consumption of clean, low-carbon energy.
The source and load complement each other in the southern region of China, forming a closely connected grid system based on the hybrid AC/DC grid. From the perspective of the source-load complementary relationship, there is a continuous demand for a “west-east power supply”. Guangdong and Guangxi have a strong electricity demand. At the same time, Yunnan and Guizhou in the west are important power bases, thus creating a stable demand for electricity from the west to the east. From the grid connection, the southern region has formed a 500 kV and above voltage level’s primary grid of the west-east power transmission channel; the capacity of the west-east power transmission channel reached 58 million kilowatts, the annual scale of power transmission of more than 230 Terawatt hours, which also for the better realization of the optimal scheduling of resources, promote the construction of regional markets, especially to meet the fluctuation characteristics of new energy. In particular, it provides strong support for constructing a regional spot market that adapts to the volatile characteristics of new energy (Zhu et al., 2021).
This paper proposes a mechanism to evaluate the multi-stage power trading potential of the Lancang-Mekong countries and the Southern China region by setting different boundary conditions and considering different boundaries, such as whether the region is jointly optimized and whether the capacity constraints of the contact lines are taken into account, respectively. On this basis, a regional power balance analysis mechanism based on 8760 h of annual operation simulation is proposed, and power balance indexes and calculation methods reflecting power balance and power balance of all typical annual operation scenarios are designed to improve the accuracy of power balance analysis. Based on the actual data of Yunnan Power Grid and the five Lancang-Mekong countries, a long-period operation scenario for joint optimization of the regional power system is constructed. The simulation results show that the Lancang-Mekong countries and the southern region of China have a large potential for power trading, and the construction of a unified power trading market plays an important role in promoting the optimal allocation of power resources, achieving power balance, improving the proportion of energy consumption, and reducing the cost of electricity consumption.
2 Analysis of the characteristics of power coupling and complementary transactions between the Mekong countries and the southern China region
2.1 Power supply structure development status
In terms of power supply, the hydropower resources in the Lancang-Mekong countries are very abundant. However, the degree of hydropower development is generally low and the scale of cross-border power transactions is small. If a unified regional power market is established, the construction level of the power grids in the Lancang-Mekong countries can be significantly improved, and at the same time ease the power demand in the southern region of China with unexploited surplus water resources. The power supply structure of Lancang-Mekong countries is shown in Figure 1.
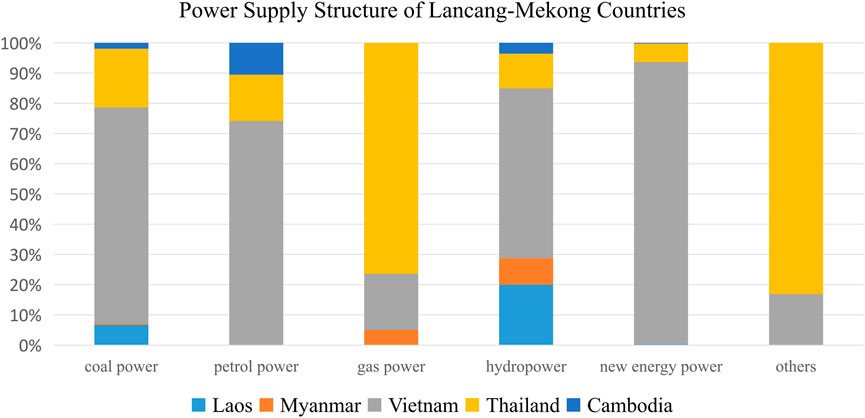
FIGURE 1. Power supply structure of Lancang- Mekong countries.
The five provinces of Southern China have apparent differences in power supply structures which can be seen in Figure 2, and have started to invest in the development of clean energy on a large scale. Facing the problem of energy consumption, the southern region has a large demand for electricity. Establishing a unified regional electricity market can help alleviate the contradiction between the great demand for electricity and the scarcity of energy resources in the southern region of China, improve the proportion of energy consumption and reduce the cost of electricity.
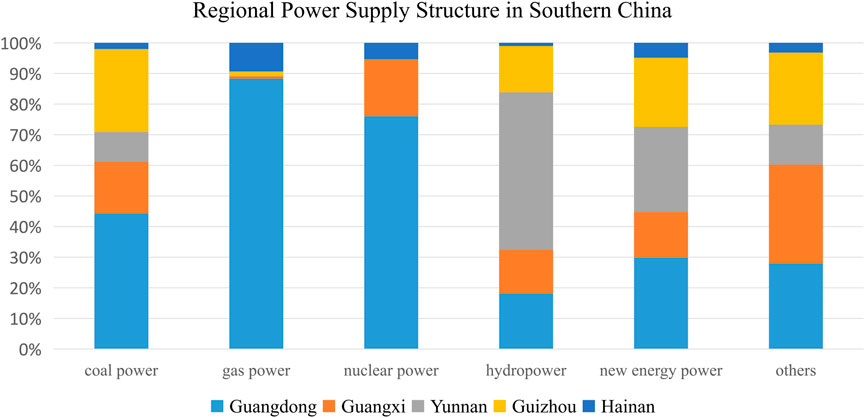
FIGURE 2. Regional power supply structure in southern China.
2.2 Status of load structure development
In terms of load, the five Lancang-Mekong countries have been increasing the load level with social development. However, with the outbreak of the new crown epidemic, the degree of impact of the epidemic varies from country to country. The load forecast results shown in Figure 3 and Figure 4 are revised according to the degree of impact (Zhao, 2020).
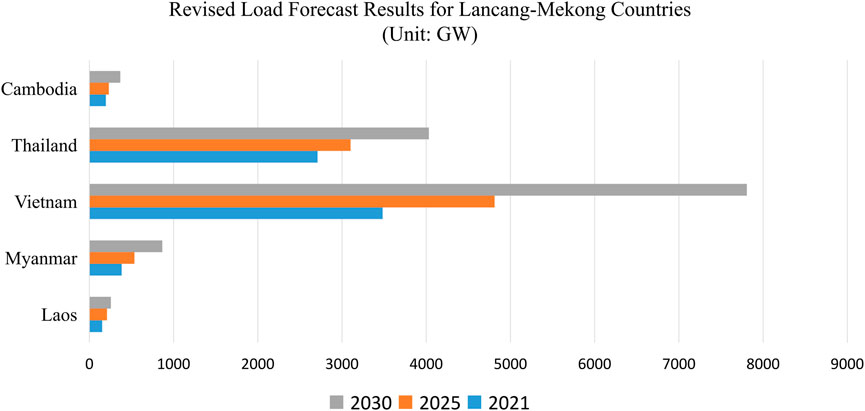
FIGURE 3. Revised load forecast results for Lancang- Mekong countries.
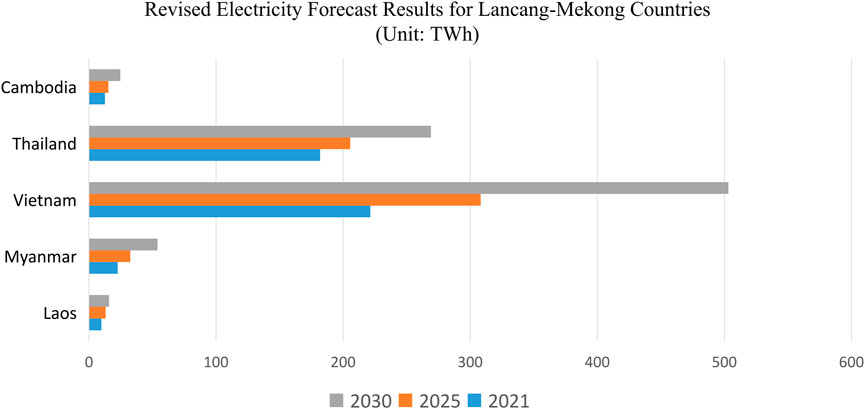
FIGURE 4. Revised electricity forecast results for Lancang- Mekong countries.
The regional load level in southern China shows more stable growth; taking Yunnan as an example, the forecast results are shown in Table 1 as follows.
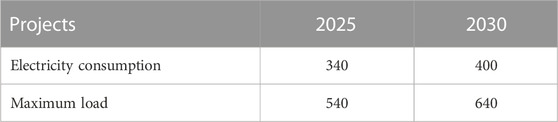
TABLE 1. Electricity demand of Yunnan in 2025 and 2030 (Unit: TWh/GW).
2.3 Multilateral complementary properties
The net load curves of Yunnan and the five Lancang-Mekong countries are shown in Figure 5 below. Net load is the rest part after subtracting photovoltaic and wind power from load. If sunshine or wind is abundant, then the net load can decrease. From April to September, the net load of Mekong continues to decline, while the net load of Yunnan shows an upward trend and reaches its peak in August and September, during which time the Lancang-Mekong countries can send electricity to Yunnan; from September to March, the net load of Yunnan shows a downward trend, while the net load of Lancang-Mekong countries shows a peak so that Yunnan can send electricity back to the Lancang-Mekong countries. The curve shows that Yunnan and the Lancang-Mekong countries have great potential to complement each other and have the first conditions to build a unified power trading market.
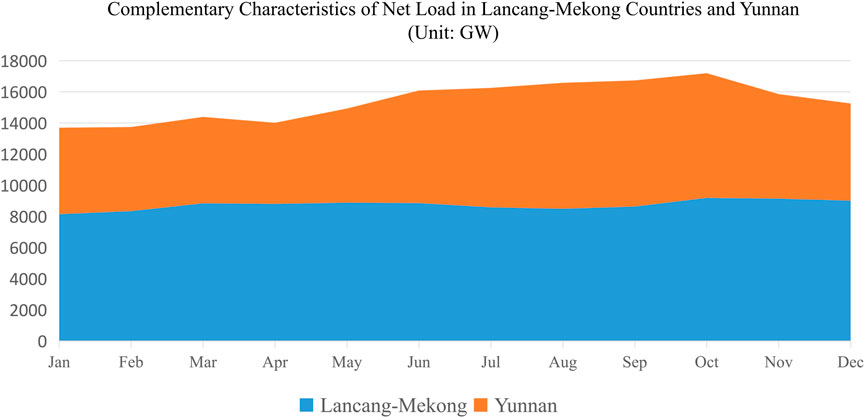
FIGURE 5. Complementary characteristics of net load in Lancang- Mekong countries and Yunnan.
3 Model for assessing the complementary potential of the lancang-mekong countries and the southern China region
3.1 Assessment mechanism characteristics
The assessment mechanism of the power trading potential between the Mekong countries and the Southern China Power Grid under the long-period operation simulation takes into account the energy supply structure, energy use form, cross-border transmission capacity, and multi-area complementary potential of the Mekong countries and the Southern China Power Grid (Xiao et al., 2016), and realizes the assessment of the multi-stage power complementary potential between the Mekong countries and the Southern China Power Grid by setting different boundary conditions.
Its features are: 1) providing a variety of optimization objectives to meet different simulation needs; 2) considering long-term continuous unit combination models; 3) applicable to multi-area DC interconnection systems; 4) fully considering the supply structure and energy use forms of each country; 5) setting different boundary conditions to realize multi-stage power complementary potential assessment.
3.2 Mathematical model of the evaluation mechanism
1) Optimization objectives
The lowest operating cost is used as the objective function for the analysis. This objective function is a scheduling decision that integrates system generation economics, load shedding costs, and removal of new energy, and is expressed as
where: C is the lowest cost of the combined grid, C1 is the lowest cost of the China Southern Power Grid, and C2 is the lowest cost of the Lancang-Mekong Power Grid. Subscript 1 and 2 denote China Southern Power Grid and Lancang-Mekong Power Grid respectively. T is the number of optimization time periods, and
2) Constraints
To simplify the process, we divide the units in the Lancang-Mekong countries into thermal power units which are not participating in intraday start-stop management, thermal power units which are participating in intraday start-stop management, hydropower units, wind power units, and photovoltaic power units. Among them, wind turbines and PV units are introduced with a removal mechanism, so that the model removes part of the output when the system cannot achieve load balancing under extreme output conditions or when wind power or PV delivery is blocked. For the hydropower units, the short-term economic dispatch model of stepped hydropower is considered, and the operating constraints of hydropower units, reservoir operating constraints, and upstream and downstream reservoir water balance constraints are introduced in the model to precisely describe the operation process of hydropower units in detail.
1) Thermal power unit constraints
The thermal power unit constraints mainly include upper and lower thermal power unit output limits as well as creep constraints, denoted as
where: Subscript 1 and 2 denotes China Southern Power Grid and Lancang-Mekong Power Grid respectively.
where: Subscript 1 and 2 denote China Southern Power Grid and Lancang-Mekong Power Grid respectively.
2) Hydropower unit constraints
3) Renewable energy unit constraints (Li et al., 2019)
Since the renewable energy output is random, variable, and uncontrollable, the output of renewable energy is controlled to operate within the predicted value in the dispatching operation. At the same time, according to the requirement of energy conservation and environmental protection in the grid operation, the renewable energy generates as much as possible. The model proposed in this paper introduces a balance mechanism to curtail part of the output when the system cannot achieve load balancing under extreme output conditions or the renewable energy delivery is blocked. It is expressed as follows:
where: Subscript 1 and 2 denote China Southern Power Grid and Lancang-Mekong Power Grid respectively.
4) Load balance constraints
The balance constraint between load and generation is expressed as
5) Power line constraints
In performing the regional joint operation simulation, the regional power line transmission capacity constraint is expressed as
where: Subscript 1 and 2 denote China Southern Power Grid and Lancang-Mekong Power Grid respectively.
6) Spinning Reserve constraints
The positive and negative reserve constraints of the system are expressed as
where: Subscript 1 and 2 denote China Southern Power Grid and Lancang-Mekong Power Grid respectively.
where: Subscript 1 and 2 denote China Southern Power Grid and Lancang-Mekong Power Grid respectively.
In the calculation of the positive reserve rate, even if the output of new energy is curtailed, the curtailed portion is included in the reserve capacity. In the negative reserve rate calculation, new energy can be curtailed anytime, so it is not counted as reserve capacity.
In this paper, the values beyond the transmission capacity range are corrected. The corrected transmission curves are used as the designated output of the delivery units to conduct internal simulation runs in the Laos and Myanmar regions as well as the Yunnan region, respectively. According to the results, we obtain the power planning results for 2025 in both Laos and Myanmar as well as the Yunnan region.
4 Calculation method of regional power balance and trading potential assessment index
4.1 Power balance index and calculation method
The continuous, rapid, and uneven power demand growth and the rapid development of renewable energy sources have put forward higher requirements for achieving power balance in the regional unified power market. In order to achieve power balance and ensure regular regional power trading, this paper designs a calculation method for regional power balance and trading potential assessment, which not only gives the deterministic abandonment amount of wind power and photovoltaic power but also improves the accuracy of power balance analysis compared with the traditional power balance method (Hu et al., 2021), and provides a guarantee for regular trading in the power market (Zeng et al., 2017; Ji et al., 2021; Wang et al., 2021; Xu et al., 2022).
Power balance is the primary security issue of power system, which means that the power generation and load should be balanced in real time, otherwise the whole power system may oscillate or even collapse. By calculating the power surplus through our cases, it can be found that the power surplus level of the regional joint optimization is higher than that of the separate optimization, which indicates that the construction of a unified power market can alleviate the situation of insufficient power surplus and ensure the reliability and stability of power supply.
The specific calculation expression for power balance is as follows,
where:
4.2 Energy balance index and calculation method
The energy balance is specifically expressed as follows,
where:
4.3 Peaking balance index and calculation method
The grid is often overloaded during peak consumption. At this time, it is necessary to put in the generator set outside the normal operation to meet the demand. These generating units are called peak shaving units, which is used to regulate the peak of electricity.
The peaking balance is expressed as follows [19]
where:
4.4 Electricity trading indicators and calculation methods
Electricity transaction costs are specifically expressed as follows.
where:
5 Case study
The daily operation curves derived from the operation simulations evaluate the trading potential and power balance analysis. Among them, the load 8760 curve is generated by planning the maximum annual power, annual electric quantity, historical load characteristics, and other parameters. The new energy 8760 curve is generated by using historical power output data and equal scaling of renewable energy planning installations. The reserve capacity in the simulation is taken as 12% of the highest load for the whole society, including 7% for spinning reserve and 5% for non-spinning reserve.
5.1 Operational simulation boundary conditions
Scenario 1(Benchmark Scenario): Without considering power trading, the existing interconnection Scenario between the Mekong countries and the southern region of China treats Laos and Myanmar as a whole and optimizes the power generation in the two regions of Laos and Myanmar and Yunnan, respectively according to the power and load characteristics in 2025, and obtains the power generation situation without power trading.
Scenario 2: Take Yunnan as the optimization subject, equate each of Laos and Myanmar into one out-of-area unit according to the existing interconnection Scenario between the Mekong countries and the southern region of China, set the maximum output constraint and generation capacity constraint, and simulate the power interconnection capacity of Laos, Myanmar, and Yunnan in 2025 under the state of constrained power lines.
Scenario 3: Take the Mekong countries as the optimization subject, equate Yunnan into an out-of-area unit according to the existing interconnection Scenario, set the maximum output constraint and generation capacity constraint, and simulate the power interconnection capacity of Yunnan and Mekong countries in 2025 under the state of constrained power lines.
Scenario 4: Set the installed capacity and load parameters of various power sources in Laos and Myanmar in 2025, and run them jointly with units and loads in Yunnan to simulate the interconnection capacity of Laos, Myanmar, and Yunnan under the ideal scenario of no power line constraint and “same unit bidding".
Scenario 5: Set the installed power and load parameters of various power sources in the five Mekong countries in 2025, and run them jointly with units and loads in Yunnan to simulate the power interconnection potential of the five Lancang-Mekong countries and Yunnan under the long-term plan.
All scenarios are concluded in Figure 6.
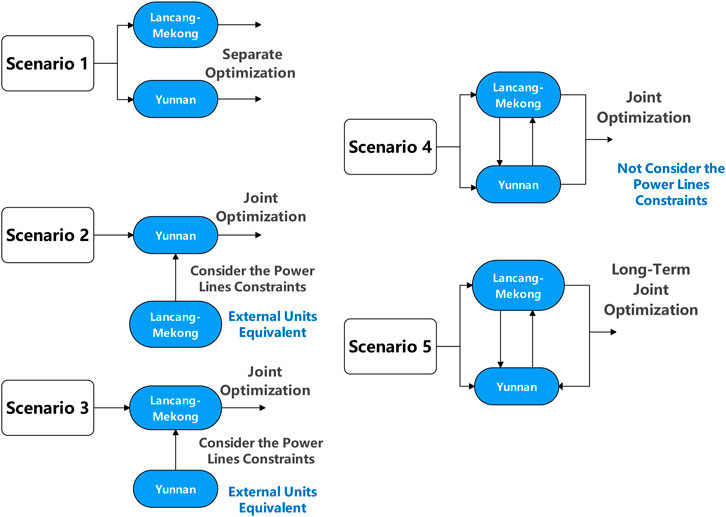
FIGURE 6. Boundary conditions under different scenarios.
In non-joint operation cases, the calculation time for Yunnan and Lancang-Mekong countries operation are 401.45 s and 40.21 s separately, while in joint operation cases, the calculation time are 422.36 s and 56.31 s. Although joint operation seems more complex, its calculation time is acceptable.
In this paper, the transmission price between regions is a fixed parameter set manually. In the case of sufficient transmission capacity, the price difference between regions should be equal to the transmission price between those regions. If the transmission price is set reasonably, the price difference between regions will not be too large or too small.
5.2 Electricity balance analysis
The power surplus of Yunnan, Laos, and Myanmar under different scenarios is obtained using the power balance index calculation method in 4.1. In the benchmark scenario, Yunnan’s power surplus is positive throughout the year and is greater than 3 GW per month with fluctuating values. It achieves a maximum value of 11.7 GW in July and a minimum value of 3.5 GW in October. From Yunnan’s aspect, the power surplus curve is always above the power surplus curve of the benchmark scenario. The monthly power surplus increases, and the reliability of the power supply improves after trading. The minimum value of power surplus is 5.2 GW in October, which is 1.7 GW higher than Scenario 1. However, the maximum value of power surplus appears in December, reaching 13.1 GW, which is 1.8 GW higher than Scenario 1. Standing in the Lancang-Mekong perspective for power trading, the power surplus curve of Yunnan always lies below the power surplus curve of the benchmark Scenario because its delivery units deliver full power to both Lao and Myanmar. The power surplus appears at a minimum value of 1.7 GW in October, which is 1.8 GW less than Scenario 1, and at a maximum value of 10.2 GW in July, which is 1.4 GW less than Scenario 1. Results are shown in Figure 7.
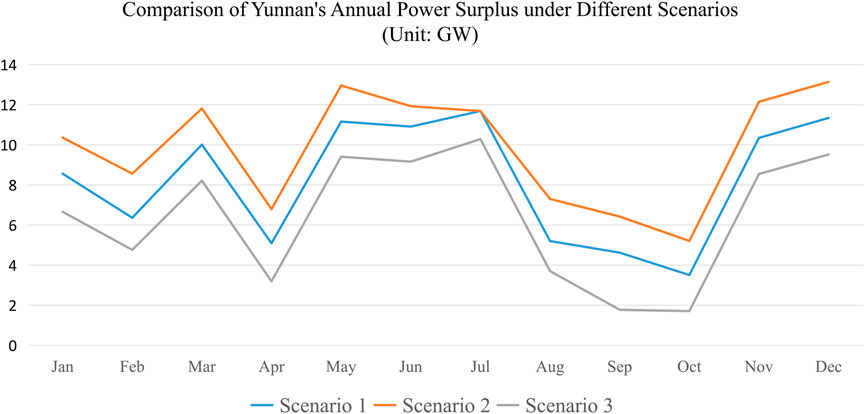
FIGURE 7. Comparison of Yunnan’s annual power surplus under different scenarios.
In the benchmark scenario, Laos has a power surplus of more than 3 GW, which stays stable with high values from January to March, drops sharply from April to June, and gets a minimum power surplus of 10.5 GW in June. It has a small increase from July to September, and a larger increase from September to October, and then stays stable. The benchmark scenario has a maximum value of 13.3 GW in January. Scenario 2’s and Scenario 3’s trends are roughly the same as the benchmark. When seeing power trading from the Lancang-Mekong perspective, the power surplus also has a minimum value of 3.4 GW in February and a maximum value of 13.7 GW in January. From the Yunnan perspective, the power surplus shows a minimum value of 4.5 GW in June and a maximum value of 12.5 GW in January. Results are shown in Figure 8.
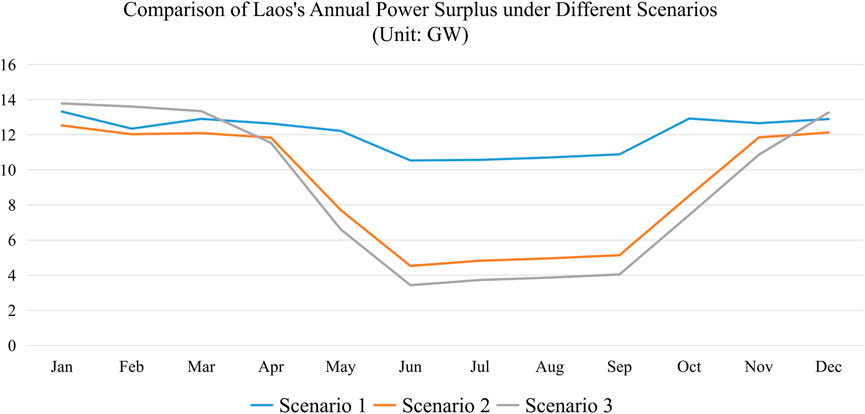
FIGURE 8. Comparison of Lao’s annual power surplus under different scenarios.
In the benchmark scenario, the power surplus in Myanmar is less than 0. The power surplus is seriously insufficient, with a minimum value of -13.9 GW in February, after which the power surplus starts to increase, approaching -5 GW in the flood season from June to September, with a maximum value of -4.82 GW in July. After September, the power surplus starts to decline significantly again. Scenarios 2 and 3 show roughly the same trend as the benchmark scenario. The overall curve is highest when power trading from the Lancang-Mekong perspective, as Yunnan’s delivery units deliver full power to Myanmar. The power surplus also shows a minimum value of -12.1 GW in February and a maximum value of 13.7 GW in June. When seeing from Yunnan’s perspective, the power surplus shows a minimum value of -14.2 GW in February and a maximum value of -1.24 GW in June. Results are shown in Figure 9.
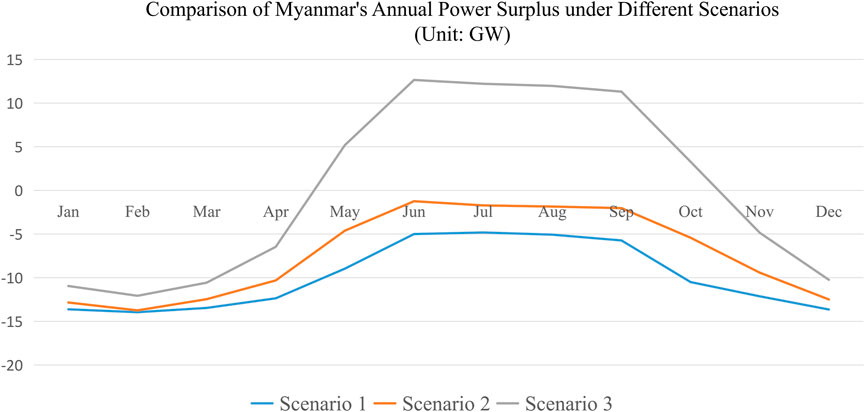
FIGURE 9. Comparison of Myanmar’s annual power surplus under different scenarios.
Separately analyze Scenario 4 and Scenario 5, and show the results in Figure 10. Scenario 4 considers the power transactions between Yunnan and Lao-Myanmar without power line constraints. The minimum value occurs in February at 6.2 GW, which is larger than the sum of the power surpluses under Scenario 1 when Yunnan and Lao-Myanmar are optimized separately. The maximum value occurs in August, at 16.3 GW, which can maintain a surplus of more than 10 GW during the summer flood season. Scenario 5 considers the long-term power transactions between Yunnan and the five Lancang-Mekong countries. Its minimum value occurs in September at 34.4 GW, and the maximum value occurs in June at 52 GW, with an average power surplus of 43.2 GW. The curve proves that conducting long-term power interconnection is beneficial to increasing the regional power surplus and maintaining the stability of the power supply.
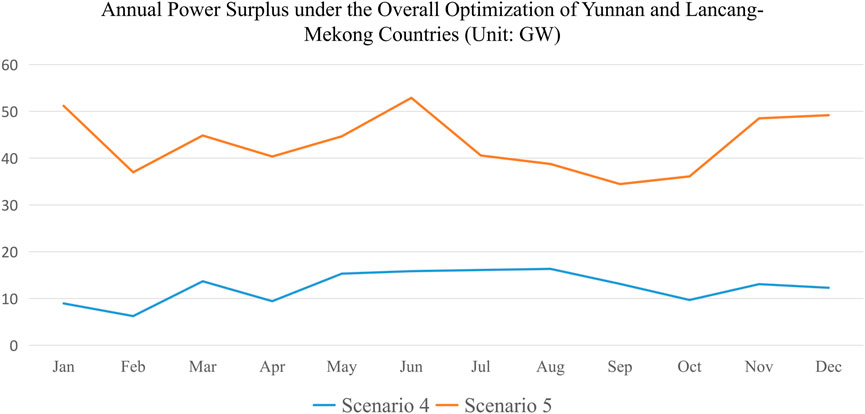
FIGURE 10. Annual power surplus under the overall optimization of Yunnan and Lancang- Mekong countries.
5.3 Energy balance analysis
Compare the month-by-month thermal power generation in Yunnan under different scenarios. In the benchmark scenario, the thermal power generation in Yunnan troughs during the summer hydro generation period, reaching a minimum of 0.9 TWh in July. January, May, and November witness three peaks concerning thermal power generation, reaching 5.1 TWh, 5.1 TWh, and 4.9 TWh, respectively. The thermal power generation in each month of Scenario 2 is lower than the benchmark scenario, proving that conducting power interconnection benefits the consumption of clean energy and reduces thermal power generation. It obtains a minimum value of 0.5 TWh in July and a maximum value of 3.9 TWh in January. Scenario 3 has a higher monthly thermal generation than the benchmark scenario due to the need for outbound transmission, obtaining a maximum value of 6.2 TWh in January and a minimum value of 1.6 TWh in July. Scenario 4 has thermal power output close to zero from June to September, but the thermal power generation value is greater than the benchmark scenario during December and March. The trend of the generation curve of Scenario 5 tends to be consistent with the above four scenarios, obtaining a minimum value of 1.9 TWh in September and a maximum value of 7.5 TWh in January. Results are shown as Figure 11.
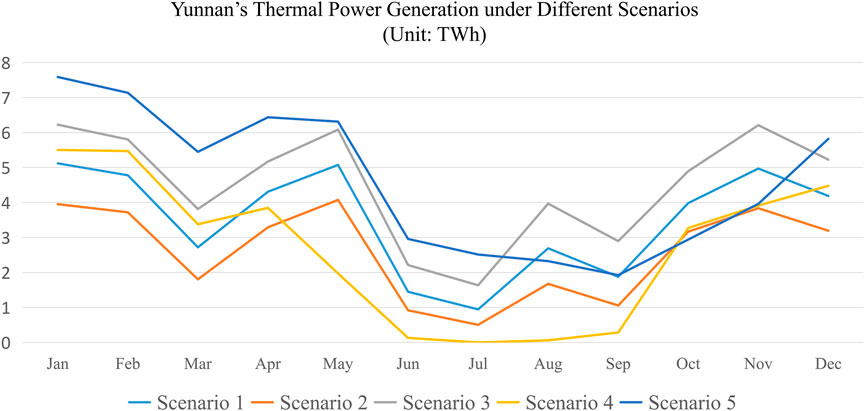
FIGURE 11. Yunnan’s thermal power generation under different scenarios.
The following Figure 12 shows the level of hydropower generation in Yunnan. The curves of the five scenarios follow the same trend, with the minimum value of hydropower generation obtained in February, and the power generation has been on an upward trend since February, with the most obvious magnitude from May to July, all reaching the maximum value in August, and then starting to decline continuously in September. The curves from top to bottom are arranged in the order of Scenario 5, Scenario 3, Scenario 1, Scenario 2, and Scenario 4.
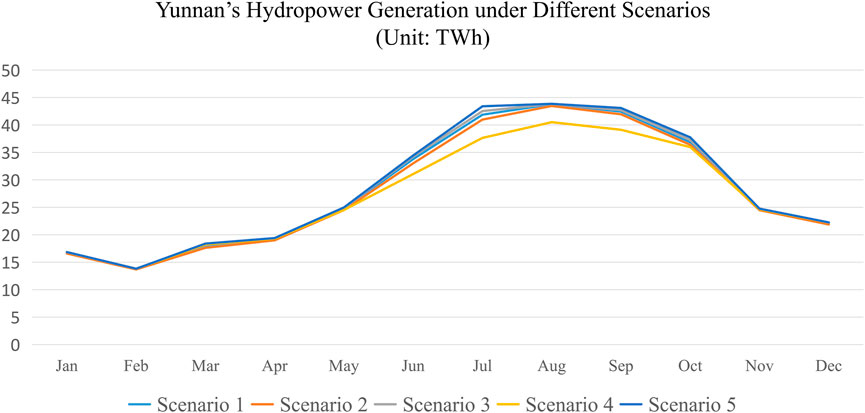
FIGURE 12. Yunnan’s hydropower generation under different scenarios.
The power utilization hours for different scenarios in Yunnan shown as Figure 13 are obtained by counting the generation capacity of the units and the installed capacity. For thermal power, Scenario 2 has 596 fewer thermal power utilization hours than the benchmark scenario, i.e., a 25.9% decrease; Scenario 3 has 482 more thermal power utilization hours than the benchmark scenario, an increase of 21%; Scenario 4 has 624 less thermal power utilization hours than the benchmark scenario, a decrease of 27.1%. Scenario 5 has more thermal power utilization hours than the benchmark scenario at 3,025 h due to its vast area and heavy load. For hydropower, Scenario 2 has 89 h less than the benchmark scenario, a decrease of 2.1%; Scenario 3 has 30 h more than the benchmark scenario, an increase of 0.7%; Scenario 4 has 210 h less than the benchmark scenario, a decrease of 4.9%; and Scenario 5 has 30 h more than the benchmark scenario, an increase of 0.7%. Scenario 2 has the same number of wind power utilization hours for wind power as Scenarios 3, 4, and 5, all 203 h more than the benchmark scenario, i.e., an increase of 7.89%. For PV, Scenario 2 has the same wind power utilization hours as Scenarios 3, 4, and 5, which are 16 h more than the benchmark scenario, i.e., an increase of 1.43%. Except for the benchmark scenario, all other scenarios in Yunnan have no wind and light abandonment. Detailed data are shown in Table 2.
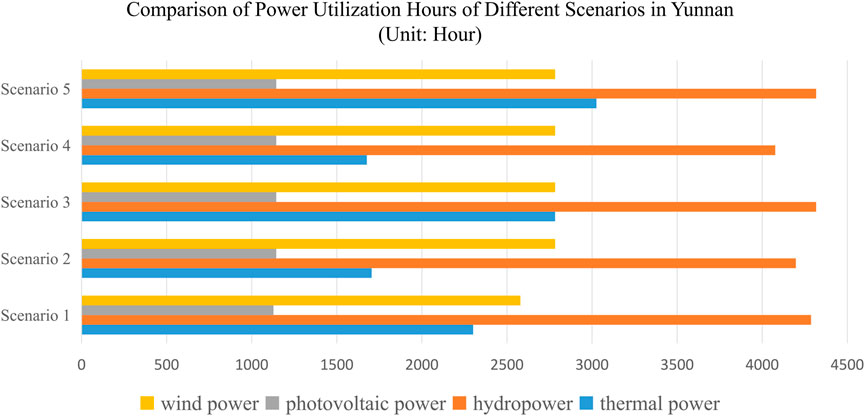
FIGURE 13. Comparison of power utilization hours of different scenarios in Yunnan.
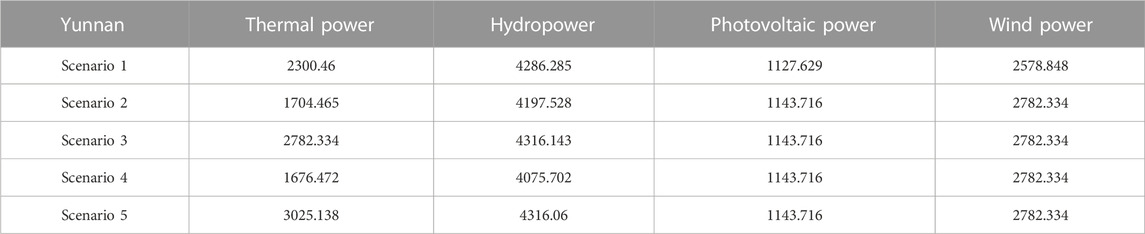
TABLE 2. Power utilization hours of different scenarios in Yunnan (Unit: Hour).
5.4 Complementary potential assessment
The curves of power delivered outside for Yunnan, Laos, and Myanmar under different scenarios are obtained by counting the output of the delivery units and the difference between the generation and load of each region.
Scenario 2 stands for power interconnection from Yunnan’s perspective, where Yunnan gets full power from Lao and Myanmar units. Scenario 3 stands for power interconnection from Lancang-Mekong’s perspective, where Yunnan’s units send full power to Lao and Myanmar units. Hence, the curves of Scenarios 2 and 3 are basically in the form of straight lines opposite each other. The total amount of incoming power sold in Scenario 4 is 25.9 TWh. Yunnan sends power to Lancang-Mekong from January to March and December, gets power from Lancang-Mekong countries from April to November, and gets the maximum amount of incoming power sold in August of 5.9 TWh. The total power sent out from Scenario 5 is 17.7 TWh. Yunnan only needs power from Lancang-Mekong countries in August and November and can supply power to Lancang-Mekong countries in the rest of the months. The maximum amount of power available is 3.1 TWh in July. The delivery curves in Yunnan are shown in Figure 14.
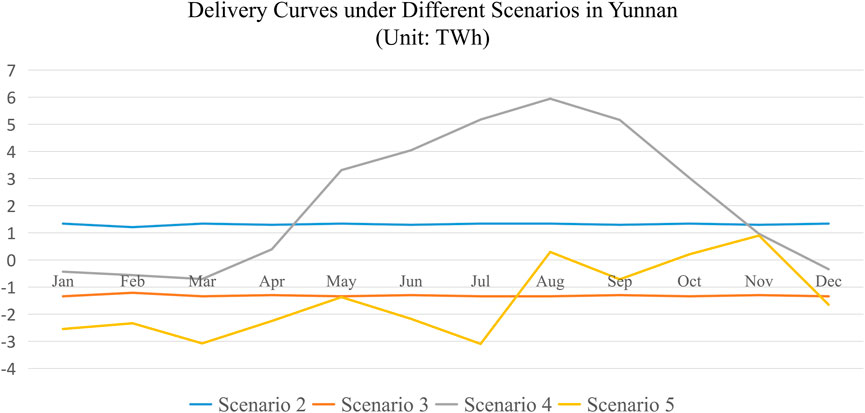
FIGURE 14. Delivery curves under different scenarios in Yunnan.
Scenario 2 stands for power interconnection from Yunnan’s perspective, with Myanmar’s delivery units sending full power to Yunnan with a total of 8.8 TWh. Scenario 3 stands for power interconnection from Lancang-Mekong’s perspective, with Yunnan’s delivery units returning full power to Myanmar, with an opposite curve to Scenario 2. Scenario 4 sells 11.4 TWh of electric quantity, requiring monthly incoming power sales of more than 0.6 TWh, reaching a maximum of 1.4 TWh in March. Scenario 5 allows Myanmar to supply power to Yunnan from May to November, reaching a maximum of 1.5 TWh, and requires Yunnan to return power to Myanmar in other months. The delivery curves in Myanmar are shown in Figure 15.
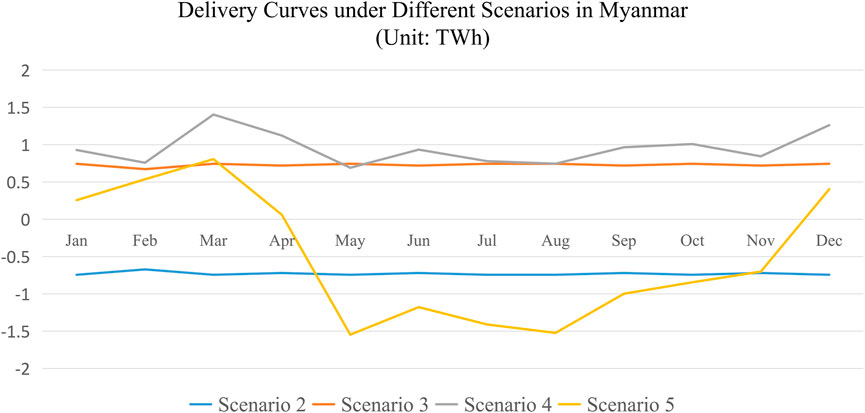
FIGURE 15. Delivery curves under different scenarios in Myanmar.
Scenario 2 stands for power interconnection from the Yunnan perspective, where the Lao’s delivery units send full power to Yunnan with a total delivery of 7.0 TWh. Scenario 3 stands for power interconnection from the Lancang-Mekong perspective, where the Yunnan’s delivery units return full power to Laos with an opposite curve to Scenario 2. Scenarios 4 and 5 have Laos returning power to Yunnan every month, reaching a maximum in the summer. The total amount of power delivered outside is 36.7 TWh for Scenario 4 and 43.4 TWh for Scenario 5, an increase of 18.2% over Scenario 4. Scenario 4 reached a maximum of 6.7 TWh in August, while Scenario 5 also reached a maximum of 7.2 TWh in August, an increase of 7.74% over Scenario 4.
The following Table 3 shows each country’s electricity interconnection and transaction amount under different scenarios. The transaction price is determined with reference to the average level of inter-provincial transmission prices in the China southern region. When conducting the near-term transmission line interconnection, Yunnan, Myanmar, and Laos can receive roughly 4.7 billion yuan, 2.6 billion yuan, and 2.1 billion yuan, respectively. This transaction is essential to support the development of the Lancang-Mekong countries and also increases the revenue of the China Southern Power Grid. Under medium and long-term regional integration, each country can sell out more electricity, with Laos sending out a more significant proportion of its electricity, generating up to 13 billion yuan in revenue. Yunnan also has a corresponding revenue of 5.3 billion yuan. It can be seen that building a regional unified power market and improving market conditions have a positive impact on promoting power interconnection among countries.
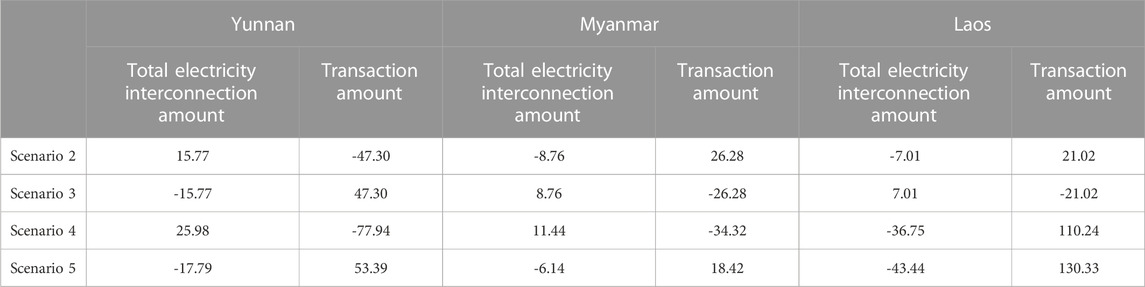
TABLE 3. Total electricity interconnection and transaction amount under different scenarios (Unit: TWh/Million yuan).
6 Conclusion
This paper proposes a mechanism to evaluate the power balance and complementary potential of the regional power grids of the Lancang-Mekong countries and Southern China under long-period operation simulation. The mechanism takes into account the energy supply structure, energy use form, cross-border transmission capacity, and multi-area complementary potential of the power grids of the Lancang-Mekong countries and Southern China. It also assesses the multi-stage power balance and complementary potential of the power grids of the Lancang-Mekong countries and Southern China by setting different boundary conditions. The following conclusions are drawn from the case study.
1) Conducting power trading between the southern region of China and the Lancang-Mekong countries can reduce fossil energy generation and increase the rate of clean energy consumption, which is green and environmentally friendly. From Yunnan’s perspective for power trading, Yunnan’s thermal power utilization hours are reduced by 25.9%, and thermal power generation per month is lower than the benchmark scenario.
2) Electricity interconnection can alleviate the power surplus shortage and ensure the power supply’s reliability and stability. The power trading scenarios have a higher overall surplus than the benchmark scenario. Myanmar has a negative surplus in the absence of trading, and the minimum monthly surplus shortfall is substantially improved after trading.
3) Long-term power interconnection has excellent economic benefits. Under medium and long-term regional integration, countries can send out more electricity, of which Laos sends out a larger proportion of electricity, with up to 13 billion yuan in revenue. Yunnan also has a corresponding revenue of 5.3 billion yuan. It can be seen that building a regional unified power market and improving market conditions have a positive impact on promoting power interconnection among countries.
Data availability statement
The original contributions presented in the study are included in the article/supplementary material, further inquiries can be directed to the corresponding author.
Author contributions
ZH, LH, and LE contributed to conception and design of the study. HY wrote sections of the manuscript. TC organized the database. ZW performed the statistical analysis. XG wrote the first draft of the manuscript. All authors contributed to manuscript revision, read, and approved the submitted version.
Funding
This work was supported by the Science and Technology Project of Yunnan Power Grid Co., Ltd (056200KK52210013). National Natural Science Foundation of China under Grant 52007029.
Conflict of interest
Authors ZH, LH, LE, and XG were employed by the Company Yunnan Power Grid Co., Ltd.
The remaining authors declare that the research was conducted in the absence of any commercial or financial relationships that could be construed as a potential conflict of interest.
The authors declare that this study received funding from Science and Technology Project of Yunnan Power Grid Co., Ltd. The funder had the following involvement in the study: offered the raw data of this work and made the decision to submit this paper for publication.
Publisher’s note
All claims expressed in this article are solely those of the authors and do not necessarily represent those of their affiliated organizations, or those of the publisher, the editors and the reviewers. Any product that may be evaluated in this article, or claim that may be made by its manufacturer, is not guaranteed or endorsed by the publisher.
References
Amundsen, E. S., and Bergman, L. (2006). Why has the Nordic Electricity Market worked so well? Util. Policy 14 (3), 148–157. Available at:. doi:10.1016/j.jup.2006.01.001
Bushnell, J., Mansur, E., and Saravia, C. (2007). Vertical arrangements, market structure, and competition an analysis of restructured U.S. Electricity Markets. Am. Econ. Rev. 98 (1), 237–266. doi:10.3386/w13507
Hu, S., Xiang, Y., Liu, J., Li, J., and Liu, C. (2021). A two-stage dispatching method for wind-hydropower-pumped storage integrated power systems. Front. Energy Res. 9, 65. doi:10.3389/fenrg.2021.646975
Ji, C., Chao, Y., Zhang, C., and Ma, H. (2021). A short-term power balance model for electricity considering the cost of abandoned water capacity[J]. J. Hydropower Generation 40 (03), 50–63. doi:10.11660/slfdxb.20210305
Le, H. L., Ilea, V., and Bovo, C. (2019). Integrated European intra-day electricity market: Rules, modeling and analysis. Appl. Energy 238, 258–273. Available at:. doi:10.1016/j.apenergy.2018.12.073
Li, M. J., Chen, G. P., Dong, C., Liang, C. F., Wang, W. S., and Fan, G. F. (2019). Research on the power balance problem of new energy power system [J]. Power Grid Technol. 43 (11), 3979–3986. doi:10.13335/j.1000-3673.pst.2019.0440
Ngan, H. W. (2010). Electricity regulation and electricity market reforms in China. Energy Policy 38 (5), 2142–2148. Available at:. doi:10.1016/j.enpol.2009.06.044
She, H., Han, X., Lu, D., and Du, B. (2021). Electricity "interconnection" to build "one belt and one road" [J]. Guangxi Electr. Ind. (09), 20–21.
Wang, X., Peng, P., and Chen, N. (2021). “Review and reflection on new energy participating in electricity spot market mechanism,” in Proceedins of the IEEE Sustainable Power and Energy Conference (iSPEC), Perth Austrlia, 4-7th December-2022, 757–762. doi:10.1109/iSPEC53008.2021.9735730
Wu, H., Syed, M., Ali, S., Ahsan, N., Ali, A., Shahid, I., et al. (2020). The impact of energy cooperation and the role of the one belt and road initiative in revolutionizing the geopolitics of energy among regional economic powers: An analysis of infrastructure development and project management. Complexity 2020, 1–16. doi:10.1155/2020/8820021
Xiao, Y., Li, C. Y., Zhao, T. Y., and Liu, W. X. (2016). Credible capacity assessment of wind turbines considering grid constraints in Western water-rich areas[J]. Power Constr. 37 (06), 134–141.
Xing, W. (2017). Lancang-mekong river cooperation and trans-boundary water governance: A Chinese perspective. China Q. Int. Strategic Stud. 03 (03), 377–393. Available at:. doi:10.1142/s2377740017500233
Xu, J., Liu, A., Qin, Y., Xu, G., and Tang, Y. (2022). Research on power system joint optimal generation scheduling based on improved balance optimizer. Front. Energy Res. 10. doi:10.95838410.3389/fenrg.2022.958384
Zeng, X. T., Liu, T. Q., Li, X., He, C., Han, X., and Qin, H. T. (2017). Research on mixed integer quadratic programming model and algorithm for power balance of high hydropower specific gravity system [J]. Chin. J. Electr. Eng. 37 (04), 1114–1125. doi:10.13334/j.0258-8013.pcsee.152439
Zhang, Y. (2019). Study on the impact of power futures on the dynamics of renewable energy returns and risks in China[D]. Beijing: China University of Petroleum. doi:10.27643/d.cnki.gsybu.2019.000578
Zhao, D. (2020). Annual power balance of hybrid power sources considering renewable energy consumption mechanism [D]. China: Chongqing University. doi:10.27670/d.cnki.gcqdu.2020.003580
Keywords: power trade potential, long-term operation simulation, power balance analysis, regional power system operation, joint optimization
Citation: Hao Z, Hai L, Enbo L, Yanting H, Zhi W, Chong T, Wenmeng Z and Guo X (2023) Research on power trade potential and power balance between Lancang-Mekong countries and southern China under long-term operation simulation. Front. Energy Res. 11:1109254. doi: 10.3389/fenrg.2023.1109254
Received: 27 November 2022; Accepted: 05 January 2023;
Published: 13 January 2023.
Edited by:
Yingjun Wu, Hohai University, ChinaReviewed by:
Can Huang, Lawrence Livermore National Laboratory (DOE), United StatesHaixiang Zang, Hohai University, China
Shuzheng Wang, Nanjing Institute of Technology (NJIT), China
Copyright © 2023 Hao, Hai, Enbo, Yanting, Zhi, Chong, Wenmeng and Guo. This is an open-access article distributed under the terms of the Creative Commons Attribution License (CC BY). The use, distribution or reproduction in other forums is permitted, provided the original author(s) and the copyright owner(s) are credited and that the original publication in this journal is cited, in accordance with accepted academic practice. No use, distribution or reproduction is permitted which does not comply with these terms.
*Correspondence: Tang Chong, dGNfdGp1MTg5NUAxNjMuY29t