 Sumin Li1,2*†
 Meng Wu
95% of researchers rate our articles as excellent or good
Learn more about the work of our research integrity team to safeguard the quality of each article we publish.
Find out more
ORIGINAL RESEARCH article
Front. Energy Res. , 16 May 2023
Sec. Sustainable Energy Systems
Volume 11 - 2023 | https://doi.org/10.3389/fenrg.2023.1109045
This article is part of the Research Topic Energy saving for sustainable cities View all 9 articles
This study uses the super-efficiency DEA model and Malmquist index analysis to evaluate the green energy efficiency of 58 countries along “the Belt and Road” Initiative zone from 2012 to 2021 and uses Tobit regression to analyze the external environmental influences on their green energy efficiency. The results of the study show that in the static analysis, The overall green energy efficiency of 58 countries along the “the Belt and Road” initiative area is low, and there are obvious regional differences; In terms of dynamic analysis, the Malmquist Index shows a slight fluctuation trend from 2012 to 2021. Tobit regression models show that external factors such as economic strength, energy consumption structure, industrial structure, and R&D expenditure are significantly and positively related to green energy efficiency. Based on this, this study proposed that countries should make good use of their resource advantages to improve the overall green energy efficiency of “the Belt and Road” Initiative zone according to local characteristics; strengthen inter-regional cooperation and exchange among countries, and implement outbound strategies to create a favorable development environment for green energy efficiency in “the Belt and Road” Initiative zone. Create a favorable development environment for green energy efficiency in “the Belt and Road” Initiative region.
“The Belt and Road” is the acronym for the cooperation Initiative proposed by China for the “New Silk Road Economic Belt” and the “21st Century Maritime Silk Road”. “The Belt and Road” Initiative follows the long history of China’s ancient Silk Road and holds high the great banner of peace, development, and win-win cooperation, promoting the economic development of China and other countries along the route. In an era of energy scarcity, energy cooperation is an important foundation and support for “the Belt and Road” Initiative. “The Belt and Road” brings together the two major energy-consuming markets of Europe and Asia and the major energy-exporting countries of the Middle East, Central Asia, and Russia. It covers two major regions rich in high-quality chemical energy: the Russian-Central Asian region and the Gulf region, as well as Western Europe, where energy technology is advanced and green energy is widely used. “The Belt and Road” project is conducive to promoting the stability of the energy market in Eurasia and the green transformation of energy in countries along the route.
To address global climate change and improve global green total factor productivity, China has deepened its cooperation with countries along “the Belt and Road” in recent years. For example, in May 2017, China released the “Vision and Actions for Promoting Energy Cooperation along “the Belt and Road” to pursue common and sustainable energy security; in October 2018, China and 17 countries jointly issued the Joint Ministerial Declaration on the Establishment of “the Belt and Road” Energy Partnership; on 25 April 2019, “the Belt and Road” Energy Partnership was established in Beijing, etc.
In the context of global energy saving and emission reduction, how to achieve synergistic development of the economy and environment is a real issue that countries need to face together. The improvement of energy efficiency can balance the objectives of economic growth, energy conservation, emission reduction, and environmental protection. In this context, analyzing and comparing the characteristics of green total factor energy efficiency in countries along “the Belt and Road” is a necessary way to transform from “high-carbon” to green development in countries along “the Belt and Road” under ecological constraints, and is also an urgent need to build a green “the Belt and Road” together.
The study of Green Total Factor Productivity (GTFP) originated in the mid to late 20th century. Literature (Chung et al., 1997) first studied the role of pollution emissions on economic growth, and GTFP has been in existence since then. Subsequently, many scholars gradually adopted total factor productivity as a comprehensive measure of the quality of economic development. Since the reform and opening up, china has developed its economy by relying on the crude economic growth method of high input. Low contribution of technological progress or total factor productivity to economic growth in China (Li and Lin, 2017). Subsequently, many scholars have gradually adopted total factor productivity as a comprehensive performance measure of the quality of economic development.
Some scholars have included environmental and energy factors as input-output variables in the measurement of total factor productivity. Literature (Managi et al., 2005) analyzed the mechanism of the dual role of environmental regulation on green total factor productivity and measured green total factor productivity in 30 Chinese provinces from 2003 to 2014 using the EBM-DDF model, and the empirical evidence showed that environmental regulation did not directly affect green total factor productivity. Literature (Zongbao et al., 2019) uses the DEA analysis method to study the energy efficiency situation in China, and the results show that the energy efficiency of South China, Northeast China, and Northwest China is generally good, with low energy efficiency risks. They considered that industrial structure upgrading, energy efficiency, and their interaction have positive effects on green total factor productivity (Li and Liao, 2020). Literature (Shi and Li, 2019) measured the green total factor productivity (TFP) of China’s manufacturing sector, and the results showed that the growth rate of green TFP in China’s manufacturing sector was not high, with significant regional differences.
Some scholars have conducted effective analysis on energy efficiency, Literature (Armel et al., 2013) used the DEA-PCA analysis method to examine the energy efficiency of the manufacturing industry, and found that energy intensive manufacturing industries such as steel, pulp and paper, oil refining, and cement plants improve their total energy output and efficiency by changing the proportion of energy input and output. Literature (Banker et al., 1984) Mainly based on the energy efficiency analysis method, the mathematical planning method is used to obtain the post evaluation of the relative efficiency of management achievements. Experts use the CCR ratio form introduced as part of their Data envelopment analysis method to understand the low efficiency of technology and scale through the optimal value of the ratio form, which is directly obtained from data, And there is no need to specify weights a priori and explicitly depict the assumed functional form of the relationship between input and output. Literature (Wang et al., 1984) used the DEA analysis method to calculate China’s energy efficiency and analyzed the discrete sources of low energy efficiency in China. The results showed that China’s energy efficiency was not high overall, and regional differences were significant. The eastern region had higher energy efficiency, while the central and western regions had lower efficiency. Though overall energy efficiency in China is not high by relative standards and significant regional difference exists, potential energy-saving strategies have been discovered in recent years.
Some scholars study the impact of other external factors on green total factor productivity. Literature (Hamamoto, 2006) argued that government regulation of the environment should stimulate the innovation compensation effect of firms, allowing them to improve resource allocation, production processes and technological innovation under changing constraints, thus achieving a Pareto improvement or a “win-win” situation, resulting in a joint increase in the environmental performance of firms and total factor productivity (Telle and Larsson, 2007). Literature (Zhu and Ye, 2018) examined the impact of OFDI on green total factor productivity using a threshold regression method. The study found that the impact of OFDI on green total factor productivity showed a positive law of increasing marginal efficiency. Using a spatial econometric model, literature (Li et al., 2020) explored the different mechanisms of the role of environmental regulation on technological innovation and green total factor productivity under a fiscal decentralization perspective. Literature (Lanoie et al., 2008) incorporated the lagged term of environmental regulation into an empirical model and found that the lagged variable of environmental regulation had a positive effect on productivity. Literature (Bian and Yang, 2010) establishes a comprehensive efficiency measure for evaluating DMU resource and environmental efficiency. In the proposed method, measures were provided to evaluate the importance of the model, and the goal setting of DMU managers changing inputs or outputs to improve DMU's energy and environmental efficiency was discussed. Based on this, the conclusion was drawn that there are significant regional differences in environmental efficiency in China (Liu and Wang, 2013). Literature (Huang et al., 2012) used a three-stage DEA model to analyze the energy efficiency of 29 provinces in China in 2009, established an energy efficiency evaluation index system, and compared the differences in energy efficiency among different regions. The research results showed that before eliminating external factors and environmental variables, scale efficiency was overestimated, while pure technical efficiency was underestimated. Therefore, each province should focus on adjusting the energy use structure to improve energy efficiency, Instead of blindly increasing investment scale.
Most studies on green TFP in the literature have focused on developed countries and at the provincial level in China, but there is a lack of research on developing and emerging economies, especially on countries along “the Belt and Road”.
Based on this, this study uses DEA analysis to measure the green energy efficiency of the countries along “the Belt and Road” and divides “the Belt and Road” countries into different regions to examine the regional differences in the green energy efficiency of the countries along “the Belt and Road”. There are three main contributions and possible innovations in this study. Firstly, DEA is used to measure the level of green energy efficiency growth in the countries along “the Belt and Road” Initiative, and Tobit regression analysis is used to measure other external factors affecting green energy efficiency in “the Belt and Road” Initiative region; secondly, the countries along “the Belt and Road” Initiative are divided into regions and the impact of different variables on green total factor productivity growth in “the Belt and Road” Initiative countries is examined separately to make the results of the analysis more thorough and clear; thirdly, Malmquist analysis is applied to dynamically analyze green total factor productivity in “the Belt and Road” Initiative to make the results cross-sectional and comparable.
The traditional DEA model was first proposed by American operations research scientists A. Charnes and W.W. Cooper. It is a method for evaluating the relative effectiveness of decision units. The two main types of traditional DEA analysis commonly are the CCR model and the BCC model. Andersen and Petersen propose a super-efficient DEA model based on the traditional CCR model, whose main objective is to overcome the inability of the traditional DEA model to further rank fully valid decision units, whereas super-efficiency allows for the comparison and ranking of all decision units. It is assumed that each decision unit
The Super Efficiency DEA model is shown in Figure 1. According to the traditional DEA model, A, B and C are all located on the production efficiency frontier and are DEA-effective units. However, super-efficiency calculates the efficiency value of a decision unit by excluding that decision unit from the original set of production possibilities and then constructing a new set of production possibilities to solve for the super-efficiency value. Take point B as an example, point B has an efficiency value of 1 in the traditional DEA model, but in the process of solving for super-efficiency, point B will be excluded from the production possibility set. The new production possibility set constructs the production efficiency frontier surface with AC as the envelope, and the extension line of AC and OB intersects at point B′, so the super-efficiency value of point B is OB′/OB > 1. It follows that the efficiency value of the effective decision unit in the super-efficient DEA model can be greater than 1, but the efficiency value of the non-effective decision unit remains unchanged.
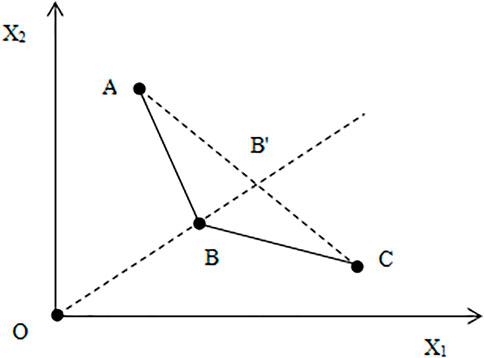
FIGURE 1. Super-efficient DEA model based on constant returns to scale.
In the early 1850s, Swedish economist Sten. Malmquist proposed the Total Factor Productivity Index evaluation model, which was first used by Caves in 1982 to measure production efficiency. Subsequently Fare et al. constructed a dynamic Malmquist index model, Total Factor Productivity Change, based on the static DEA model. Malmquist index analysis allows the analysis of the efficiency values of different decision units by measuring the Malmquist index
Where
Where Effch denotes the index of change in technical efficiency and Techch is the index of change in technical progress, Effch can be further decomposed into the product of pure technical efficiency and payoffs to scale. If the Malmquist index Tfpch > 1, it means that the total factor productivity of the decision unit is increasing in the period t to (t + 1) and vice versa. In addition, the rate of change of pure technical efficiency, the rate of change of scale, the rate of change of technical efficiency, and the rate of change of technical progress show the same characteristics of change as the rate of change of the Malmquist index.
Green energy efficiency values are not only influenced by endogenous variables, but also by the external environment. To investigate the impact of exogenous variables on green energy efficiency, this study uses the super-efficiency value of the decision unit as the dependent variable in the estimation of the equation, and the external environmental factors that may affect green energy efficiency in “the Belt and Road” Initiative area as the independent variables in the construction of the regression model. Considering that the DEA efficiency value is > 0, the ordinary least squares method may produce biased estimates. The Tobit regression model was used to test the exogenous variables, and the basic Tobit model is as follows.
where
The key to the measurement of input-output efficiency in the DEA model lies in the selection of indicators for the decision unit. Input indicators mainly consider the two major factors of production, namely labor and capital. According to the availability and representativeness of data, 58 countries along “the Belt and Road” are taken as decision units in this study, and different countries are divided into six regions, namely Southeast Asia, West Asia, South Asia, Central Asia, CIS, and Central and Eastern Europe, according to their geographical characteristics.
In this study, labor, capital, and energy consumption are selected as input factors, drawing on existing research. Labor input is expressed in terms of the total number of labor forces in each country. Capital input is measured by the capital stock of each country, using the perpetual inventory method, and is calculated as
To ensure consistency, the data for the above input-output indicators were obtained from the World Bank database, and some missing values were calculated using the averaging and forecasting methods. The descriptive statistics of each measured indicator were shown in Table 1.
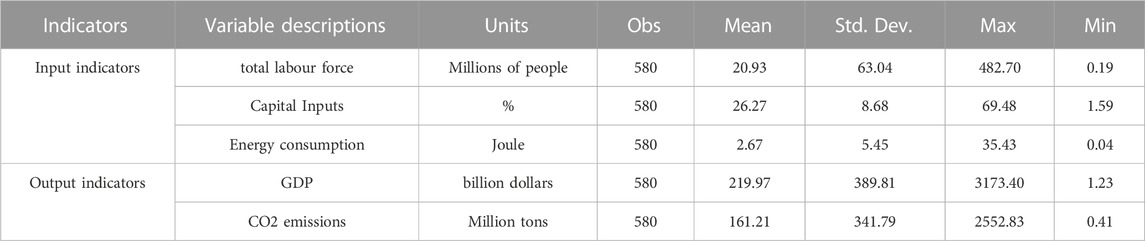
TABLE 1. Green energy efficiency indicator system for “the Belt and Road” Initiative region.
This paper will substitute the input-output index data of 58 countries along the “the Belt and Road” from 2012 to 2021 into the DEA-Solver5.0 software. Considering that there are unexpected outputs in the output variables, this paper uses the Super-SBM model to calculate and analyze the green energy efficiency of 58 countries along the “the Belt and Road”. The results are shown in Table 2.
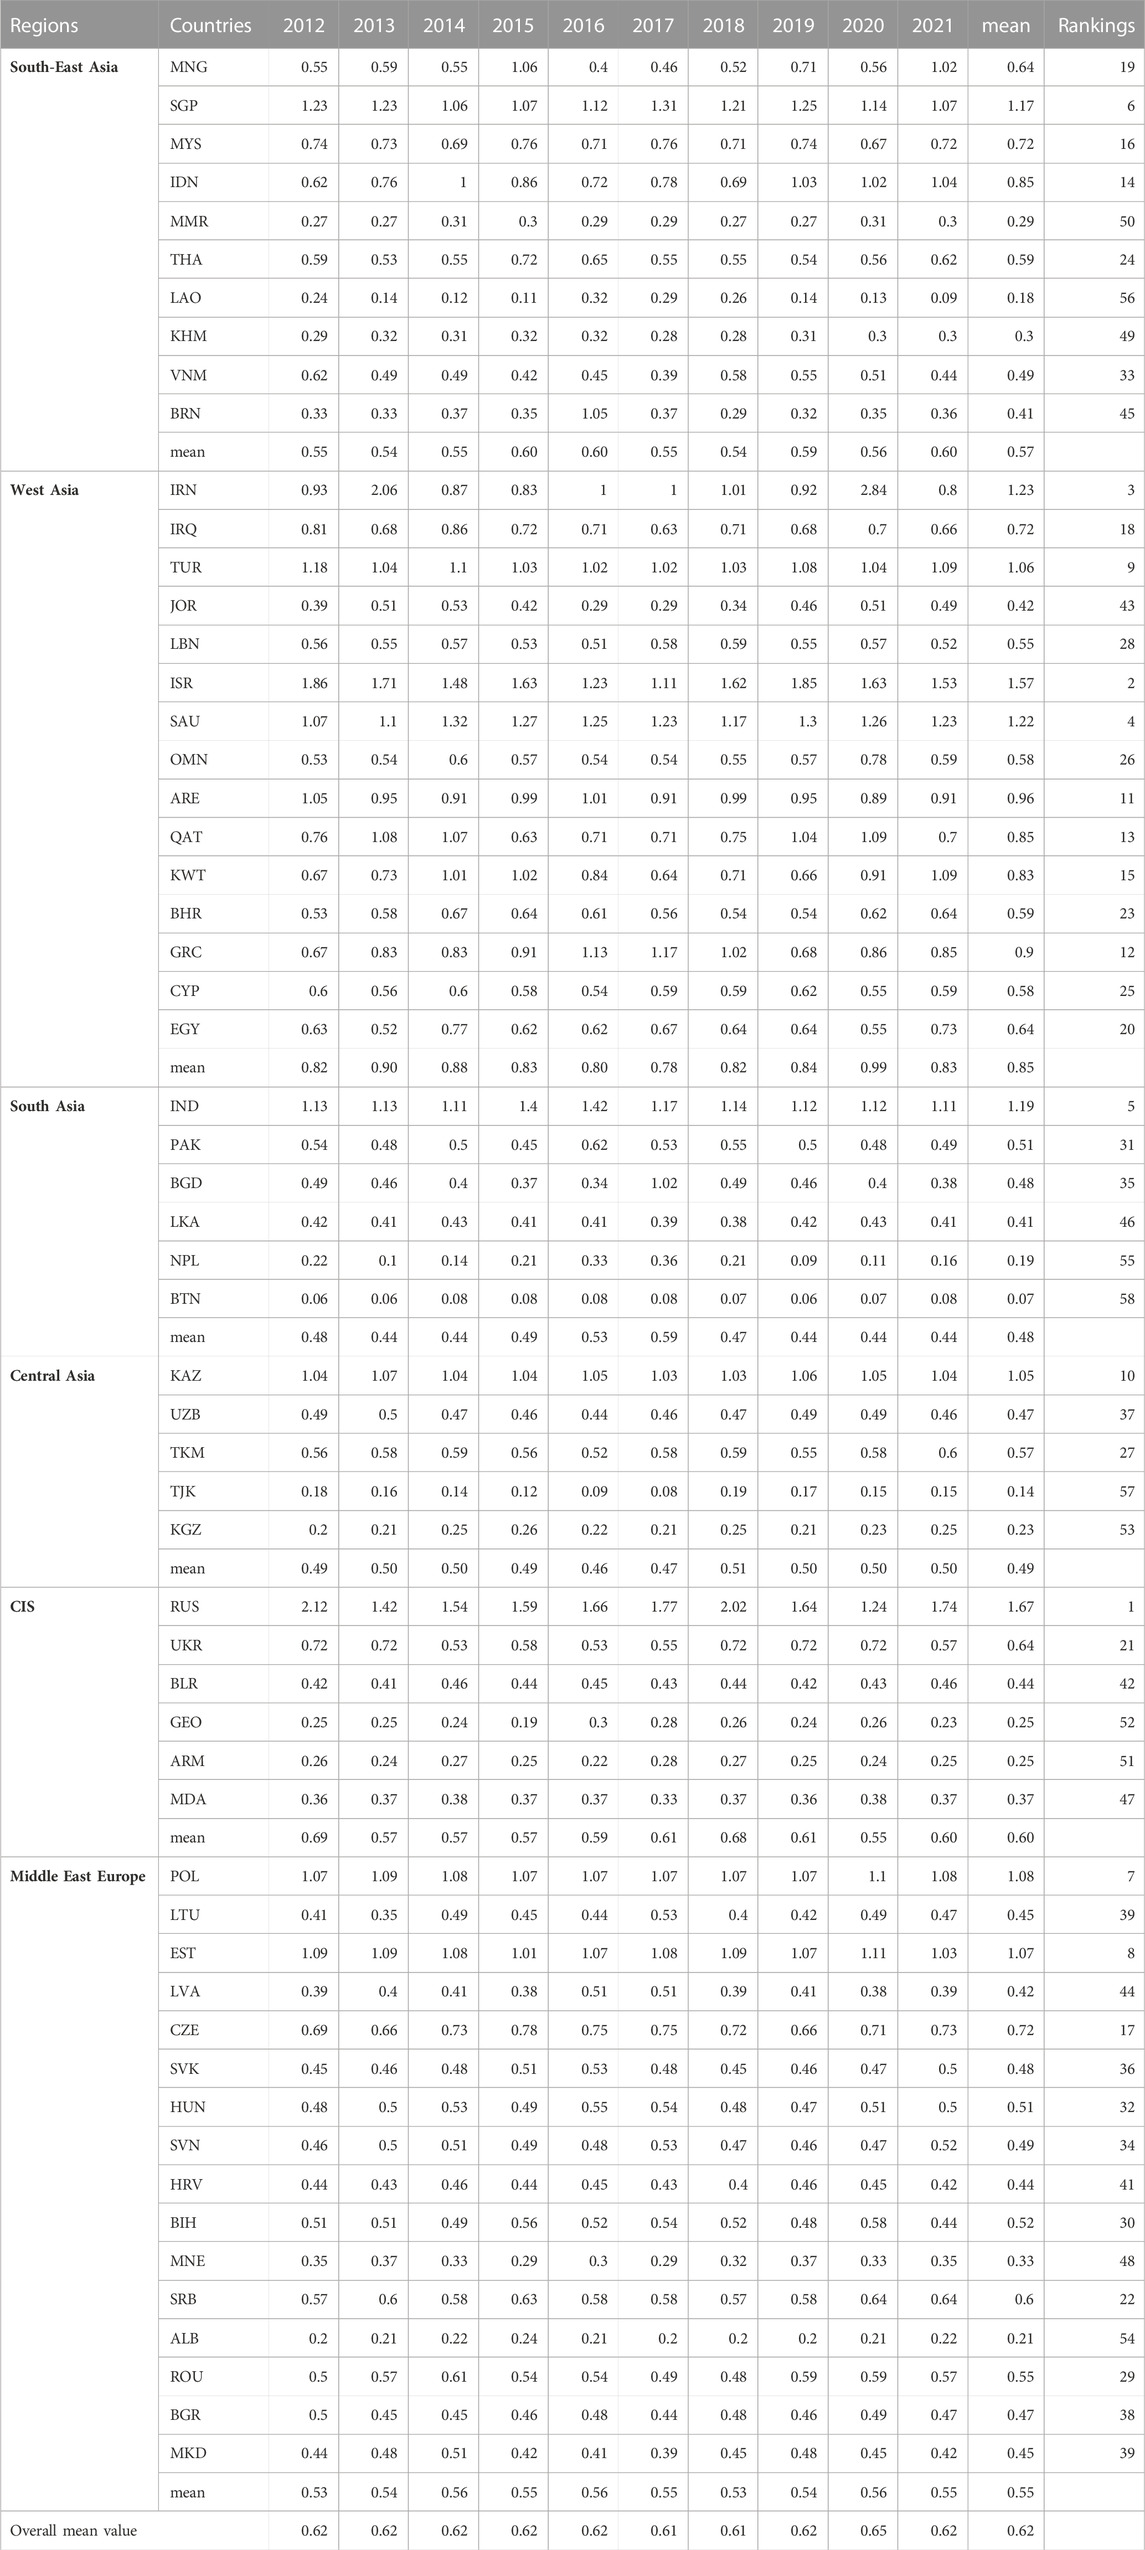
TABLE 2. Green energy efficiency super-efficiency values for 58 countries along “the Belt and Road” Initiative area from 2012 to 2021.
It can be seen from the evaluation results in Table 2 that, on the whole, the average value of the overall green energy efficiency of the countries along the “the Belt and Road” initiative area in recent years has little difference, the overall average value is about 0.62, which does not reach the DEA completely effective, and the difference between different countries is large, showing a trend of volatility. Specifically, from 2012 to 2021, the green energy efficiency values of the countries along the “the Belt and Road” initiative area ranged from 0.07 to 1.67. The green energy efficiency values of different countries differed greatly. Bhutan had the lowest green energy efficiency, with an average efficiency of 0.07. Russia had the highest green energy efficiency, with an average efficiency of 1.67. From 2012 to 2021, the average green energy efficiency of countries in the "the Belt and Road" initiative area reached DEA fully effective (the efficiency value was greater than 1) in 10 countries, and the green energy efficiency of the remaining 48 countries along the line was not fully effective. The average energy input-output efficiency of countries from 2012 to 2021 is less than 1, which means that the green energy efficiency of countries along the “the Belt and Road” initiative area from 2012 to 2021 has not been fully effective as a whole, and the green energy efficiency of the initiative area needs to be further improved.
The “the Belt and Road” starts from China and extends westward to Western Europe, including Southeast Asia, West Asia, South Asia, Central Asia, CIS and Central and Eastern Europe. From the perspective of the six regions along the “the Belt and Road”, countries with high green energy efficiency are mostly concentrated in countries and regions with sufficient energy resources.
The main performance is as follows: overall, the average green energy efficiency of Southeast Asia, West Asia, South Asia, Central Asia, the Commonwealth of Independent States and Central and Eastern Europe in the “the Belt and Road“ initiative area from 2012 to 2021 is 0.57, 0.85, 0.48, 0.6 and 0.55 respectively; Among them, West Asia has the highest green energy efficiency at 0.85, while Southeast Asia and Central and Eastern Europe have lower efficiency values at 0.57 and 0.55, respectively. The majority of countries with relatively effective DEA are concentrated in the West Asian region, with four fully effective DEA countries accounting for 26.67% of the region. There are not many countries in other regions where DEA is fully effective.
This study applied DEAP2. 1 software to measure the green energy efficiency of the countries in “the Belt and Road” Initiative Zone from 2012 to 2021 based on static analysis of the super efficiency of “the Belt and Road”, and the evaluation results were shown in Table 3.
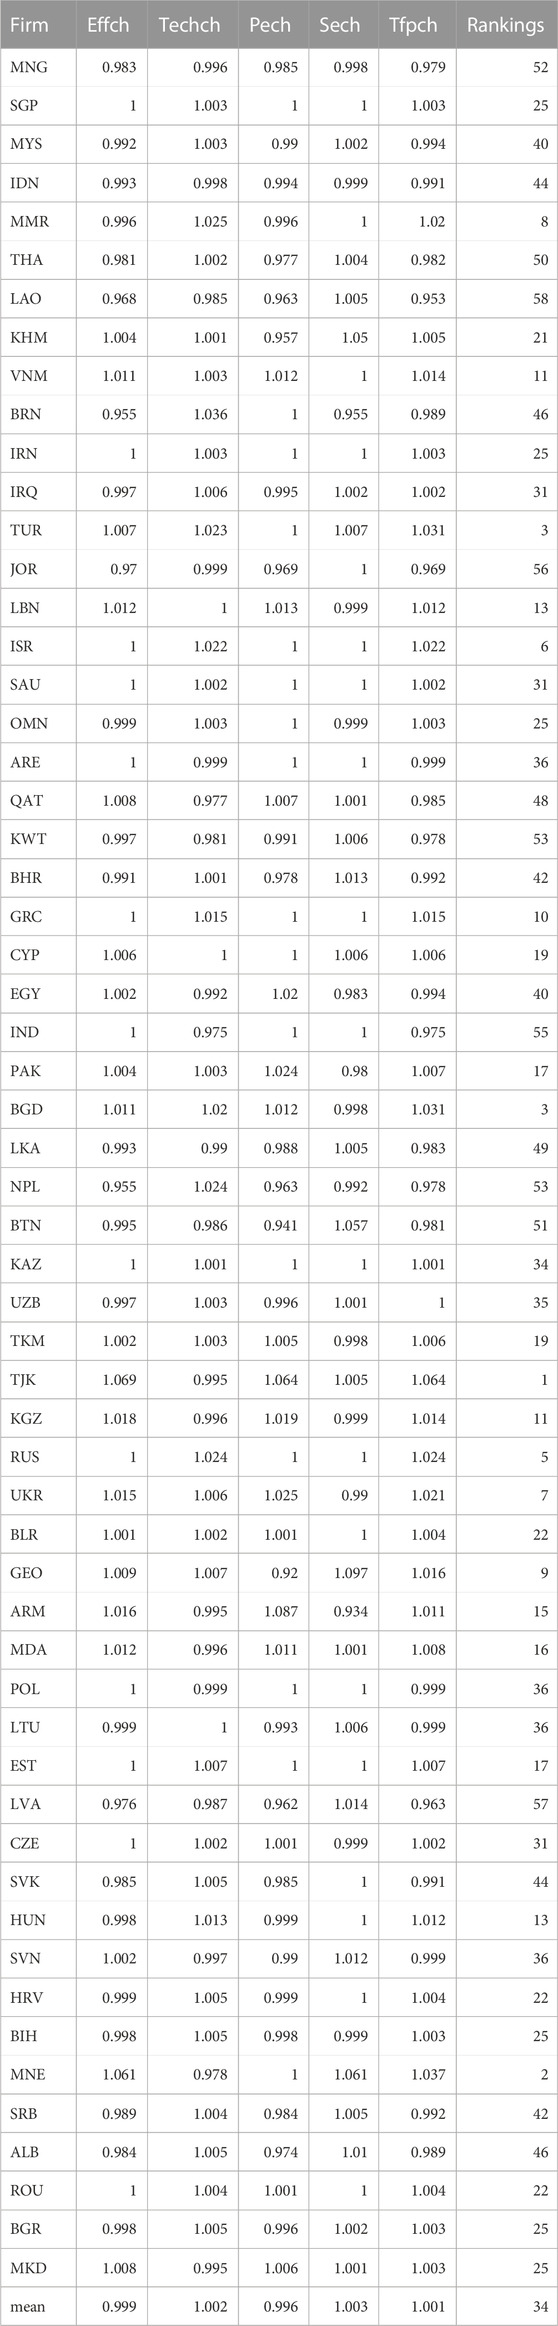
TABLE 3. Green energy efficiency index and decomposition for 58 countries in “the Belt and Road” Initiative region from 2012 to 2021.
Table 3 shows the green energy efficiency index and decomposition of 58 countries in the “the Belt and Road” initiative area from 2012 to 2021. Among them, effch represents technological efficiency, techch represents technological progress, pech represents pure technological efficiency, sech represents scale efficiency, and tfpch represents total factor productivity. Countries with higher technological efficiency include TJK, MNE KGZ, countries with higher technological progress efficiency include BRN, MMR, and NPL, countries with higher scale efficiency include GEO, MNE, and BTN, and countries with higher total factor productivity include TJK, MNE, and TUR. Through comparison, it is not difficult to find that there is a similar trend in the change rate of green energy efficiency and technological progress, indicating that technological progress has a significant impact on green total factor productivity.
Among the 58 countries in the “the Belt and Road” initiative area, 35 countries have achieved fully effective total factor productivity of energy, accounting for 60.34% of the sample countries in the “the Belt and Road” initiative area. And total factor productivity is composed of efficiency changes and technological progress, that is, tfpch = effch × techch. Taking Singapore (SGP) as an example, the technical efficiency (effch) of Singapore (SGP) did not change during the measurement period (with an average of 1), but its total factor productivity (tfpch) increased by 0.3%, indicating that effective technological progress (techch) has driven the growth of Singapore’s total factor productivity. During the calculation period, the technological efficiency (effch) of The Sultanate of Oman country (OMN) decreased by 0.1%, but its total factor productivity increased by 0.3%. This indicates that the improvement of technological progress has led to an increase in the country’s total factor productivity, which is composed of pure technological efficiency and scale efficiency, That is to say, existence: effch = pech × sech, therefore, the level of scale efficiency and pure technical efficiency will also have an impact on total factor productivity.
It can be seen from Table 4 that from 2012 to 2021, the average green energy efficiency of the countries in the “the Belt and Road” initiative area was 1.00, which increased by 0.2 percentage points compared with 2012. It can be seen from Malmquist index decomposition that the improvement of total factor productivity of green energy mainly comes from the improvement of technology progress (Techch). The average technological progress from 2012 to 2013 was 0.995, and the average technological progress from 2020 to 2021 was 1.035. This indicates that the green energy efficiency of countries in the "the Belt and Road" initiative area is mainly affected by technological progress. The technological progress of countries in the “the Belt and Road” initiative area has an upward trend in green energy efficiency from 2012 to 2021, The technical efficiency has not changed much, and the pure technical efficiency (pech) and scale efficiency (sech) have not reached full efficiency in some years. Therefore, the energy input scale and structure of countries along the “the Belt and Road” initiative area still need to be improved. It is hoped that the scale and structure of energy input will be improved in the future to maximize the total factor productivity of energy input and output in the "the Belt and Road" initiative area.
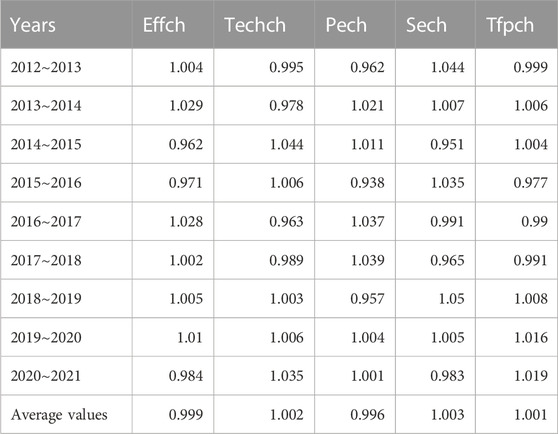
TABLE 4. Malmquist index of green energy efficiency and its decomposition in “the Belt and Road” Initiative zone countries from 2012 to 2021.
The super-efficient DEA model and Malmquist index analysis can only reflect the influence of endogenous variables on green energy efficiency, but cannot explore other exogenous variables. Based on this, this study considers the impact of the following five factors on green energy efficiency in “the Belt and Road” Initiative countries based on relevant studies.
(1) Economic strength, expressed by the GDP per capita of each country, the level of economic development has a very important impact on energy use efficiency, generally speaking, the more developed a country’s economy is, the higher its energy use efficiency is.
(2) Energy consumption structure, expressed by raw coal consumption, the transformation, and upgrading of energy consumption structure can improve energy use efficiency. Generally speaking, the greater the coal consumption, the more the energy consumption structure is skewed towards a traditional energy structure with high emissions, and the lower its energy use efficiency.
(3) The degree of regional openness expressed in terms of total import and export volume, indicates that import and export trade can promote the flow of energy factors, thereby improving energy utilization efficiency.
(4) The industrial structure, expressed as the share of industrial value added in GDP, and the share of the secondary sector in GDP affects energy consumption and thus green energy efficiency, so this study uses the share of industrial value added in GDP to represent the industrial structure.
(5) R&D expenditure, expressed as a proportion of each country’s GDP, is generally higher, indicating that a country places more emphasis on science and technology, and correspondingly more efficient use of energy.
Considering that the data of these variables in 2021 are not complete enough, this paper uses Eviews9.0 software and maximum likelihood estimation method to conduct Tobit regression on the external factors that affect the energy utilization efficiency of 58 countries along the “the Belt and Road“ initiative area from 2012 to 2021. The results are shown in Table 5.
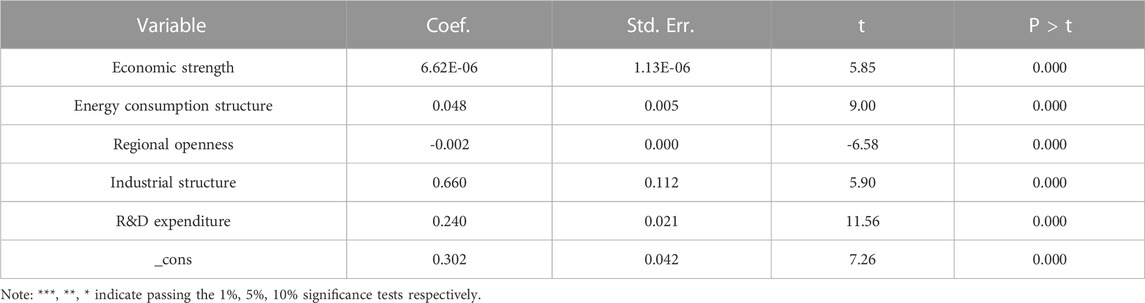
TABLE 5. External factors affecting energy use efficiency in 58 countries along “the Belt and Road” Initiative zone from 2010 to 2019.
In terms of significance level, economic strength, energy consumption structure, regional openness, industrial structure, and R&D expenditure passed the significance test, as analyzed below.
First, from the economic strength factor, the economic strength of each country is significantly and positively correlated with energy use efficiency, indicating that the more economically developed countries and regions within the Initiative area are, the more efficient their energy use is, which is in line with the actual situation. Because regional economic development can promote the upgrading of industrial structures and technological innovation, the stronger the regional economic strength, the more it can provide a strong platform to support the development of science and technology innovation.
Second, from the perspective of energy consumption structure, the quantity of coal consumption is positively correlated with energy utilization efficiency, indicating that the higher the proportion of coal consumption in energy consumption, the higher the energy utilization efficiency. This may be due to the fact that coal consumption in traditional industries belongs to high-energy consuming industries. The extraction and use of coal can cause air pollution, stimulate energy governance efficiency, and accelerate the development and use of clean energy, thereby further improving green energy efficiency.
Third, from the perspective of regional openness, there is a negative correlation between regional openness and energy utilization efficiency. This indicates that regions with higher levels of openness tend to have lower energy utilization efficiency. Generally speaking, higher levels of regional openness are more conducive to technological exchange and learning among different countries, resulting in higher energy efficiency. However, it is also possible that higher levels of regional openness lead to higher energy consumption, Various low-energy sources will also be used, thereby reducing the overall energy efficiency.
Fourth, in terms of industrial structure, industrial structure and energy use efficiency are positively correlated. The proportion of industrial value added to GDP reflects the contribution of production units to GDP, indicating that the higher the proportion of industrial value added to GDP, the higher the energy use efficiency
Fifth, from the perspective of R&D expenditure, there is a positive correlation between R&D expenditure and energy utilization efficiency, indicating that improving the regional research environment is conducive to improving energy efficiency. Technological research and development is a carrier of technological innovation, which can promote the transformation of scientific and technological achievements. The higher the proportion of research and development expenditure, the more conducive it is to the improvement of energy efficiency in various countries.
This study evaluated the green energy efficiency of 58 countries and regions along “the Belt and Road” Initiative Zone from 2012 to 2021 using the super-efficiency DEA model and Malmquist index analysis and explored the external environmental factors and the degree of influence of green energy efficiency in “the Belt and Road” Initiative Zone countries using the Tobit regression analysis.
First, the static super efficiency DEA results show that in recent years, the overall efficiency of green energy in the countries along the “the Belt and Road” initiative area has little difference, the overall average is about 0.62, which does not reach the full efficiency of DEA, and the difference between different countries is large, showing a trend of volatility. Further analysis shows that the green energy efficiency of countries in the “the Belt and Road” initiative area varies greatly in different regions, which is mainly reflected in the high green energy efficiency in Southeast Asia, West Asia and Central and Eastern Europe, the low green energy efficiency in South Asia, Central Asia and the Commonwealth of Independent States, and the countries with high green energy efficiency are mostly concentrated in countries and regions with sufficient energy resources. The green energy efficiency values vary greatly among different countries, with Bhutan having the lowest green energy efficiency and Russia having the highest green energy efficiency. Based on this, all countries in the “the Belt and Road” initiative area should choose production development strategies according to local conditions, combine their own energy factor advantages, deepen energy cooperation, achieve complementary advantages, form win-win development, and comprehensively improve the green all factor production efficiency of the initiative area.
Second, the results of the dynamic Malmquist Index analysis showed that the green total factor productivity of “the Belt and Road” Initiative countries has been hovering around 1.00 in recent years, there is no significant improvement trend. As total factor productivity is made up of technical efficiency and technological progress, to improve overall total factor productivity, we should start from both technical efficiency and technological progress. Technical efficiency includes both pure technical efficiency and scale efficiency. On the one hand, countries should continuously adjust their energy structure to meet the requirements of green, environmental protection, and sustainability according to the current energy situation and energy policies at home and abroad. On the other hand, countries should expand the scale of investment in energy efficiency, attach importance to the green energy industry, take the market as the guide, give full play to their advantages, guide the industry to gradually adapt to the market’s green, energy-saving and environmental protection needs, grasp the major development opportunities brought by “the Belt and Road” Initiative, enhance energy cooperation between different countries. It will also enhance energy cooperation between different countries and complement each other’s strengths to achieve intensive, efficient and green use of resources.
The third, Tobit regression analysis of the external factors of green energy efficiency in “the Belt and Road” Initiative 58 countries showed that economic strength, energy consumption, industrial structure, are significantly and positively related to green energy efficiency in the Initiative, while regional openness are negatively related to green energy efficiency in the Initiative. Based on this, if we want to improve green energy efficiency in “the Belt and Road” Initiative 58 countries, we should start from the following aspects: firstly, countries should strengthen their economic strength to provide a good economic environment for green total productivity; secondly, countries should actively promote the upgrading of industrial structure, increase the proportion of industrial value added to GDP and Secondly, countries should actively promote the upgrading of industrial structure, increase the proportion of industrial value added in GDP and enhance the added value of products. Thirdly, countries should seize the major development opportunity of “the Belt and Road” Initiative and proactively integrate into the global opening-up pattern; finally, governments should create a favorable research environment, actively promote R&D and innovation in the energy sector and advocate environmental protection.
In general, the overall green energy efficiency of the 58 countries in the “the Belt and Road” initiative area is not high and regional differences are obvious, but there are obvious regional differences, and there is no obvious upward trend in green energy efficiency in recent years. Countries should make good use of their resource advantages to improve the overall green energy efficiency of “the Belt and Road” Initiative region by local conditions. Countries should seize the major development opportunity of “the Belt and Road” Initiative, strengthen inter-regional cooperation and exchange, and implement outbound strategies. Not only should the internal input and output structure of energy be adjusted, but external environmental factors such as economic strength, industrial structure, regional openness, and R&D expenditure should also be taken into account to create a favorable development environment for green energy efficiency in “the Belt and Road” Initiative region.
The original contributions presented in the study are included in the article/supplementary material, further inquiries can be directed to the corresponding author.
All authors listed have made a substantial, direct, and intellectual contribution to the work and approved it for publication.
This work has been supported by the National Social Science Foundation of China (22BJY005) “Innovation and Policy Optimization of Digital Inclusive Finance Empowering Rural Revitalization”, South China Agricultural University (10564).
The authors declare that the research was conducted in the absence of any commercial or financial relationships that could be construed as a potential conflict of interest.
All claims expressed in this article are solely those of the authors and do not necessarily represent those of their affiliated organizations, or those of the publisher, the editors and the reviewers. Any product that may be evaluated in this article, or claim that may be made by its manufacturer, is not guaranteed or endorsed by the publisher.
The Supplementary Material for this article can be found online at: https://www.frontiersin.org/articles/10.3389/fenrg.2023.1109045/full#supplementary-material
Armel, K. C., Gupta, A., Shrimali, G., and Albert, A. (2013). Is disaggregation the holy grail of energy efficiency? The case of electricity. Energy Policy 52 (1), 213–234. doi:10.1016/j.enpol.2012.08.062
Azadeh, A., Amalnick, M. S., Ghaderi, S. F., et al. (2008). An integrated DEA PCA numerical taxonomy approach for energy efficiency assessment and consumption optimization in energy intensive manufacturing sectors. Energy Policy 35 (7), 3792-3806. doi:10.1016/j.enpol.2007.01.018
Banker, R. D., Charnes, A., and Cooper, W. W. (1984). Some models for estimating technical and scale inefficiencies in data envelopment Analysis. Manage. Sci. 30 (9), 1078–1092. doi:10.2307/2631725
Bian, Y., and Yang, F. (2010). Resource and environment efficiency analysis of provinces in China: A DEA approach based on Shannon’s entropy. Energy Policy 38 (4), 1909–1917. doi:10.1016/j.enpol.2009.11.071
B Q W A., A Z Z., B P Z.et al. (2013). Energy efficiency and production technology heterogeneity in China: A meta-frontier DEA approach. Economic Modelling, 35 (1), 283–289. doi:10.1016/j.econmod.2013.07.017
Chung, Y. H., Fare, R., and Grosskopf, S. (1997). Productivity and undesirable outputs: A directional distance function approach. J. Environ. Manag. 51 (3), 229–240. doi:10.1006/jema.1997.0146
Hamamoto, M. (2006). Environmental regulation and the productivity of Japanese manufacturing industries. Resour. Energy Econ. 28, 299–312. doi:10.1016/j.reseneeco.2005.11.001
Hegde, R., and Shanbhag, N. R. (2000). Toward achieving energy efficiency in presence of deep submicron noise. IEEE Transactions on Very Large Scale Integration Systems, 8 (4), 379–391. doi:10.1109/92.863617
Huang, D., Dong, Y., and Liu, B. (2012). Research on regional energy efficiency in China based on three-stage DEA model. Resources Ence. 34 (4), 97–104. doi:10.5814/j.issn.1674-764x.2014.02.001
Lanoie, P., Patry, M., and Lajeunesse, R. (2008). Environmental regulation and productivity: Testing the porter hypothesis. J. Prod. Analysis 30, 121–128. doi:10.1007/s11123-008-0108-4
Li, H., He, F., and Deng, G. (2020). How does environmental regulation promote technological innovation and green development? New evidence from China. Pol. J. Environ. Stud. 29, 689–702. doi:10.15244/pjoes/101619
Li, K., and Lin, B. (2017). Economic growth model, structural transformation, and green productivity in China. Appl. Energy 187, 489–500. doi:10.1016/j.apenergy.2016.11.075
Li, T., and Liao, G. (2020). The heterogeneous impact of financial development on green total factor productivity. Front. Energy Res. 8. doi:10.3389/fenrg.2020.00029
Liu, S. L., and Wang, Y. M. (2013). Risk analysis of regional energy efficiency in China based on DEA. Appl. Mech. Mater. 368–370, 245–248. doi:10.4028/www.scientific.net/AMM.368-370.245
Managi, S., Opaluch, J. J., Jin, D., and Grigalunas, T. A. (2005). Environmental regulations and technological change in the offshore oil and gas industry. Land Econ. 81, 303–319. doi:10.3368/le.81.2.303
Shi, X., and Li, L. (2019). Green total factor productivity and its decomposition of Chinese manufacturing based on the MML index:2003-2015. J. Clean. Prod. 222, 998–1008. doi:10.1016/j.jclepro.2019.03.080
Telle, K., and Larsson, J. (2007). Do environmental regulations hamper productivity growth? How accounting for improvements of plants' environmental performance can change the conclusion. Ecol. Econ. 61, 438–445. doi:10.1016/j.ecolecon.2006.03.015
Wang, Q., Zhao, Z., Zhou, P., and Zhou, D. (2013). Energy efficiency and production technology heterogeneity in China: A meta-frontier DEA approach. Econ. Model. 35 (1), 283–289. doi:10.1016/j.econmod.2013.07.017
Zhu, S., and Ye, A. (2018). Does the impact of China's outward foreign direct investment on reverse green technology process differ across countries? Sustainability 10, 3841. doi:10.3390/su10113841
Keywords: the Belt and Road, DEA, green total factor productivity, green energy efficiency, green development
Citation: Li S, Wu M and Song M (2023) Analysis of regional differences in green energy efficiency in countries along “the Belt and Road” Initiative zone—Based on super efficiency DEA model and Malmquist index method. Front. Energy Res. 11:1109045. doi: 10.3389/fenrg.2023.1109045
Received: 27 November 2022; Accepted: 22 February 2023;
Published: 16 May 2023.
Edited by:
Alberto-Jesus Perea-Moreno, University of Cordoba, SpainReviewed by:
Zia Ur Rahman, Zhejiang Normal University, ChinaCopyright © 2023 Li, Wu and Song. This is an open-access article distributed under the terms of the Creative Commons Attribution License (CC BY). The use, distribution or reproduction in other forums is permitted, provided the original author(s) and the copyright owner(s) are credited and that the original publication in this journal is cited, in accordance with accepted academic practice. No use, distribution or reproduction is permitted which does not comply with these terms.
*Correspondence: Sumin Li, bGlzdW1pbjMyMUAxNjMuY29t
†These authors have contributed equally to this work
Disclaimer: All claims expressed in this article are solely those of the authors and do not necessarily represent those of their affiliated organizations, or those of the publisher, the editors and the reviewers. Any product that may be evaluated in this article or claim that may be made by its manufacturer is not guaranteed or endorsed by the publisher.
Research integrity at Frontiers
Learn more about the work of our research integrity team to safeguard the quality of each article we publish.