 Lili Wang1
 Wenwen Xiao
- 1School of Business, Shandong Jianzhu University, Jinan, China
- 2School of Management Engineering, Shandong Jianzhu University, Jinan, China
In recent years, environmental problems have become an important bottleneck restricting the sustainable development of Marine economy in China. CO2 is one of the main greenhouse gases which contributes to marine environmental problems. As CO2 emissions can transfer among industries, identifying the industries that release CO2 most and clarifying the carbon emission flows among marine industries are helpful for decision-makers to curb CO2 emissions of marine industries. This paper applies the network method to measure carbon emission flows. First, carbon transfer coefficient is calculated. Second, carbon transfer network of marine industry is constructed based on carbon transfer coefficient. Then the structure of marine industry carbon transfer network is analyzed. Finally, the method proposed in this paper is applied to the case of China and some suggestions for carbon reduction is put forward.
1 Introduction
As a major developing country with a coastline of 180 million kilometers, China attaches great importance to marine development and protection. Marine economy is a significant driving force for China’s economic development. In 2021, the GDP of China’s marine economy exceeded 9 trillion yuan, accounting for about 8% of the national GDP. However, environmental problems have become an important bottleneck restricting the sustainable development of marine economy. CO2 is one of the main greenhouse gases which contributes to marine environmental problems. As CO2 emissions can transfer among industries, identifying the industries that release CO2 most and clarifying the carbon emission flows among marine industries are helpful for decision-makers to curb CO2 emissions of marine industries.
Regarding the carbon emissions of the marine industry, from the current literature, some scholars have carried out research on some sub-sectors of the marine industry. Regarding the study of carbon emissions from marine fisheries, Parker et al. pointed out that the emissions of marine fisheries are often roughly summarized or directly excluded in the assessment of greenhouse gas emissions, so they quantified the fuel consumption and greenhouse gas emissions of global fishing vessels from 1990 to 2011, and found an increasing trend in total emissions (Parker et al., 2018); Greer et al. calculated the fuel consumption intensity, carbon dioxide emission intensity and emissions of global marine fisheries from 1950 to 2016, compared and discussed the differences with some of the previous research results of Parker et al., analyzed the changing trend, and pointed out that attention should be paid to the potentially important role of marine fisheries in carbon reduction strategies (Greer et al., 2019); Wang and Wang obtained carbon emission data by processing the oil consumption of marine capture fisheries in China, then used the decoupling index to evaluate the relationship between carbon emissions and economic output, used the decomposition analysis method to determine the factors that affect carbon emissions, and finally analyzed the decoupling effect of 11 coastal provinces and cities in China using the decoupling effect model (Wang and Wang, 2022). Regarding the carbon emissions of the maritime transport industry, Bagoulla and Guillotreau calculated the environmental multiplier of the French maritime industry by using the input-output analysis method, obtained the emissions of various greenhouse gases, and analyzed the impact of the greenhouse gas emissions from the French maritime transport industry on air pollution (Bagoulla and Guillotreau, 2020); Wang et al. found that only a few of the large number of transportation activities are economically feasible. Among these economically feasible activities, there are a considerable number of trans-Arctic shipping routes that help reduce fuel consumption and greenhouse gas emissions, with a certain amount of greenhouse gas Emission reduction potential (Wang et al., 2021); Jing et al. noticed that the number of ships passing through the Northern Sea Route has increased, and pointed out that quantifying carbon dioxide emissions is very important to protect the environment. They used the system dynamics model and combined a variety of factors to predict carbon dioxide emissions, and proposed some effective measures to reduce carbon emissions according to the forecast results (Jing et al., 2021). Wu et al. reviewed the past studies related to the shipping industry and the Emissions Trading System (ETS), pointed out that the carbon dioxide emissions of the shipping industry should not be ignored by carbon emission reduction measures, and revealed the driving factors, challenges and possible consequences for adding the shipping industry to the ETS (Wu et al., 2022). The above achievements have laid the foundation for the research on the carbon emissions of the marine industry. However, a lot of researches are limited to the carbon emissions of a specific sub-sector, and there are many other sub-sectors that are not covered.
In addition, many studies quantify the carbon emissions of subdivided marine industries, but rarely consider the structure of carbon emissions. Graphs and networks are effective methods for structural problems, whereby scholars can build a variety of networks according to their research content, and use various network indicators and theories to analyze structural problems. For example, Tang et al. constructed China’s interregional embodied energy flow network from the perspective of the regions and sectors, analyzed its structural characteristics, and identified the key sectors and regions for implementing energy conservation policies (Tang et al., 2019); while Wang et al. established a global network of embodied rare earths flows, identified China is an important network node through the network centrality theory, and analyzed the outflow path of embodied rare earths in China and the dependence of other economies on embodied rare earth (Wang et al., 2019).
The graph and network approach is very common in the study of carbon emission and carbon transfer, and a large number of studies have adopted the method of combining the input-output and network theory. The input-output approach is a common method for quantifying carbon emissions and is useful for analyzing trends in carbon transfer. For example, Wang et al. used the environmental input-output method to calculate and analyze the intermediate carbon emission transfer in 140 countries or regions around the world, and analyzed the carbon transfer in China (Wang et al., 2020); Shi et al. combined the input-output method and the structural path analysis to describe the flow process of direct carbon emissions into embodied carbon emissions in China’s supply chain (Shi et al., 2019); Wen and Wang used multi-regional input-output to quantify the carbon transfer between different provinces and different sectors in China (Wen and Wang, 2019); Zhou et al. used multi-regional input-output method to estimate the embodied carbon emissions between regions in China (Zhou et al., 2018). It is also difficult to study the problem of structure by only using the input-output method, so many scholars have combined it with network theory to dig deeper into the characteristics of network structure, and have conducted research at different levels. In the sector-level research, Jiang et al. combined input-output model and complex network theory to construct a production chain network based on carbon flow, and established indicators from both direct and indirect perspectives to quantify the importance of sectors in carbon emissions (Jiang et al., 2021); Du et al. constructed an indirect carbon emission flow network, tested its small-world nature, and identified key sectors based on complex network theoretical indicators (Du et al., 2018). At the regional level, Duan et al. combined multi-regional input-output (MRIO) with ecological network analysis (ENA) to identify key regions and sectors, and revealed inter-regional and inter-sectoral control or dependent relationship (Duan et al., 2018). Some scholars have advanced their research to the provincial level. For example, Lv et al. combined MRIO and social network analysis (SNA) to establish a provincial-level embodied carbon transfer network in China, analyzed network density, centrality, clustering characteristics and other indicators, revealed the spatial distribution and different roles of provinces, and used the quadratic assignment procedure (QAP) to study the influencing factors of carbon transfer networks (Lv et al., 2019); Similarly, Chen and Meng established China’s carbon transfer network from the perspectives of provinces and sectors based on MRIO and complex network theory, analyzed topology, clustering characteristics and final demand decomposition, identified key sectors and critical paths, and used QAP to analyze the influencing factors of carbon transfer network (Chen and Meng, 2020).
Under the background that there are few studies on the carbon emission structure of the marine industry, this paper studies the carbon emission structure of China’s marine industry to supplement the existing research. First, this paper splits 12 marine industries from the 2020 input-output table of 149 sectors, integrates them into 57 sectors based on the industry classification of the Energy Statistical Yearbook, and calculates the carbon transfer coefficient between industries based on energy consumption data, screened out the important inter-industry correlations according to the Weaver-Thomas combination index (hereinafter referred to as the W-T index) and built a marine industry carbon emission network. Secondly, we analyze the structural characteristics of the marine industry carbon emission network through the carbon transfer coefficient, degree, centrality and other network indicators, and identify the key sectors and their roles and functions in the network. Finally, we put forward some industrial-level carbon emission reduction recommendations. Our research incorporates the marine industry into the study of industrial carbon emissions, which helps to further understand the carbon emission structure, identify the key industries for carbon emission reduction. Our research also helps to formulate the effective ways to carbon emission reduction measures according to the carbon emission structure and take more targeted emission reduction measures.
2 Methods and data
2.1 Calculation of carbon transfer coefficient
Since the production process of a marine industry product has a direct or indirect consumption relationship to the intermediate products of other marine industries, and the product produces carbon emissions during the production process, carbon emissions are also transferred between industries with the transfer of products. For example, marine fishery j’s fishing fleet has a demand for fossil fuels, and marine oil and gas industry i emits CO2 when producing fossil fuels. Then marine oil and gas industry i transfers CO2 emission responsibility to marine fishery j, and carbon transfer occurs between the two industries. Similarly, the marine shipbuilding industry k has a demand for the electric energy produced by the marine electric power industry j, and the fossil fuels of the marine oil and gas industry i are used in the production process of the electric energy, so the CO2 emission responsibility in the production process of the marine oil and gas industry i is transferred to the marine shipbuilding industry k. As a result, due to the technical and economic links between various industries, a complex inter-industry CO2 transfer network has been formed.
According to the above analysis, the transfer of CO2 emissions between marine industries is related to two factors: one is the demand for the intermediate input products of marine industry i in the production process of marine industry j; the other is the CO2 emissions per unit product produced by the marine industry i. Based on this, we define the carbon transfer coefficient to describe the CO2 emission transfer relationship between industries: If a certain amount of intermediate input products of marine industry i are required in the production process of unit marine industry j product, the amount of CO2 emitted by these intermediate input products in the production process is called the carbon emission transfer coefficient, which is expressed by cij. In order to express the two influencing factors, the carbon emission transfer coefficient is expressed as the following formula:
Where aij is the direct consumption coefficient of marine industry j to marine industry i, which represents the amount of i industry product consumed when j industry produces a unit of product, this item can be calculated by the marine industry input-output table obtained by splitting; The definition of ei here is the CO2 emissions per unit product produced by the marine industry i, which can be calculated through the input-output table and the Energy Statistical Yearbook. The calculation method of ei is as follows.
The first step is to calculate CO2 the emissions from the fossil energy consumption of the marine industry. The basic idea is to multiply the consumption of various fossil energy by the CO2 emission coefficient of the corresponding energy, and then sum it up (it is explained here that electricity is not included in the calculation because electricity consumption does not produce direct CO2 emissions). The total CO2 emissions of fossil energy consumed by marine industry i are represented by Gi, which can be calculated by the formula:
Where us(i) represents the total consumption of the sth fossil energy in the production of marine industry i, which can be calculated from the China Energy Statistical Yearbook. Among them, fossil energy is divided into 8 categories (coal, crude oil, natural gas, coke, gasoline, kerosene, diesel, fuel oil). The fs represents the CO2 emission coefficient of the sth fossil energy.
The second step is to calculate the ratio of Gi obtained in the previous step to the total output Xi of marine industry i, which represents the CO2 emissions per unit product produced by marine industry i. The formula is as follows:
The carbon transfer coefficients between all marine industries are expressed in the form of a matrix, as follows:
Where C represents the carbon transfer coefficient matrix of the marine industry composed of elements cij, A represents the direct consumption coefficient matrix composed of aij, and E represents the diagonal matrix generated by ei as the element.
2.2 Construction of carbon transfer network in marine industry
The carbon transfer coefficients between marine industries calculated above depict the emissions and correlation strengths of carbon transfers between different marine industries. Considering the marine industry as a network node and the carbon transfer coefficient between marine industries as a link, a carbon transfer network between all marine industries can be constructed. The carbon transfer coefficients between different marine industries are different, so the correlation of carbon transfer between different marine industries is also different. In general, the link with a larger carbon transfer coefficient plays a more critical role in the network, while some links with a smaller coefficient play a negligible role in the network, which leads to not all nodes and links in a complete carbon transfer network deserve significant attention. Therefore, in order to deeply explore the characteristics of the network structure, it is necessary to screen out the links with important roles and construct the carbon transfer network of the marine industry that our research needs.
In the determination of the critical value, most models adopt the method of subjective experience value, such as the empirical value of 0.2, 0.5, or use the average value. These methods can identify important associations to a certain extent, but they are highly subjective. Therefore, this paper uses the Weaver-Thomas index (hereinafter referred to as the W-T index) to determine the critical value in an endogenous manner. The W-T index is an effective tool to determine the significance index, which was first proposed by Weaver and improved by Thomas later. It identifies key elements in a numerical sequence by comparing an observed distribution with a hypothetical distribution to establish a closest approximate distribution. The W-T index is very effective when determining significance arrays from non-uniform arrays. Combined with the characteristics of inter-industry carbon emissions, this paper uses the W-T index to determine the critical value.
The inter-industry carbon transfer coefficient calculated according to the split input-output table of the marine industry is an n × n square matrix. We use C(i, 1), C(i, 2), …, C(i, j), …, C(i, n)(i = 1, 2, …, n) to represent the nth indicator value under the ith sample, and C(1, j), C(2, j), …, C(i, j), …, C(n, j)(j = 1, 2, …, n) to represent the nth sample under the jth indicator. The nth sample. Under this definition, the W-T index is calculated from the column direction of the carbon transfer coefficient between marine industries. The calculation steps are as follows:
Step 1, arrange the samples under each indicator of carbon transfer coefficient matrix C, that is, C(1, j), C(2, j), …, C(i, j), …, C(n, j) (j = 1, 2, …, n), from large to small to obtain a new adjustment matrix F(i, j)(i, j = 1, 2, ⋯n). Then, set a matrix IndexC(i, j) representing the correspondence between the positions of the matrix C(i, j) and the matrix F(i, j), and each element value in the matrix IndexC(i, j) is the arrangement number of the matrix F(i, j) element in the jth column of the original matrix C(i, j).
Step 2, calculate the W-T index matrix w(i, j) corresponding to the matrix F(i, j):
The minimum value of each column in the W-T index matrix w(i, j) is formed into a row vector α, which can be expressed as
Step 3, construct a 0–1 matrix B according to the position vector β. The construction principle is to compare i in any element B(i, j) of the B matrix with the element value of the jth column of the position vector β. If i < β(1, j), then B(i, j) = 1(i = 1, 2, …, n), otherwise it is 0, so the 0–1 matrix B is obtained.
Step 4, readjust the element position of 0–1 matrix B. The position of the 0–1 matrix is restored according to the position relationship matrix IndexC(i, j) obtained in the first step, that is, the original industrial relationship is restored. We study the carbon transfer between industries, and do not study the transfer within the industry. Thus, the diagonal elements with a value of 1 in the 0–1 matrix are changed to 0. Finally, the 0–1 matrix C* of the marine industry carbon transfer network is obtained.
The required carbon transfer network between marine industries can be drawn according to the 0–1 matrix C*. For any element C*(i, j) in C*, if it is 1, it means that there is a strong correlation between marine industry j and marine industry i, and the two industries can be connected, otherwise they are not connected.
2.3 Analysis of marine industry carbon transfer network structure
2.3.1 Definition and calculation method of node degree
Node degree is an important indicator to describe the direction and intensity of carbon transfer of a single industry in the marine industry carbon transfer network. In the carbon transfer network, the number of edges that node i directly points to other nodes is called the out-degree of node i, denoted as Oki; the number of edges that other nodes directly point to node i is called the in-degree of node i, denoted as Iki, the degree of node i is the sum of node out-degree Oki and node in-degree Iki.Assuming that the adjacency matrix of the marine industry carbon transfer network with n nodes is
2.3.2 Definition and calculation method of betweenness centrality and eigenvector centrality
Betweenness centrality is an indicator that characterizes the importance of a node by the number of shortest paths through node i. Assuming that the number of shortest paths for material and information transmission between any two nodes s and t is gst, and the number of shortest paths passing through the third node i is
Eigenvector centrality is an index that reflects the importance of a node through the importance of its neighbors. xi is the importance value of node i, c is the proportional constant, and aij is the element of the adjacency matrix of the network, there are:
Written in the form of a matrix, it can be expressed as x = cAx, and transformed into Ax = c−1x, then x can be understood as an eigenvector with the eigenvalue c−1 of matrix A, so it is called eigenvector centrality.
2.3.3 Basic correlation structure of marine industry carbon transfer network
The basic association structure of the marine industry carbon transfer network emphasizes connecting all nodes in the network with the largest transfer weight and the fewest edges. This is mainly to find out the core path of carbon transfer in the marine industry carbon transfer network, and to identify the sub-networks with the strongest influence and the simplest structure.
The network N is directly constructed based on the unscreened carbon transfer coefficient matrix C, assuming
Step 1: Set an empty set Et with a weight of 0.
Step 2: Select the edge e1 ∈ E with the largest edge weight and put it into Et, so that w(e1) satisfies the maximum weight condition.
Step 3: If Et already contains edge e1, e2, …, ei, select
Step 4: If
2.4 Data sources
With the rapid development of the marine economy and its increasing role in China’s national economy, the carbon emissions of the marine industry also deserve attention. This paper splits the marine industry from the national industry classification, aiming to study the carbon emission structure of the marine industry. The data sources are as follows: ① The 2020 China Marine Economy Statistical Bulletin issued by the Ministry of Natural Resources; ② 149 sectors 2020 National Input-Output Table issued by National Bureau of Statistics; ③ National Economic Industry Classification (GB/T 4754-2017) updated in 2017; ④ China Energy Statistical Yearbook 2021 issued by the National Bureau of Statistics.
3 Results
3.1 Source and processing of marine industry data
This paper subdivides the marine industry into 12 sectors, namely marine fishery, offshore oil and gas industry, marine mining industry, marine salt industry, marine chemical industry, marine biomedicine industry, marine power industry, seawater utilization industry, marine shipbuilding industry, offshore engineering construction industry, marine transportation industry and coastal tourism industry, and then constructs 12-sector marine industry input-output table for subsequent calculation and analysis.
The complex relationship between the marine industry and the national economy makes it difficult to separate (for example, the offshore oil and gas industry is included in oil and gas extraction products, extraction ancillary activities and other mining products, refined petroleum and nuclear fuel processing products; marine salt industry is included in non-metallic mineral processing products and other food products), and the 12 marine industries are not directly listed in the official input-output table of 149 sectors in 2020. Therefore, in order to obtain the 12-sector marine industry input-output table, we need to split the existing national input-output table.
The input-output table splitting process must follow the basic constraints of rows and columns, that is, ”intermediate use + final use = total output, intermediate input + initial input = total input, total output = total input”. According to this condition, horizontal splitting and vertical splitting are carried out for the relevant sectors respectively. Finally, the input-output table of 161 sectors including the marine industry in 2020 is obtained. The specific splitting process is as follows:
① Determine the split weight of the marine industry in the input-output table
The 2020 China Marine Economy Statistical Bulletin and the National Economic Industry Classification (GB/T 4754-2017) provide the conceptual definitions of the marine industry and the national economic industry. Based on this, we find out the corresponding industries that need to be split in the input-output table for each marine industry, and the added value data of these industries can be found from the marine economic statistical bulletin and the input-output table. After the added value is determined, the ratio of the added value of the marine industry to the added value of the corresponding industry (the sum of the added value if there are multiple corresponding industries) is the split weight of the marine industry. The sectoral correspondence and split weights are shown in Table 1 below.
② Splitting and sorting of input-output tables
According to the split weights in the above table, the corresponding sectors in the national 149 sectors’ input-output table are split. Complying with the above row and column constraints, the data of 12 marine industries are extracted by weight, and the data of the corresponding marine industry need to be subtracted from the divided industries. In addition, all marine industries need to be split horizontally and vertically. In the splitting process, the first quadrant needs to be split in both the row and column directions, the second quadrant only needs to be split horizontally, and the third quadrant only needs to be split vertically.
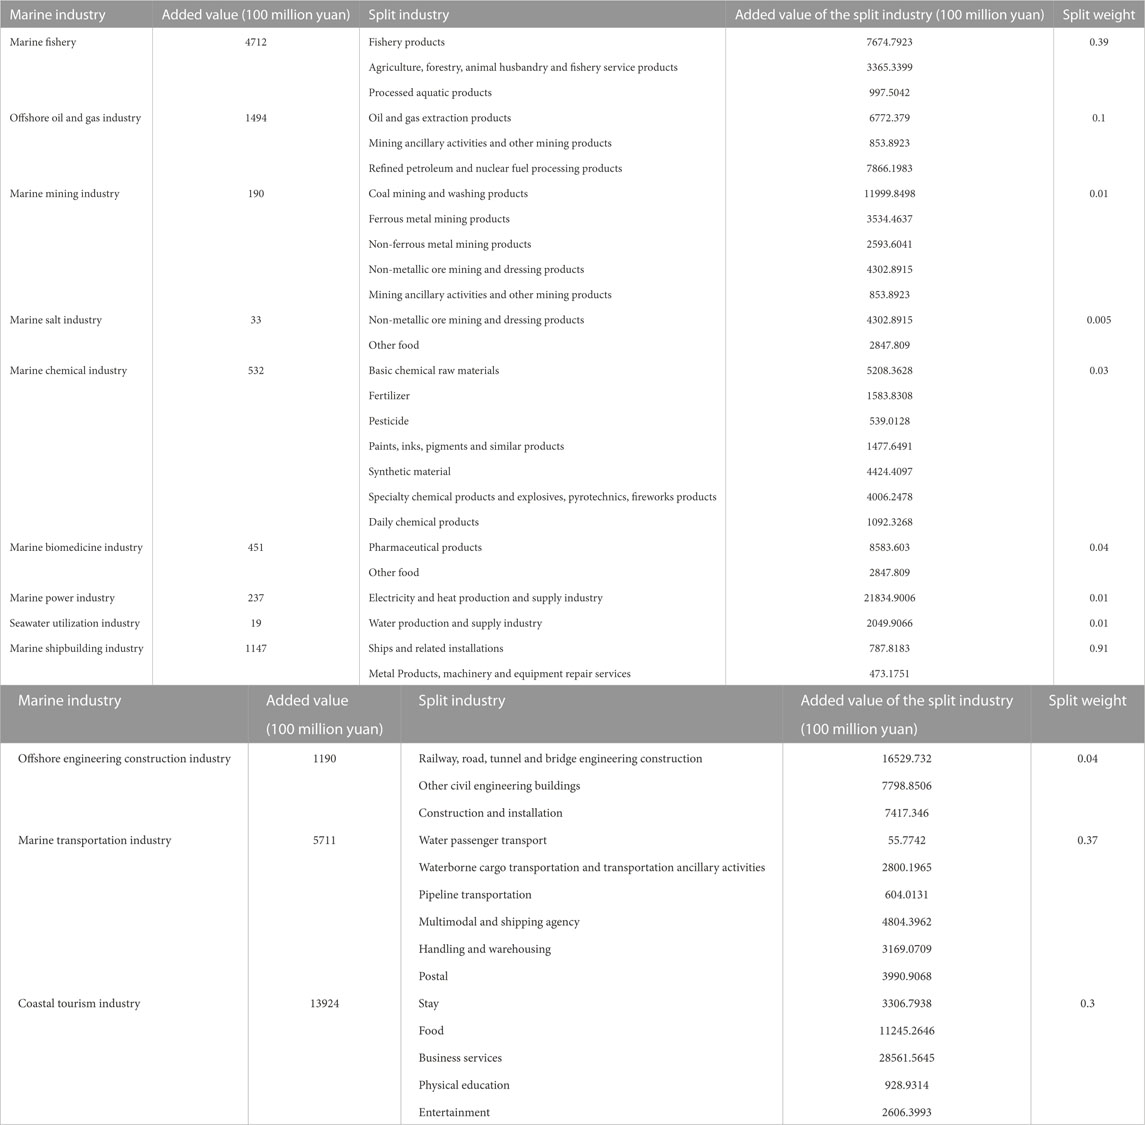
TABLE 1. Input-output table marine industry split weight.
3.2 Processing of energy data and integration of input-output tables
The data used in this paper are the energy data by industry for 2020, which come from the China Energy Statistical Yearbook 2021 issued by the National Bureau of Statistics. The industry is subdivided into 47 categories in the energy statistical yearbook, which is different from the classification of the input-output table. There are 161 sectors in the input-output table obtained by splitting and sorting in the previous step, which is far more than the number of categories in the energy statistical yearbook. Therefore, both the split of the marine industry in the energy data and the consolidation of the input-output table are based on the industry classification of the energy statistical yearbook.
The splitting process of the marine industry in the energy data is similar to the splitting process in the input-output table. Firstly, the industries are determined that need to be split corresponding to the marine industry in the energy data, and the added value is used to calculate the split weights of the marine industry. Secondly, the corresponding industries in the energy data are split according to the weights, and the constraint that the sum of each column remains unchanged is obeyed. The difference from the split of the input-output table is that it only needs to be split horizontally. Finally, the energy data for 57 sectors including the marine industry is obtained. The inter-industry correspondence and the split weights used in the paper are shown in Table 2.
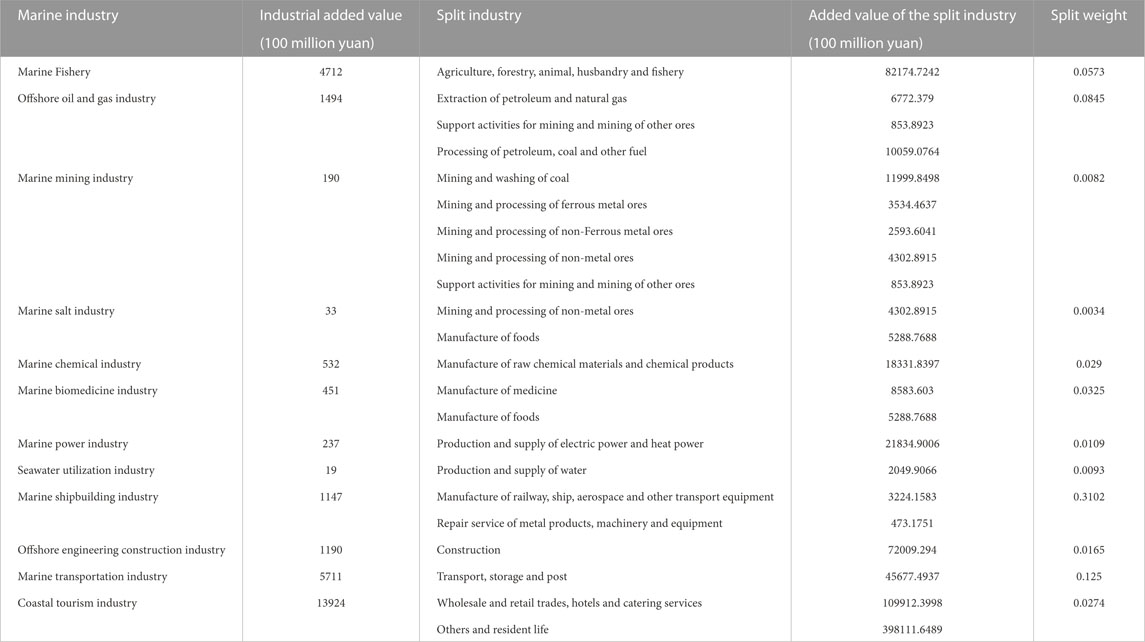
TABLE 2. Split weight of marine industry based on energy data.
The merging of the input-output table still needs to follow the above constraint. According to the industry classification standard in the energy data, the input-output table with the 161 sectors obtained above is merged again, and it needs to be split horizontally and vertically respectively. Finally, a 57×57 sectoral input-output table containing the marine industry is obtained. The energy consumption data and input-output table of 57 sectors are presented in the Supplementary Material.
3.3 Analysis of carbon transfer coefficient of marine industry
Based on the definitions of the marine industries, the 2020 China Input-Output Table and the Energy Statistics Yearbook, the industries were split and combined to maintain a consistent industry classification, and the final industries and their codes are shown in Table A1 in Appendix A. A total of 3,249 carbon transfer coefficients, including 410 zero values, were obtained according to the methodology in 2.1. Excluding the coefficients for industry self-association, a total of 160 inter-industry strong associations were screened using the Weaver Index. The marine industry carbon transfer network of China in 2020 was constructed using the industries as nodes and the strong association as the connected edge criterion, as shown in Figure 1.
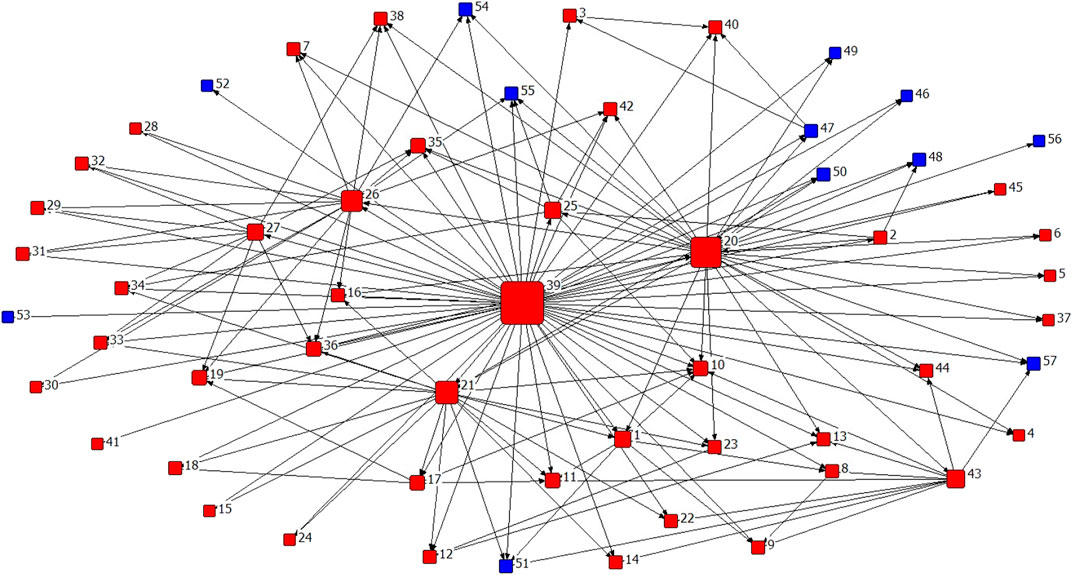
FIGURE 1. Marine industry carbon transfer network of China in 2020. Note: Nodes 46–57 in the figure represent the marine industry and are shown in blue, while nodes 1–45 represent the rest of the national industry and are shown in red. The importance of the nodes is initially expressed according to the number of carbon transfer associations between them, which is expressed as the size of the nodes, the larger the node the higher the degree.
The carbon transfer coefficients of the industries calculated above are ranked and the key industries are initially identified according to the rankings. First of all, the carbon transfer coefficients of all industries are ranked and the top 30 of them are taken out. The results are shown in Table 3. Among the outflow industries, production and supply of electric power and heat power (39) appears 14 times, processing of petroleum, coal and other fuels (20) appears 9 times, manufacture of raw chemical materials and chemical products (21) and smelting and pressing of ferrous metals (26) appear 3 times respectively, and non-ferrous metal smelting and rolling processing industry appears 1 time. In terms of frequency, No. 39 and No. 20 industries appear 76.7% of the time, so they are the key carbon outflow industries. In terms of the size of carbon transfer coefficient, the sum of carbon transfer coefficient of No. 39 industry as an outflow industry accounts for 61.07% of the total of the top 30, which is still the most critical outflow industry. Among the inflow industries, 9 of the top 30 industries are marine industries, accounting for 30% of the total, indicating the importance of marine industries in the inflow industries, among which marine chemical industry (50) needs special attention.

TABLE 3. Top 30 carbon emission coefficients among all industries in 2020.
Secondly, the carbon transfer coefficients of all marine industries are ranked, and again the top 30 of them are taken out, and the results are shown in Table 4. Among the outflow industries, offshore oil and gas industry (47) appears 10 times, marine transportation industry (56) appears 9 times, marine power industry (52) appears 8 times, marine chemical industry (50) and marine fishery (46) appear 2 times and 1 time respectively. No. 47, No. 56 and No. 52 industries have similar frequency and appear 90% of the time cumulatively, which are the most critical outflow marine industries. On the whole, the carbon transfer coefficient of marine industries is small, but the sum of carbon transfer coefficient of offshore oil and gas industry (47) accounts for 81.37% of the sum of the top 30, which obviously deserves key attention. Among the inflow industries, 12 marine industries appear with similar frequency and are relatively evenly distributed, with no marine industries requiring special attention.
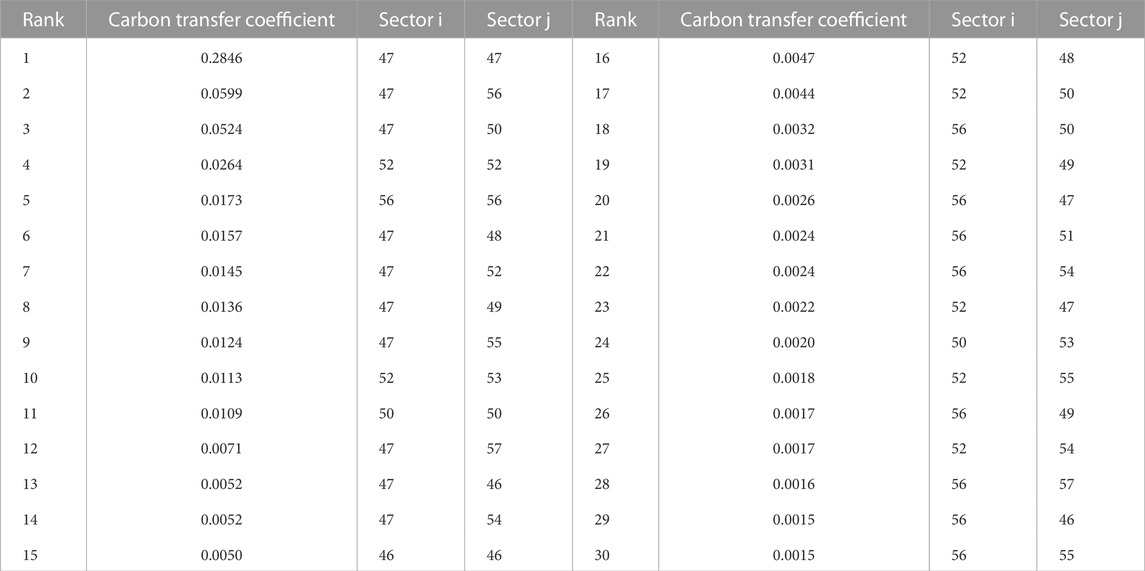
TABLE 4. Top 30 carbon emission coefficients among marine industries in 2020.
3.4 Analysis of the basic network characteristics
3.4.1 Out-degree and in-degree analysis
The out-degree and the in-degree are important indicators to portray the connected edge relationships between nodes, which directly reflects the carbon inflow and outflow relationship between industries. The greater the number of industries to which an industry exports carbon, the greater the out-degree, and similarly, the greater the number of other industries that export carbon to an industry, the greater the in-degree. The out-degree and the in-degree reflect the scope of carbon outflow and carbon inflow of an industry, respectively, and directly indicate the number of industries with which carbon transfer occurs. If carbon reduction measures are taken for industries with large out-degree and in-degree, the impact will spread to neighboring industries, resulting in a wider range of carbon reduction effects.
The marine industry carbon transfer network of China in 2020 involves 57 industries, with no isolated nodes in the network, and the in-degree and out-degree of each industry is shown in Table 5. In terms of out-degree, the out-degree can reflect the carbon outflow relationship of industries in the carbon transfer network, and the key carbon outflow industries can be directly judged according to the out-degree. There are 42 industries with zero degree of output, representing that these industries do not emit carbon to the outside. Production and supply of electric power and heat power (39), processing of petroleum, coal and other fuels (20), manufacture of raw chemical materials and chemical products (21), smelting and pressing of ferrous metals (26) and transport, storage and post (43) have higher emissions of 54, 30, 18, 15 and 10 respectively, while the remaining 10 industries have emissions between 0 and 10. Production and supply of electric power and heat power (39) has the highest out-degree and is the most critical industry in terms of outflow for almost all industries. In terms of in-degree, the industry with the highest in-degree is the manufacture of liquor, beverages and refined tea (10) with an in-degree of 7, representing the industry as the most critical carbon inflow industry, followed by industries with an in-degree of 5, such as manufacture of articles for culture, education, arts and crafts, sport and entertainment activities (19) and other manufacture (36). For the marine industry, only the offshore oil and gas industry (47) has a non-zero out-degree and all marine industries have a non-zero in-degree.
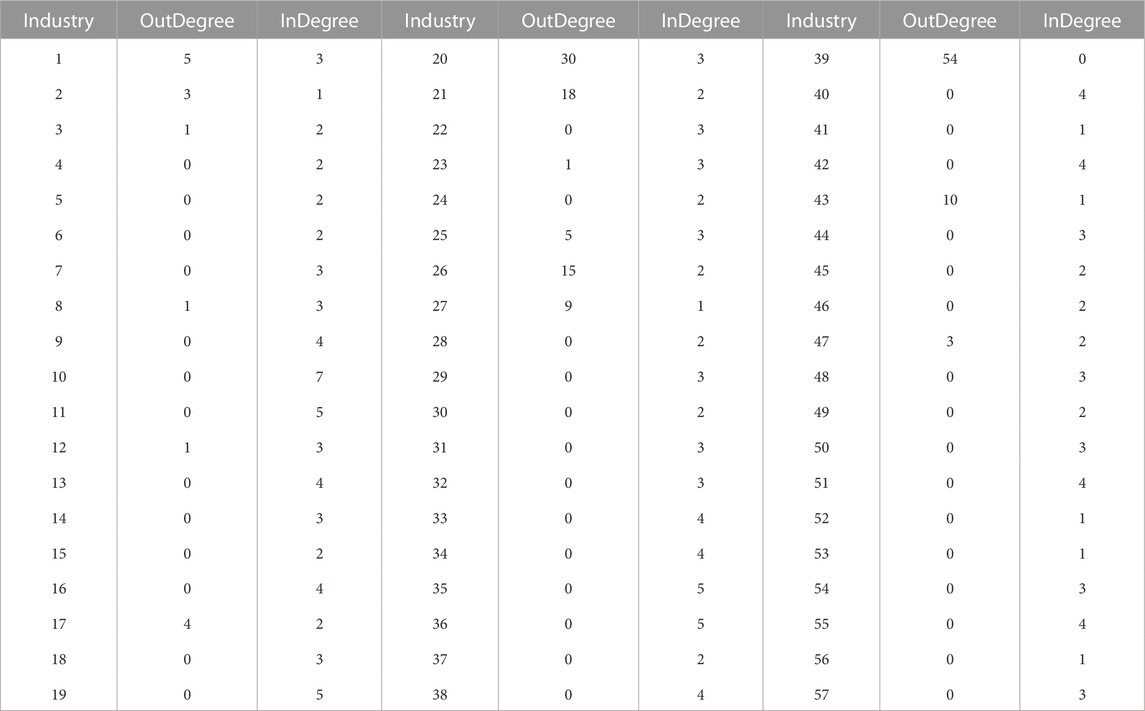
TABLE 5. Out-degree and in-degree of each industry.
3.4.2 Analysis of betweenness centrality
In a network, material or information flows between nodes along connected edges and betweenness centrality reflects whether a node is at a key position in the flow process. In the process of industrial carbon transfer, the betweenness centrality reflects whether a particular industry plays a key role as a ”bridge” or ”intermediary” in the transfer process. If a large proportion of the shortest carbon transfer paths between two industries pass through a certain industry, that industry has a high betweenness centrality and is in a key position of inter-industry carbon transfer. The industry with higher betweenness centrality has more carbon transfer paths passing through it, which usually leads to its own larger carbon transfer, so it is important to take measures for this industry to reduce its own carbon transfer and control the carbon transfer between industries on both sides of it. The calculation results of the betweenness centrality of each industry are shown in Table 6.
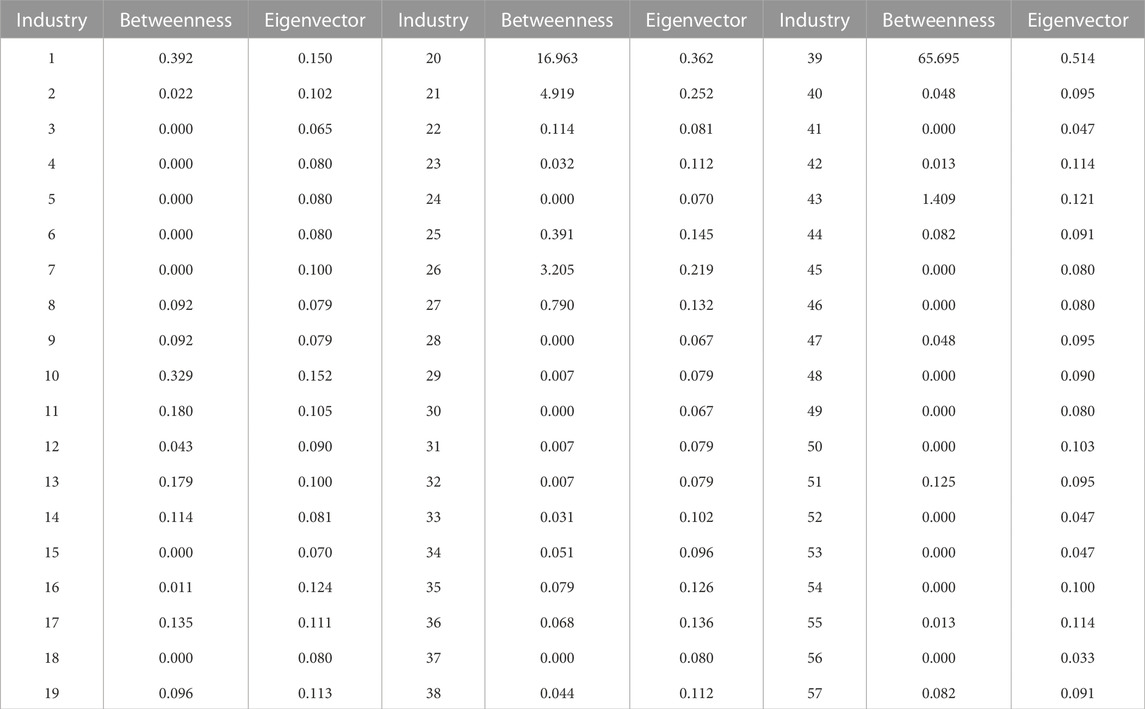
TABLE 6. Betweenness centrality and eigenvector centrality of industries.
According to the calculated data, production and supply of electric power and heat power (39) and the processing of petroleum, coal and other fuels (20) both have a betweenness centrality greater than 10, which is significantly higher than that of the other industries, and have the strongest control over carbon flows, making them the most critical ”intermediary” industries in the network. The betweenness centrality of the manufacture of raw chemical materials and chemical products (21), the smelting and pressing of ferrous metals (26), and the transport, storage and post industry (43) are between 1 and 10, and are the next most critical industries, while the betweenness centrality of the rest of the industries is less than 1 and less important. For the marine industries, the marine biomedical industry (51), coastal tourism industry (57) and the Offshore oil and gas industry (47) have a relatively low betweenness centrality, but are significantly more important than the other marine industries and are important ”intermediary” marine industries.
3.4.3 Analysis of eigenvector centrality
Eigenvector centrality describes the closeness between a node and the core nodes of its network. The basic idea is that the importance of a node depends not only on the number of its neighboring nodes, but also on the importance of the neighboring nodes. The higher the eigenvector centrality value of a node, the higher its closeness to the core node and the more important the node is. In the marine industry carbon transfer network, the more carbon transfer linkages an industry has with other industries, and the more central the associated industries are in the network, the stronger the eigenvector centrality of the industry. Industries with high eigenvector centrality are often key industries that need to reduce carbon emissions, and when they take measures to reduce their own carbon emissions, the effect can be further radiated to their neighboring key industries, which is important for the overall carbon reduction of key industries in the network. The results of the calculation of the eigenvector centrality for each industry are shown in Table 6.
The results show that the production and supply of electric power and heat power (39) has the largest eigenvector centrality, significantly higher than other industries, and is the most important industry in the network. Processing of petroleum, coal and other fuels (20), manufacture of raw chemical materials and chemical products (21), and smelting and pressing of ferrous metals (26) have larger eigenvector centrality and are significantly different from the remaining industries and are more important. The remaining industries have an even distribution of eigenvector centrality with no obvious gap. For the marine industries, except for the marine power industry (52), seawater utilization industry (53) and marine transportation industry (56), the remaining marine industries have no significant difference in eigenvector centrality and are significantly higher than the three industries, which are considered to be less important in the network and priority is given to the carbon reduction plans of other marine industries.
3.5 Analysis of the base association tree
The basic association tree is the core path in the network, which can clearly show the association structure among industries. In the marine industry carbon transfer network, the basic association tree reflects the largest carbon transfer weight among industries with the least association, its diameter is the longest carbon transfer path, and the center helps to determine the key industries in the carbon transfer network. It is important to reduce carbon emissions by taking measures on the diameter and key industries in the basic association tree.
The carbon transfer coefficient between industries is used as the weighting factor to identify the important edges with the greatest weight at each node, and the least number of edges is used to link all the nodes, which is the base linkage tree of the marine industry carbon transfer network in 2020, see Figure 2. The maximum value of the furthest distance between any two nodes in the base association tree is called the diameter and the minimum value is called the radius, as shown in the diagram, 52 ↔ 32 ↔ 53 ↔ 16 ↔ 11 ↔ 14 ↔ 35 ↔ 7 ↔ 1 ↔ 34 is the diameter. The diameter contains 10 industries in total, which is the longest path in the basic association tree and an important basis for analyzing the network structure. Around the most important diameter, there are three more important flow paths, which are respectively connected to the No.16 industry, the No.11 industry and the No.35 industry. A node is considered to be a centroid of the graph if its furthest distance from any node in the graph is the radius. By definition, the centroid is located in the middle of the diameter, is closer to other industries, is more closely connected and is the key industry in the tree. In the base association tree, the centroid industry is No.11 industry and No.14 industry, and the industries furthest from the centroid are No.52 industry and No.34 industry, which are less connected to other industries. It is easy to see that the seawater utilization industry (No.53) has the largest number of links with other industries, and the industry is also located on the diameter, so it has an important position in the basic linkage tree. In addition, as many as seven marine industries are directly linked to the seawater utilization industry, indicating that it plays an important role in the carbon transfer process among marine industries.
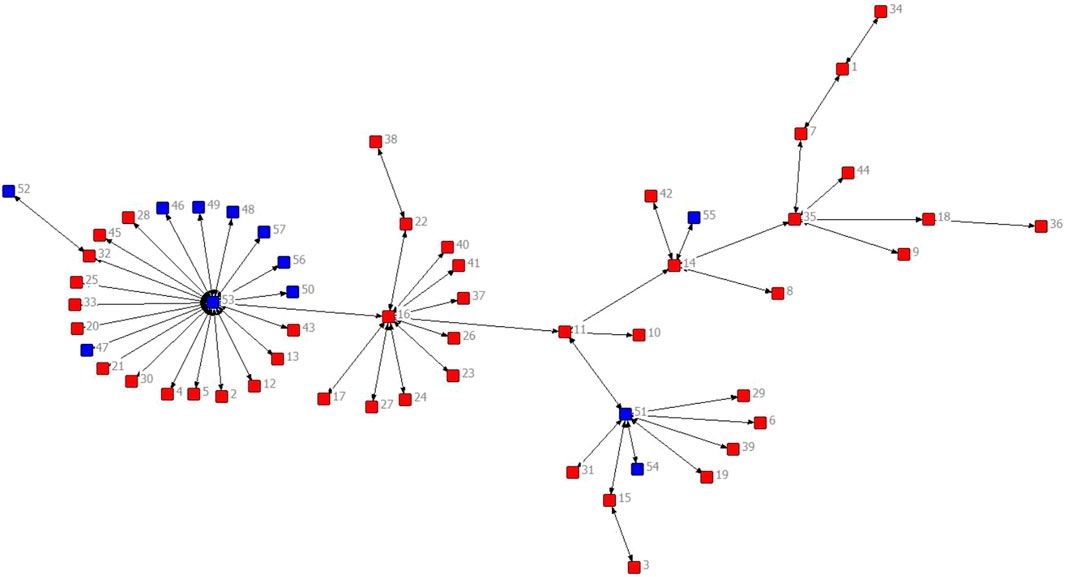
FIGURE 2. Base association tree in the marine industry carbon transfer network in 2020. Note: Nodes 46–57 in the figure represent the marine industry and are shown in blue, while nodes 1–45 represent the rest of the national industry and are shown in red.
4 Discussion
Based on the results of the above study, we have made some suggestions for the reduction of emissions in the carbon network of China’s marine industries.
The carbon transfer coefficient directly reflects the intensity of the carbon transfer between two industries. From the results, the electricity and heat production and supply industry (39) is the industry with the largest emission coefficient in the network and the industry with the most serious CO2 emission problem. From the perspective of carbon transfer coefficient, carbon reduction measures for No.39 industry can be taken from two aspects. The first is the direct consumption coefficient. Usually, the demand for electricity and heat is very large and cannot be replaced, so it is difficult to achieve the goal of carbon emission reduction by reducing the direct consumption of its products. The second is the use of fossil energy. The CO2 emission coefficient of each fossil energy is different. For example, diesel (3.25) is much higher than that of coal (2.69). Therefore, carbon reduction can be achieved by reducing the use of high-emission energy sources and changing the mix of fossil energy use, such as increasing the use of natural gas with the lowest emission factor to replace other high-emission fossil energy sources. In addition, due attention should be given to the use of renewable energy sources, such as promoting the development and use of hydro, wind, solar and geothermal energy. The conversion efficiency of electricity and heat can also be improved by promoting technological innovation, taking into account the loss of energy in the conversion process. In terms of carbon transfer coefficients among marine industries, similarly, for the offshore oil and gas industry (47), the marine transportation industry (56) and the marine power industry (52), which are important in the marine industry, emission reductions should be achieved through the combined use of fossil energy, and the marine power industry should also take measures to enhance the development and utilization of tidal energy, wave energy and wind energy to achieve emission reductions.
In terms of out-degree, No. 39 industry is clearly the industry with the largest out-degree, with carbon emissions covering almost all industries in the network. If measures are taken to reduce direct carbon emissions from No. 39 industry, the carbon reduction effect will radiate throughout the network. The processing of petroleum, coal and other fuels (20) has an output of 30, covering most of the network nodes, and is the next most critical outflow industry. In terms of in-degree, industries with a high in-degree imply a large inflow of carbon, and this industry is likely to be an important industry in the indirect transfer of carbon. In order to avoid a large amount of indirect transfer, it is equally necessary to pay attention to the carbon emission reduction of such industries. It is worth noting that among the 12 marine industries, except for the offshore oil and gas industry (47), which has an out-degree of 3, the others are all 0, which proves that the overall carbon emission of the marine industry is relatively weak, and it is an inflow-based industry. Emphasis should be given to reducing carbon inflows from upstream industries, while at the same time considering the low-carbon production of the industry’s own products. In terms of betweenness centrality and eigenvector centrality, the electricity and heat production and supply industry (39) is not only the core industry in the entire network, but also the most critical ”bridge”. As the core of the network, industries closely related to it also have a strong influence. As an ”intermediary”, it has a strong control over the carbon transfer in the network. Due to the strong controlling role of No. 39 industry, reducing its carbon emissions will have the same effect of reducing carbon flows or emissions of neighboring industries.The realization of carbon emission reduction should not only take measures at important nodes, but also consider important carbon transfer paths. As the longest path in the basic association tree, the diameter of the industry has an important impact on the entire network and should be paid attention to. In addition to the industries at the end of the diameter, the other industries on the diameter play an important supporting role for the entire network structure, and are also critical to the effective implementation of carbon emission reduction. Trying to reduce the path length will effectively reduce the carbon emission of the entire network. In addition, three important paths that are diametrically connected should also be paid attention to.
Compared with the previous literature, this paper makes the following contributions: firstly, the marine industry is split from the National Industry Classification and all industries are analyzed together; secondly, the carbon transfer coefficient of the industry is calculated and a marine industry carbon transfer network is constructed based on this; thirdly, the carbon transfer problem is analyzed from the perspective of the network structure, which enriches the research in this field. In addition, there are some limitations and shortcomings in this paper: firstly, this paper calculates the split weights of the marine industry based on the value added of the industry, the scientific nature of the value added index is open to question, and future research can adopt a more reasonable method of determining the weights; secondly, the indicators used to analyze the network structure can be further optimized, and future research can adopt or design more effective indicators to reflect the characteristics of the network structure.
5 Conclusion
Industry linkages are formed between industries based on their techno-economic linkages and various other linkages, and are expressed in the form of input and output activities of various products, so the carbon emitted during the production of products is also transferred through industry linkages, and the responsibility for carbon emissions is also transferred between industries. This paper splits 12 marine industries from the industrial classification, calculates inter-industry carbon transfer coefficients based on national input-output tables and energy consumption data in 2020, constructs a marine industry carbon transfer network and analyses the structural characteristics of the network. This paper extends the study of the relationship between the carbon emission structures of marine industries, which can help in the formulation of carbon reduction policies. Based on the analysis of carbon transfer coefficients, out-degree and in-degree, betweenness centrality and eigenvector centrality, we conclude that the electricity and heat production and supply industry is always the most critical node in the network, with the greatest carbon emission intensity, and also assumes the most important role as a ”bridge” in the network. For No. 39 industry, carbon emissions can be reduced directly by changing the mix of fossil energy use, and according to its strong control over neighboring industries, the carbon emission reduction effect will also radiate to neighboring industries. According to the analysis of the basic association tree, carbon emission reduction should pay attention to the critical path and its industry in the network, and try to reduce the length of the transmission path to reduce the carbon emission of the whole system. For the marine industry, the values of the indicators are generally low compared to other industries, and the industry has a limited role in the carbon transfer network. Currently, the marine industry is dominated by carbon inflows and mainly considers changing its demand for products from upstream industries to achieve emission reduction. The offshore oil and gas industry (47), as the most critical industry in the marine industry, presents obvious carbon outflow compared with other marine industries, and should also focus on the carbon emission of its own output.
Based on the above conclusions, this paper puts forward the following policy recommendations (1): The electricity and heat production and supply industry is the most critical industry in the carbon transfer network, and also an important driving force of China’s rapid economic development, which needs to appropriately improve carbon emission standards and encourage the rationalization of its fossil energy use structure. It should also vigorously improve the construction of clean energy infrastructure through policy support, promote the innovative development of clean energy technologies, and increase the use of clean energy as a percentage, and these recommendations are also applicable to carbon emission reduction in the offshore oil and gas industry. (2) In general, the marine industry has a low position in the carbon transfer network and is a carbon inflow industry, so it needs to focus on its demand side and its own carbon emission reduction. It is recommended to promote the concept of low-carbon production in the marine industry, optimize the production structure, improve the low-carbon requirements for intermediate products in the upstream industry, and increase the proportion of low-carbon intermediate products in their production. At the same time, measures should be taken to promote the green technology innovation of the marine industry, appropriately improve the carbon emission standards and reduce the carbon emission of their own products. (3) Inter-industry carbon transfer covers the carbon outflow of upstream industries and the carbon inflow of downstream industries. Therefore, it is necessary to coordinate upstream and downstream industries and encourage inter-industry cooperation to reduce emissions. Upstream industries should take the initiative to reduce product carbon emissions through measures such as green technology progress and improvement of industrial structure. Downstream industries should establish a strict intermediate product access mechanism to supervise and promote the low-carbon production of upstream enterprises and jointly undertake carbon emission reduction responsibility.
Data availability statement
The original contributions presented in the study are included in the article/Supplementary Material, further inquiries can be directed to the corresponding author.
Author contributions
LWA: Idea formulation and conceptualization, design of research methods, assignment of tasks, supervision, writing. XZ: Data collection and processing, data visualization, writing and editing. LWE: Data collection and processing, writing and editing. WX: Assignment and supervision, funding acquisition, design research methodology, writing and review.
Funding
The National Natural Science Foundation of China (No. 71973086), the Humanities and Social Sciences fund of the Ministry of Education of China(No. 20YJC630164), and Natural Science Foundation of Shandong Province (No. ZR2020QG030).
Acknowledgments
We would like to acknowledge the financial support from the National Natural Science Foundation of China (No. 71973086), the Humanities and Social Sciences fund of the Ministry of Education of China(No. 20YJC630164), and Natural Science Foundation of Shandong Province (No. ZR2020QG030).
Conflict of interest
The authors declare that the research was conducted in the absence of any commercial or financial relationships that could be construed as a potential conflict of interest.
Publisher’s note
All claims expressed in this article are solely those of the authors and do not necessarily represent those of their affiliated organizations, or those of the publisher, the editors and the reviewers. Any product that may be evaluated in this article, or claim that may be made by its manufacturer, is not guaranteed or endorsed by the publisher.
Supplementary material
The Supplementary Material for this article can be found online at: https://www.frontiersin.org/articles/10.3389/fenrg.2023.1107796/full#supplementary-material
References
Bagoulla, C., and Guillotreau, P. (2020). Maritime transport in the French economy and its impact on air pollution: An input-output analysis. Mar. Policy 116, 103818. doi:10.1016/j.marpol.2020.103818
Chen, W., and Meng, Y. (2020). Research on China’s embodied carbon transfer network in 2012 from the perspective of provinces and sectors. Environ. Sci. Pollut. Res. 27, 38701–38714. doi:10.1007/s11356-020-09528-z
Du, Q., Xu, Y., Wu, M., Sun, Q., Bai, L., and Yu, M. (2018). A network analysis of indirect carbon emission flows among different industries in China. Environ. Sci. Pollut. Res. 25, 24469–24487. doi:10.1007/s11356-018-2533-x
Duan, C., Chen, B., Feng, K., Liu, Z., Hayat, T., Alsaedi, A., et al. (2018). Interregional carbon flows of China. Appl. Energy 227, 342–352. doi:10.1016/j.apenergy.2018.01.028
Greer, K., Zeller, D., Woroniak, J., Coulter, A., Winchester, M., Palomares, M. D., et al. (2019). Global trends in carbon dioxide (co2) emissions from fuel combustion in marine fisheries from 1950 to 2016. Mar. Policy 107, 103382. doi:10.1016/j.marpol.2018.12.001
Jiang, M., An, H., Gao, X., Zheng, H., and Li, Y. (2021). Identifying the key sectors in the carbon emission flows along the production chain paths: A network perspective. Ecol. Indic. 130, 108050. doi:10.1016/j.ecolind.2021.108050
Jing, D., Dai, L., Hu, H., Ding, W., Wang, Y., and Zhou, X. (2021). Co2 emission projection for arctic shipping: A system dynamics approach. Ocean Coast. Manag. 205, 105531. doi:10.1016/j.ocecoaman.2021.105531
Lv, K., Feng, X., Kelly, S., Zhu, L., and Deng, M. (2019). A study on embodied carbon transfer at the provincial level of China from a social network perspective. J. Clean. Prod. 225, 1089–1104. doi:10.1016/j.jclepro.2019.03.233
Parker, R. W., Blanchard, J. L., Gardner, C., Green, B. S., Hartmann, K., Tyedmers, P. H., et al. (2018). Fuel use and greenhouse gas emissions of world fisheries. Nat. Clim. Change 8, 333–337. doi:10.1038/s41558-018-0117-x
Shi, J., Li, H., An, H., Guan, J., and Arif, A. (2019). Tracing carbon emissions embodied in 2012 Chinese supply chains. J. Clean. Prod. 226, 28–36. doi:10.1016/j.jclepro.2019.04.015
Tang, M., Hong, J., Liu, G., and Shen, G. Q. (2019). Exploring energy flows embodied in China’s economy from the regional and sectoral perspectives via combination of multi-regional input–output analysis and a complex network approach. Energy 170, 1191–1201. doi:10.1016/j.energy.2018.12.164
Wang, Q., and Wang, S. (2022). Carbon emission and economic output of China’s marine fishery–a decoupling efforts analysis. Mar. Policy 135, 104831. doi:10.1016/j.marpol.2021.104831
Wang, S., Wang, X., and Tang, Y. (2020). Drivers of carbon emission transfer in China—An analysis of international trade from 2004 to 2011. Sci. Total Environ. 709, 135924. doi:10.1016/j.scitotenv.2019.135924
Wang, X., Yao, M., Li, J., Ge, J., Wei, W., Wu, B., et al. (2019). Global embodied rare earths flows and the outflow paths of China’s embodied rare earths: Combining multi-regional input-output analysis with the complex network approach. J. Clean. Prod. 216, 435–445. doi:10.1016/j.jclepro.2018.12.312
Wang, Z., Silberman, J. A., and Corbett, J. J. (2021). Container vessels diversion pattern to trans-arctic shipping routes and ghg emission abatement potential. Marit. Policy & Manag. 48, 543–562. doi:10.1080/03088839.2020.1795288
Wen, W., and Wang, Q. (2019). Identification of key sectors and key provinces at the view of co2 reduction and economic growth in China: Linkage analyses based on the mrio model. Ecol. Indic. 96, 1–15. doi:10.1016/j.ecolind.2018.08.036
Wu, M., Li, K. X., Xiao, Y., and Yuen, K. F. (2022). Carbon emission trading scheme in the shipping sector: Drivers, challenges, and impacts. Mar. Policy 138, 104989. doi:10.1016/j.marpol.2022.104989
Appendix A
In this study, after splitting and merging the final 57 industries, the industry names and codes are shown in Table A1.
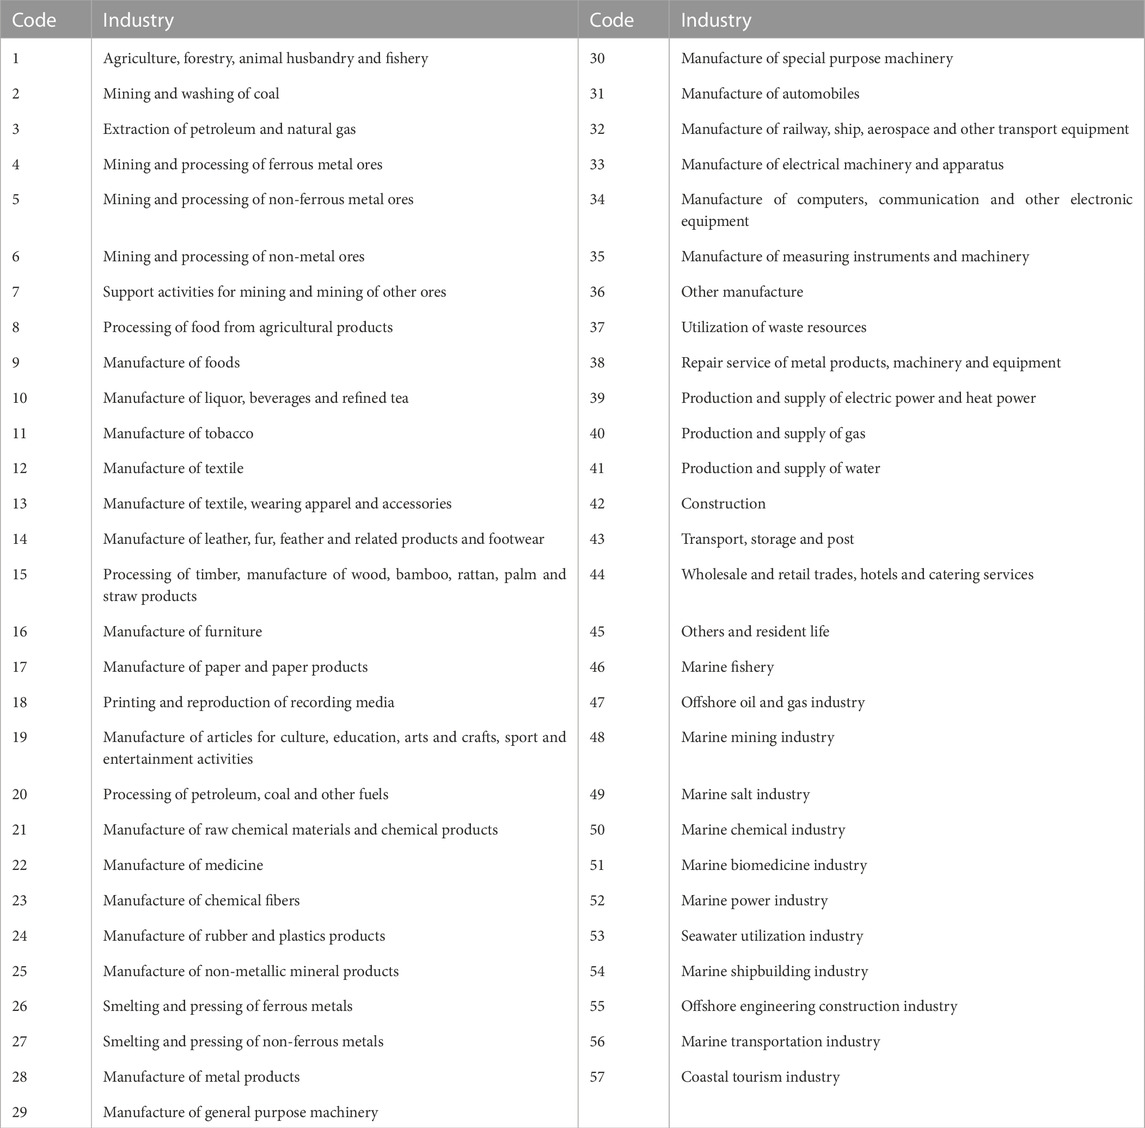
TABLE A1. Final industry division and code table.
Keywords: marine industry, carbon dioxide emissions, complex network, input-output table, weaver-thomas combination index, China
Citation: Wang L, Zhou X, Wei L and Xiao W (2023) A network analysis of carbon emission flows among marine industries in China. Front. Energy Res. 11:1107796. doi: 10.3389/fenrg.2023.1107796
Received: 25 November 2022; Accepted: 25 January 2023;
Published: 13 February 2023.
Edited by:
Shu-Yuan Pan, National Taiwan University, TaiwanCopyright © 2023 Wang, Zhou, Wei and Xiao. This is an open-access article distributed under the terms of the Creative Commons Attribution License (CC BY). The use, distribution or reproduction in other forums is permitted, provided the original author(s) and the copyright owner(s) are credited and that the original publication in this journal is cited, in accordance with accepted academic practice. No use, distribution or reproduction is permitted which does not comply with these terms.
*Correspondence: Wenwen Xiao, eGlhb3dlbndlbjE4QHNkanp1LmVkdS5jbg==