 Gang Sun1
 Peichao Li
 Detang Lu
- 1Department of Modern Mechanics, University of Science and Technology of China, Hefei, China
- 2School of Mechanical and Automotive Engineering, Shanghai University of Engineering Science, Shanghai, China
- 3Shengli Oilfield Kangbei Petroleum Engineering Equipment Co., Ltd., Dongying, China
Introduction: As a new agent of enhancing oil recovery, the dispersed particle gel (DPG) has been gradually used for in-depth profile control in mature oilfields. Many researchers investigated the preparation, profile control mechanism and application of DPG based on a series of laboratory experiments. However, few numerical studies have been carried out on profile control mechanism of DPG.
Methods: This paper proposes a novel mathematical model to proceed numerical simulation of profile control for DPG, considering DPG particles adsorption and weak shear thinning effects. The numerical codes are verified by the UTCHEM simulator.
Results and discussion: The effects of the DPG viscosity, the DPG concentration, the water saturation of high permeable regions and the permeability ratio between high and low permeable regions on decreasing the water-cut of producing well are studied. Simultaneously, this paper also investigates the influence of different mobility ratios between high and low permeable regions on water shutoff of DPG. The numerical simulation results show that the effects of DPG profile control become better as the DPG solution viscosity, the suspension concentration and the permeability ratio increase. But the increased water saturation of high permeable regions is not helpful to improve oil recovery. Water plugging effect of DPG becomes worse with increasing mobility ratio between different regions. According to comparison results between DPG profile control and polymer flooding, it is found that DPG profile control is more suitable for heterogeneous reservoirs. These findings are of benefit to guide the efficient field application of DPG profile control in heterogeneous reservoirs.
1 Introduction
At present, the major oil fields in China have come into high water-cut period after long-term water flooding exploitation. The water content of production wells in mature oil fields is generally above 90%. The injected water can easily reach production wells along channels or fractures in high permeable zones, making it more and more difficult to increase production by water injection (Ju et al., 2008; Deolarte et al., 2009; Li et al., 2016). As a result, there is a lot of residual oil in low permeable zones which cannot be displaced out by continued water flooding. According to statistics, conventional water flooding usually produces only one-third to two-fifths of the oil in geological reserves (Ji et al., 2012). The main means of decreasing water production in mature oil fields is to improve oil recovery by replacing water flooding with new oil field development techniques, such as chemical flooding (Al-Muntasheri et al., 2007; Dai et al., 2014a; Dabiri and Honarvar, 2020). Enlarging swept volume and increasing displacement efficiency are two key approaches to enhance oil recovery by chemical flooding. Compared with increasing displacement efficiency, expanding swept volume is a better choice on the basis of field practice of oil fields in heterogeneous reservoirs. In order to decrease water-cut by means of expanding swept volume, various chemical methods were adopted, including conventional polymer flooding, foam flooding (Moosavi et al., 2019), in situ gel systems and particles gel systems (Moradi-Araghi, 2000; Perez et al., 2001; Wassmuth et al., 2007; Beverte, 2014). However, polymer flooding is unsuitable especially in highly heterogeneous reservoirs by reason of bad water shutoff effect and weak conformance control capacity. The foam flooding is difficult to sustain for a long time because of its very short timeliness. In order to obtain good foam flooding effect, stable and continuous nitrogen or air resources are required, which increases the cost of profile control treatments. In situ gel systems are easily affected by shear rate, extreme formation conditions and some other factors (Seright et al., 2003; McCool et al., 2009). Meanwhile, these gel systems have inherent drawbacks, such as uncontrollable swollen gel strength, uncontrollable gelation time and dilution caused by contact with formation fluids.
/In order to overcome the above-mentioned problems, particles gel systems had been popularized and applied. Among them, micro gel (Chauveteau et al., 2001; Bybee, 2005; Zaitoun et al., 2007), preformed particle gel (Bai et al., 2007a; Bai et al., 2007b; Wang et al., 2013) and dispersed particle gel (Dai et al., 2012) are the most commonly used for profile control and water shutoff. The micro gel is not suitable for large-scale oilfield production due to lower displacement efficiency and higher cost. The particle size of preformed particle gel is mainly millimeter scale, making it more difficult to inject PPG particles into low permeable reservoirs, which limits the range of PPG application. Compared with first two particles gel systems, the dispersed particle gel (DPG) has the advantages of easy injection, easy preparation and meeting the needs of large-scale industrial production. As a new profile control agent for water shutoff treatments and enhancing oil recovery, previous studies are mainly focused on DPG particles preparation (You et al., 2011; Dai et al., 2012; Zhao et al., 2013), DPG profile control mechanism (Zhao et al., 2014; Liu et al., 2016) and experiments to explore the properties of DPG (You et al., 2013; You et al., 2014; Dai et al., 2017). It rarely involves numerical simulation of DPG conformance control. Based on experimental results of DPG physical properties, this paper proposes a novel mathematical model considering DPG particles adsorption and weak shear thinning. First, we investigate the influences of the DPG viscosity, the DPG concentration, the water saturation of high permeable regions and the permeability ratio between different regions on improving oil recovery by numerical simulation. Second, the effects of different mobility ratios of flowing through the high and low permeable regions on water plugging in the high permeable zones are studied. Finally, the differences of decreasing water-cut between polymer flooding and DPG flooding are compared. These numerical simulation results can ultimately provide scientific basis and technical support for DPG formulation design and field application.
2 Preparation of DPG particles
2.1 Typical morphology of DPG particles
DPG is prepared with polymer and cross-linker, which can swell up to 30 times its beginning size in brine. DPG is a particle system formed by the mechanical shearing of the dried gel on the ground. Swollen gel strength and particle size are controllable, overcoming some distinct drawbacks of in situ gel systems. And as a new profile control agent, DPG is environmentally friendly, and not sensitive to reservoir minerals and formation brine (Dai et al., 2014b). With mechanical shearing for 6 min, the DPG particles are prepared on the shearing equipment. The microstructure of prepared DPG particles is observed by scanning electron microscope (SEM), which is shown in Figure 1.
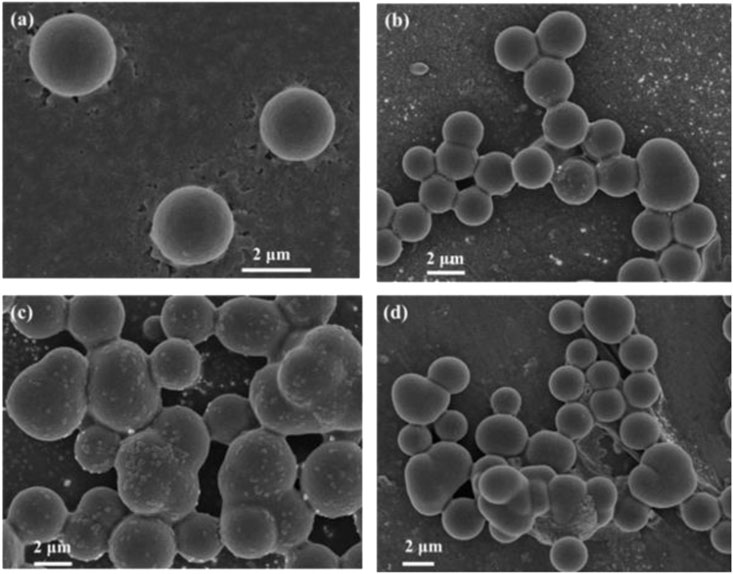
FIGURE 1. Microscopic morphology of DPG: (A) Initial state; (B) aging for 5 days; (C) aging for 15 days; (D) aging for 30 days.
It can be seen from Figure 1 that the DPG solution is composed of regular pseudo spheres particles. When the DPG solution is prepared with high salinity produced water and aged at 90°C for 5 days, 10 days, and 15 days respectively, SEM is used to study the microscopic morphology of DPG particles. Figure 1 reveals the microscopic morphology of DPG particles before and after aging at high temperature. Scanning electron micrographs show that the DPG solution is uniformly distributed as a single particle before aging, and single DPG particle size is mainly dispersed between 1.8 and 2.2 μm. After 5 days aging under high salinity and temperature conditions, the size of the individual particle begins to be bigger and the shape tends to be irregular, and the expansion of DPG particles is limited, which enables the particles to maintain a high strength; when the DPG is further aging, the particles aggregates with each other, forming larger DPG particle aggregates. After aging for 30 days, the aggregates size can be up to 20 μm. When the DPG begins to age at high temperature, the presence of electrolytes and high temperature accelerates particles aggregation. Because the surface of DPG particles is negatively charged, and high salinity water contains a high concentration of ions, there will be more ions in the adsorption layer so as to reduce or even completely neutralize the charge on the DPG particles surface, which decreases mutual repulsive force between particles. This is the main reason for the increase of particle size.
The macroscopic pictures of DPG solution before and after aging are showed in Figure 2. As we can see, no degradation or dehydration occurs in the DPG solution after ageing in Figure 2, which shows DPG good temperature and salt resistance. These properties of DPG are beneficial to the effective profile control of high permeable zones. When pore throat radius is small, a single particle can swell to implement water shutoff; when pore throat radius is large, multiple particles will form a larger particle aggregation and achieve conformance control of high water-cut reservoir.
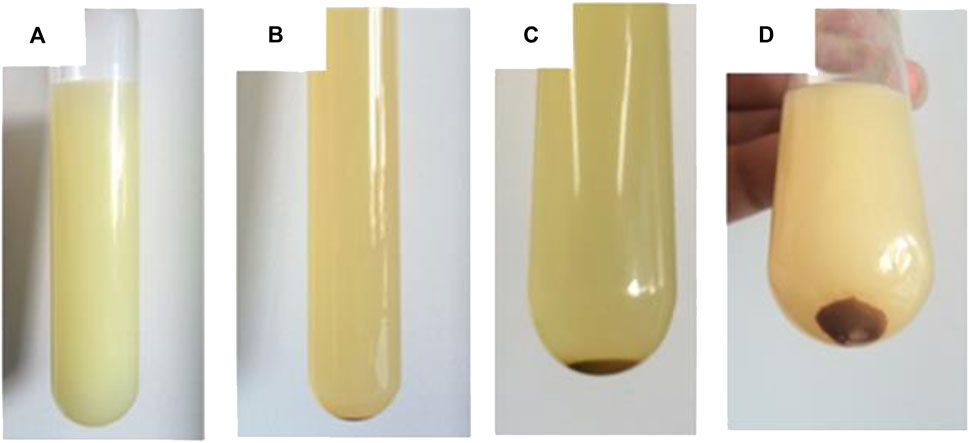
FIGURE 2. Macroscopic morphology of DPG: (A) Initial state; (B) aging for 5 days; (C) aging for 15 days; (D) aging for 30 days.
2.2 Properties of DPG viscosity
Figure 3A points out that the viscosity of the gel system increases as the DPG concentration increases. This is because the DPG particles will clump together when the number of DPG particles increases, and free movement of particles becomes difficult with the increase of interaction force between particles, resulting in a big increase in the viscosity of the gel system. But the increase in polymer viscosity is mainly due to the random entanglement of groups of the polymer. Bond strength between polymer groups is very weak. Therefore, the viscosity of polymer solution at the same concentration is lower than that of DPG.

FIGURE 3. The comparison of polymer and DPG: (A) viscosity-concentration curve; (B) viscosity versus shear time.
Conventional polymer used for enhancing oil recovery is affected by shear of ground injection equipment and underground percolation. As shown in Figure 3B, the viscosity of polymer can be reduced by more than 50% after 20 min of ground equipment shearing. So the shear thinning effect should be considered in the numerical simulation model of polymer flooding. In other words, the shear resistance of polymer is poor, and most injected water easily reaches production wells along high permeable regions when implementing polymer flooding in heterogeneous reservoirs. In view of shear thinning, the shear resistance of DPG is investigated by comparing with polymer. At room temperature, shearing equipment is respectively used to DPG particles and conventional polymer shear at 1,000 rpm for 5 min, 10 min, 15 min, and 20 min. The corresponding viscosity is measured at 30°C, and both of them have a mass concentration of 0.2%. Figure 3B illustrates that the viscosity of polymer decreases sharply with the increase of shear time, however the viscosity of DPG decreases slightly with increasing shear time. DPG solution is a stable system formed by the high viscoelasticity body gels with high-speed mechanical shear, which can still maintain effective viscosity after a period of shearing. So it is necessary to take shear resistance effect into account and it can be approximated that the viscosity of DPG is constant, when the mathematical model of DPG profile control is proposed.
3 Mathematical model
3.1 Model assumptions
For simplicity DPG in conformance control, the main assumptions are as follows: 1) The process of DPG profile control is isothermal and energy exchange is negligible in the reservoirs; 2) the extended Darcy’s law applies when fluid flows through porous medium; 3) the fluid underground only contains two phases: The water phase and the oil phase, and the water phase contains three components: pure water, DPG particles and salt; 4) the process of DPG particles adsorption is irreversible; 5) no chemical reaction takes place; 6) diffusion and dispersion for DPG particles are negligible.
3.2 Governing equations
Using the above assumptions, mass balance equations are given for each component. Considering the physicochemical phenomena including weak shear thinning effect, permeability reduction, DPG particles adsorption and dead pore volume, the basic equations of the DPG profile control model are as follows:
Continuity equation for oil component:
Continuity equation for water component:
Continuity equation for DPG particles component:
Well flow equations for multiphase flow:
where p is the pressure, Pa; K is the absolute permeability, m2; Kr is the relative permeability, dimensionless; Cm is the concentration of DPG particles in the water phase, kg/m³; Cm,ads is the concentration of DPG adsorbing on pore throat surface, kg/m³; γ is the gravity factor, N/m3; μ is the viscosity, Pa·s; D is the depth, m; q is the flow rate, m³/s; t is the time, s; ϕ is the porosity, dimensionless; B is the formation volume factor, dimensionless; rw is the wellbore radius, m; re is the effective radius, m; s is the skin factor, dimensionless; subscript l represents the liquid phase, l = o, w, o represents oil, w represents water; subscript m is the DPG component.
3.3 Auxiliary equations
Constrained condition of saturation:
Constrained condition of capillary force:
Based on the capillary force function (J function), the capillary force (Qin and Li, 2003):
where pcow is the capillary pressure between water and oil, Pa; J (sw) is the Leverett J-function; σwo is interface tension between water and oil, N/m; θ is the wetting angle.
3.4 Adsorption term treatment of DPG particles
DPG particles flowing through the reservoir can interact with the rock surface, which causes DPG particles to bind to the surface of the rock, reducing DPG concentration in the aqueous phase. In the process of numerical simulation, empirical formula calculation and data table interpolation are given to determine the DPG adsorption concentration.
(1) Formula method:
The amount of DPG particles adsorption on rock surface can be calculated by Langmuir adsorption isotherm.
where Cm,ads is the absorption concentration of DPG particles, kg/m³; Cmax m, ads is the maximum saturation adsorption concentration of DPG particles, kg/m³; ap and bp are the coefficients changing with ion concentration, obtained by fitting the experimental data, dimensionless.
(2) Data table interpolation method:
According to the relationship between DPG concentration and its adsorption concentration at a certain salt concentration in related experiments, DPG adsorption concentration is attained by interpolating DPG concentration.
For both of these methods, this paper assumes that DPG particles adsorption is an irreversible process. The following steps are adopted in the actual calculation: 1) Determine the maximum adsorption concentration of DPG, which is usually given by experiments; (2) the adsorption concentration of DPG in the current time step was calculated by Langmiur isothermal adsorption equation; (3) update DPG particles adsorption concentration if it is greater than the adsorption concentration of the previous time step, the adsorption concentration remains unchanged if the adsorption concentration is less than that of the previous time step.
3.5 Discretization and linearization of governing equations
PEBI grid has the following advantages: Flexible grid division, any grid points can be arranged in place, without considering other grid points; Easy to change the shape and size of the grid, suitable for describing complex geological boundaries, tectonic faults, pinch-outs, etc. Compared with regular grid, the grid orientation effect can be reduced. The near-well area can be locally encrypted and the coarse and fine mesh is smooth, which is suitable for describing the radial flow in the near-well area. So PEBI mesh is used for division instead of corner point grid in this paper. The governing equations are discretized by finite volume method, linearized by Taylor expansion and time term conservation form expansion, and the coefficient matrix of the equations is obtained. Finally, GMRES solver is used to solve the coefficient matrix. Since GMRES algorithm is a mature solution technique for solving large sparse matrices, this section focuses on the discretization and full implicit linearization of equations (Zha et al., 2018).
Here, we take Eq. 3 as an example and its discrete scheme is given:
In Eq. 9, the coefficients of the terms are shown below:
where wij is the area of interface between adjacent grids, m2; dij is the distance between the center points of adjacent grids, m; Vi is the volume of grid i, m3; n is the time step.
Fully implicit linearization of Eq. 9 is as follows:
where ν is the iterative step, the subscript + is the upstream grid.
4 Verification of the model
In view of no commercial software and field data available for verification, the mathematical model for profile control of DPG is simplified without considering the shear resistance and variable viscosity after aging. The numerical results by using this simulator are compared with those of UTCHEM simulator (Kazemi Nia Korrani et al., 2015). The reservoir is a 150 m × 150 m × 10 m rectangular area with a closed boundary. There is a production well and an injection well in the area, and the distance between them is 130.5 m. The rectangular grid with 13 rows and 13 columns is adopted in UTCHEM simulator. The simulation time is 2,000 days, and the total injected pore volume is 4 PV. The injection well firstly injects water for 100 days, then injects the DPG solution for 400 days and finally injects water for 1,500 days at a constant rate of 90 m3/d, and the concentration of DPG is 20 kg/m3, and the production well lasts 2,000 days with a constant rate of 90 m3/d at surface condition. Formation parameters for numerical simulation are listed in Table 1. Figure 4A shows that flowing bottom hole pressure of production well decreases first and then increases to reach a stable value as the volume of the injected displacement fluid increases. This is because the fluid around production well is extracted from the ground first and then the balance between injection and production is reached. It can be seen from Figure 4B that flowing bottom hole pressure of injection well increases first and then decreases to reach a stable value with the increase of the volume of the injected displacement fluid. This is due to the displacement fluid being injected into the formation and reaching an injection-production balance as it breaks through into the producing well. As shown in Figure 4A, the difference of bottom hole pressure of production wells is relatively large, which is because the bottom pressure of DPG profile control is very sensitive to the change of DPG concentration, and a small difference in DPG concentration may also lead to a big difference in pressure calculation results. The comparison results indicate that the numerical results of two simulators are similar, so the correctness of DPG profile control simulation is verified.
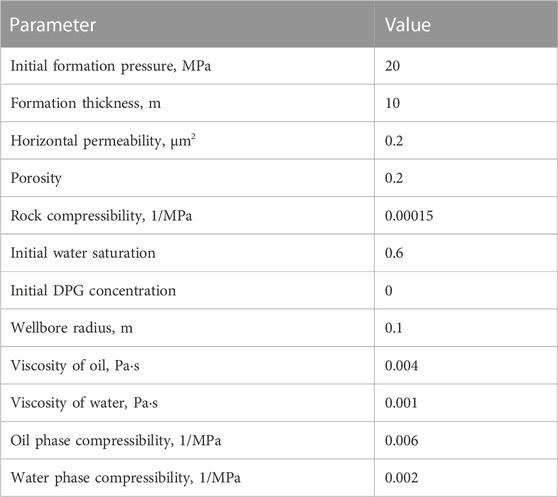
TABLE 1. Reservoir and fluid property parameters.
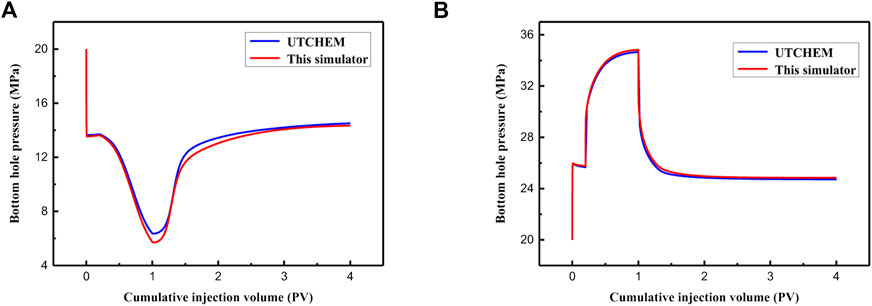
FIGURE 4. Flowing bottom hole pressure comparison: (A) Production wells; (B) injection wells.
5 Results and discussion
5.1 Sensitivity analysis
The viscosity and concentration relationship of DPG is the key factor affecting water plugging in high permeability areas. The application of DPG can be limited by the relevant parameters of high water-containing heterogeneous layers such as water saturation and permeability ratio. In order to investigate the influences of DPG properties and reservoir conditions on water-cut reduction, a PEBI grid system (500 × 500 × 5.9 m) is established. In the basic simulation case, there is an injection well and four production wells in the reservoir, as shown in Figure 5. The injection rates respectively are 72 m3/d for 6 days, 48 m3/d for 3 days, 0 m3/day for 7 days and 60 m3/day for 720 days; the production rates separately are 18 m3/d for 6 days, 12 m3/day for 3 days, 0 m3/day for 7 days and 15 m3/day for 720 days, every producing well produces same quantitative liquid. The DPG concentration is 1.6 kg/m3, the absolute permeability of high permeable layer is .4145 μm2, and the permeability ratio between high and low permeable regions is 8.4. The main numerical simulation parameters for sensitivity analysis are listed in Table 2.

FIGURE 5. Well position and mesh generation.
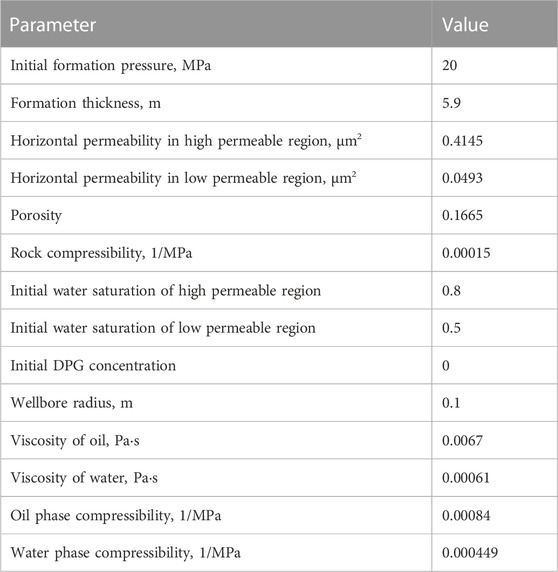
TABLE 2. Reservoir and fluid property parameters.
5.1.1 DPG solution viscosity
The viscosity of DPG is an important property that determines whether it is suitable for decreasing water-cut in the process of DPG profile control. Therefore, it is necessary to investigate the impacts of the viscosity of DPG on increasing oil recovery by means of numerical simulation. In this section, a numerical example is used to study the influences of viscosity of DPG on conformance control. When the DPG viscosity is adjusted to 1, 2, 3, and 5 times that of conventional polymer at the same concentration, the water-cut of producing well 2 and the bottom hole pressure of the injection well varies.
It can be seen from Figure 6B that DPG profile control can reduce the water-cut of producing well 2 and improve oil recovery. As the viscosity of DPG increases, both the width and depth of water-cut funnel plots increase. Simultaneously, cumulative oil production of producing well 2 also increases when the viscosity of DPG increases in Figure 7. If the viscosity of DPG is too high, the bottom hole pressure of the injection well will exceed formation pressure allowable as shown in Figure 6A. In fact, bottom hole pressure of the injection well can’t be very high and DPG can be easily injected into the reservoir because of artificial fractures or channels caused by water flooding for a long time in the reservoirs. In conclusion, considering the profile control effect and the cost of DPG, the viscosity of DPG is better to be about 2 times that of the conventional polymer.
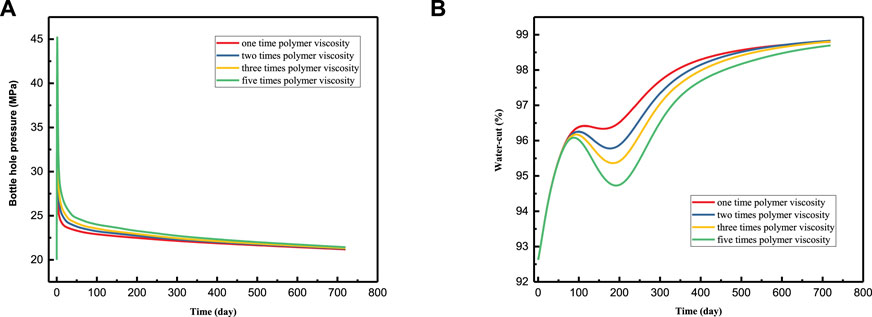
FIGURE 6. The comparison under different DPG viscosity: (A) Bottom hole pressure of injection well; (B) water-cut of production well 2.
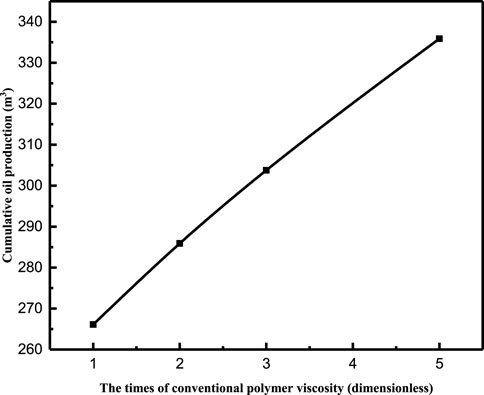
FIGURE 7. Cumulative oil production of producing well two under different DPG viscosity.
5.1.2 DPG concentration
After a long time water flooding, a 432 cubic DPG solution is injected with the concentration of 0.5, 1.0, 1.6, 3.0 and 5.0 kg/m3, and then switch to water flooding for 3 days, afterwards shut down the wells for 7 days. After 15 days of DPG profile control, the reservoir begins to inject water for 720 days, the numerical results are shown in Figure 8. It can be seen that both the width and depth of water-cut funnel increase with the increase of DPG concentration in Figure 8A. This is because that when the DPG concentration is lower, there is a smaller quantity of particles adsorbing on rock surface, and the permeability of high permeable regions decreases less, so the injected water can still channel into the producing well along the high permeable regions. The remaining oil in the low permeable regions has not been displaced out. As the DPG concentration increases, adsorption quantity in the high permeable regions increases, which improves formation heterogeneity in this way. Then, a mass of remaining oil in low permeable regions is displaced out by the sustained injection water. This is evident from Figure 8B that cumulative oil production will increase with the increase of DPG concentration.
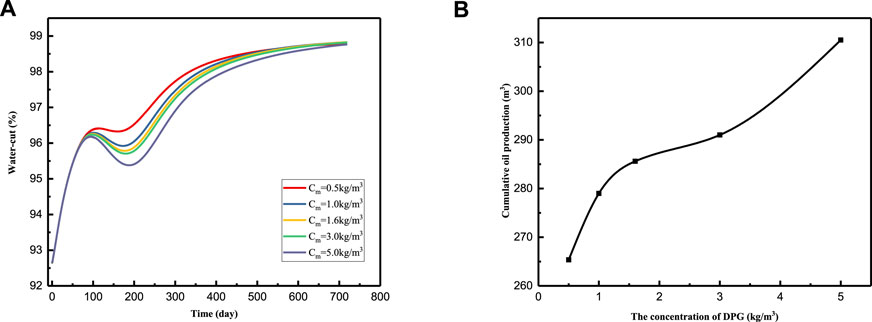
FIGURE 8. The comparison under different DPG concentrations: (A) Water-cut of producing well 2; (B) cumulative oil production of producing well 2.
5.1.3 Water saturation
After water flooding for a long period of time, a 432 cubic DPG solution is injected with water saturation of 0.6, 0.7, 0.8 and 0.9 in high permeable regions, and then switch to water flooding for 3 days, afterwards shut down the wells for 7 days, and the water saturation of low permeable regions keeps constant. After 15 days of DPG profile control, the reservoir begins to be injected with water for 720 days, the results are shown in Figure 9. It can be seen that both the width and depth of water-cut funnel increase, as the water saturation of high permeable regions decreases in Figure 9A. This is because the amount of DPG particles adsorbing on the rock surface decreases when water saturation increases in the high permeable regions. So the later injected water can easily channel into the producing well along the high permeable regions, which results in that the remaining oil in the low permeable regions cannot be displaced out. When the water saturation in the high permeable areas is more than 0.8, water cut funnel curve changes little and the effect of water shutoff is not obvious. As shown in Figure 9B, cumulative oil production decreases rapidly and eventually comes close to be stable with increasing water saturation in high permeable areas.
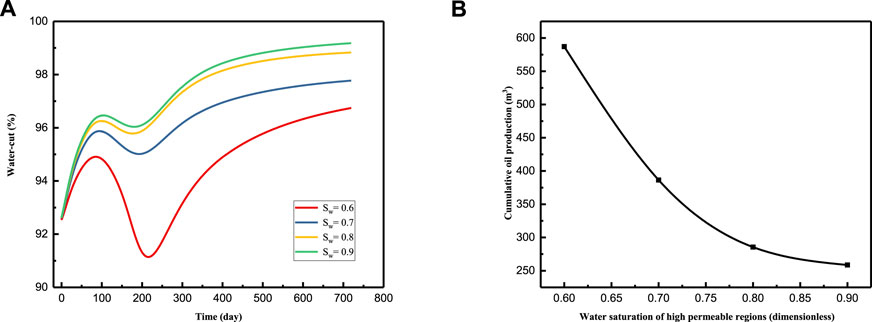
FIGURE 9. The comparison under different water saturation: (A) Water-cut of production well 2; (B) cumulative oil production of producing well 2.
5.1.4 Permeability ratio between high and low permeable regions
First of all, we establish a series of geological models with the permeability ratio of 5, 10, 15, 20, 25 and 30 between high and low permeable regions. After a long time water flooding, a 432 cubic DPG solution is injected with the concentration of 1.6 kg/m3. After the implementation of profile control treatment, the reservoir begins to be injected with water for 240 days. Figure 10A indicates that the water-cut funnel is not obviously found, when the permeability ratio between high and low permeable regions is no more than 5; as the permeability ratio increases continuously, the water-cut funnel turns to be obvious and its depth and width increases gradually; after the permeability ratio reaches 15, the width of water-cut funnel increases slightly as permeability ratio increases. This is because that when the permeability ratio is small, the pore throat size makes a small difference between high and low permeable regions. The DPG particles can enter into different permeable regions at the same time, and the heterogeneity of the reservoir is not well improved. Hence the DPG profile control is not suitable for reservoirs with poor heterogeneity. When the permeability ratio further increases, the difference of the pore throat size between high and low permeable regions gets bigger, and the DPG particles are easier to access to high permeable regions, which results in more particles adsorbing on pore throat surface or retention in the pore throat. As may be seen from Figure 10B, cumulative oil production increases with the increase of permeability ratio between high and low permeable areas. The cumulative oil production tends to be stable when the permeability ratio is more than 25. Because of the limit of maximum adsorption concentration, some extra DPG particles will enter into low permeable regions, which affects enhancing oil recovery. Therefore, it is very important to decide whether or not to implement DPG profile control in consideration of the actual conditions of the reservoirs.
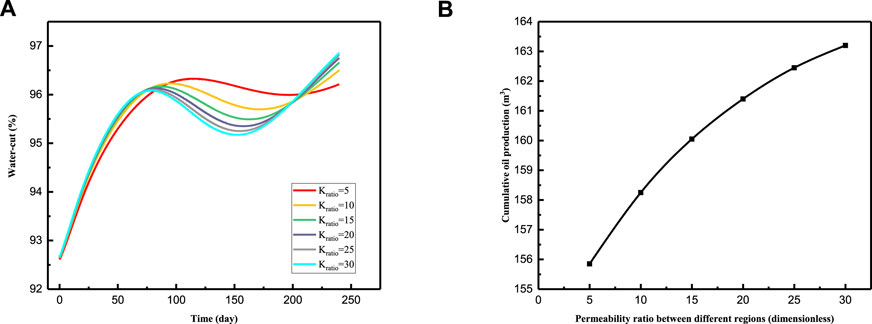
FIGURE 10. The comparison under different permeability ratios: (A) Water-cut of production well 2; (B) cumulative oil production of production well 2.
5.2 The influence of the mobility ratio on water shutoff
In addition to the above DPG solution viscosity, DPG concentration, water saturation of high permeable regions and permeability ratio between high and low permeable regions, there are other factors affecting the water shutoff effect of DPG profile control. In order to further understand the water plugging principle of DPG, the following numerical simulation examples are given.
In this section, a 500 × 500 × 5.9 m single-layer heterogeneous reservoir is studied. The green and brown areas are high permeable areas and the other white areas are low permeable areas. There is a five-point well pattern with one injection well and four producing wells, and the brown high permeable zone is closer to the injection well, as shown in the Figure 11 below. The injection well is firstly injected with the DPG for 6 days and then the water for 3 days at a constant rate of 72 m3/d, and the concentration of DPG is 1.6 kg/m3, and the four production wells last 9 days with a constant rate of 18 m3/d at surface condition. The main numerical simulation parameters are the same as the sensitivity analysis example.
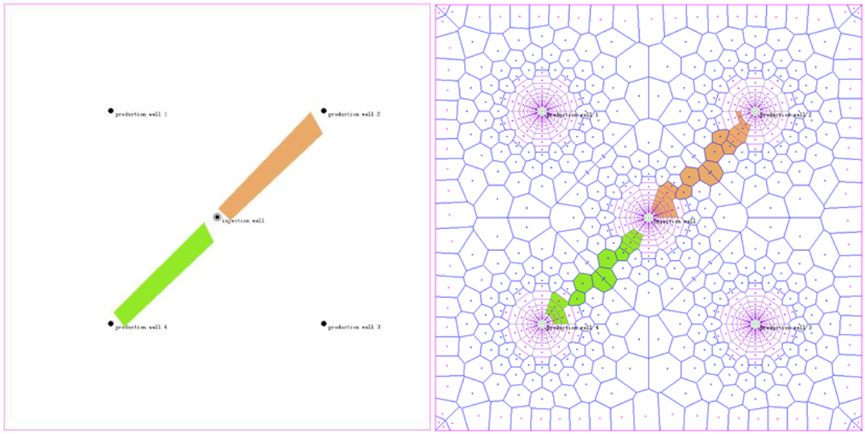
FIGURE 11. Well position chart and mesh generation.
In order to reveal effective factors of water shutoff, the mobility ratio between the high and low permeability zones is adjusted in the process of numerical simulation. The following Figure 12 show the distribution of DPG concentration after profile control for 9 days when the mobility ratios are 24 and 84 respectively. As can be seen from the figures below, the DPG concentration closer to the injection well in the high permeability zones is lower than that in other high permeability zones, so the injected water is easier break through the DPG sealing zones closer to the injection well. When the mobility ratio is relatively high, it is more unfavorable to water plugging, as shown in Figure 12B.
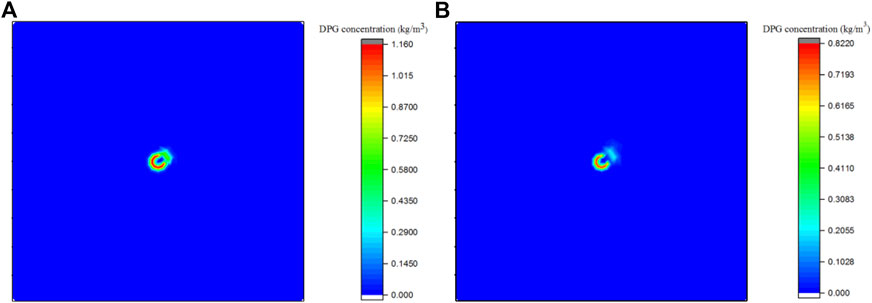
FIGURE 12. The distribution of DPG concentration comparison after 9 days: (A) When the mobility ratio is 24; (B) when the mobility ratio is 84.
5.3 Comparison between DPG profile control and polymer flooding
After a long time water flooding in mature oil fields, the reservoir has high permeable channels or fractures, and the injected water can easily enter into the producing well along high permeable regions, if we continue to apply water flooding treatment. In order to displace out remaining oil in low permeable regions, polymer flooding has been widely used in high water-cut oil fields. Polymer flooding does not significantly increase oil production when the permeability ratio of high permeability zones to low permeability zones increases. But the effect of DPG profile control becomes better, as the permeability ratio between high and low permeable regions increases. In order to clarify the difference between DPG profile control and polymer flooding in heterogeneous reservoirs, a series of geological models with the permeability ratios of 5, 10, 15, and 20 between high and low permeable regions are investigated. A 432 cubic DPG solution is injected with the concentration of 1.6 kg/m3, and then switch to water flooding for 3 days, afterwards shut down the wells for 7 days. After 15 days of DPG profile control, the reservoir begins to be injected with water for 240 days. The following operation of polymer flooding is the same as that of DPG profile control except displacement fluid, the comparison results are seen in Figure 13. From Figure 13A, the water-cut reduction effect of polymer flooding becomes worse, when the permeability ratio between high and low permeable regions increases. This is because that polymer is easier to channel into the production well along the high permeable zones, leading to less oil displaced out in low permeable areas, as the permeability ratio increases. In comparison with polymer flooding, there is more obvious water-cut reduction funnel for DPG profile control with the increase of permeability ratio. This is because polymer flooding cannot effectively plug water in high water cut areas when the permeability ratio increases. Cumulative oil production for polymer flooding will decrease by degrees as permeability ratio between high and low permeable areas increases. However, DPG profile control comes to the opposite conclusion in Figure 13B. So the DPG profile control is more suitable for heterogeneous reservoirs than polymer flooding.
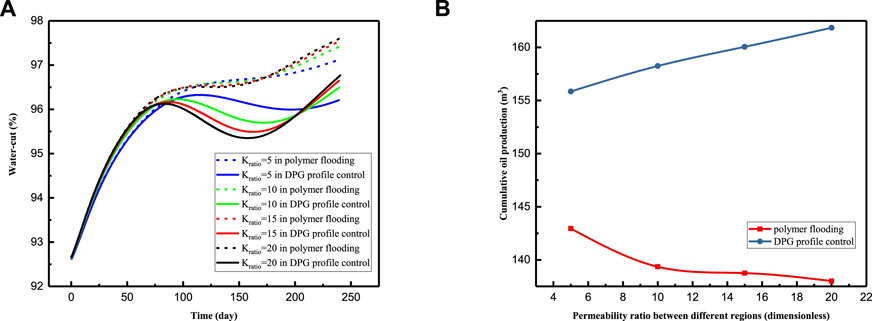
FIGURE 13. The comparison between polymer flooding and DPG profile control: (A) Water-cut comparison of production well 2; (B) cumulative oil production comparison of producing well.
5.4 The stability of the numerical simulation
The stability of the numerical simulation largely independent on the grids is very important. Therefore, it is necessary to investigate the impacts of the number of grids on numerical simulation results. After a long period of water flooding, a 432 cubic DPG solution is injected with water saturation of .8 in high permeable regions, and then switch to water flooding for 3 days, afterwards shut down the wells for 7 days, and the main numerical simulation parameters are the same as the sensitivity analysis example except for the number of grids. After 15 days of DPG profile control, the reservoir begins to be injected with water for 720 days, the results are shown in Figure 14. It can be seen from Figure 14 that the difference of calculated water cut in production well near high permeability areas under different grid numbers is in the range of permitted errors and does not affect the actual numerical simulation results.

FIGURE 14. Water-cut of producing well 2 under different number of grids.
6 Conclusion
This paper proposes a mathematical model of two-phase and three-component DPG conformance control considering DPG particles adsorbing on pore throat surface and weak shear thinning effect when entering into the reservoirs. The finite volume method based on unstructured PEBI grid is used to discretize the related equations, which are solved by fully implicit iteration technique. The viscosity of DPG, the concentration of DPG, the water saturation of high permeable regions, the permeability ratio between different regions and the mobility ratio between the high and low permeability zones are the key parameters which have significant impacts on profile control of DPG. Based on the numerical results, the main conclusions are summarized as follows:
(1) As DPG solution viscosity, DPG concentration and the permeability ratio between high and low permeable regions increase, both the width and depth of water-cut funnel increase and the effect of profile control becomes better. However, both the width and depth of water-cut funnel decrease with the increase of water saturation in high permeable regions.
(2) Considering injection well pressure, water-cut of producing well and cost of production, the effect of profile control is best when the viscosity of DPG is two times the viscosity of conventional polymer.
(3) In this case, the appropriate DPG concentration is 1.6 kg/m3, DPG profile control treatment is more suitable for highly heterogeneous reservoirs than polymer flooding. And the permeability ratio between high and low permeable regions should not exceed 25 in heterogeneous reservoirs when implementing DPG profile control.
(4) The mobility ratio between the high and low permeability zones has great influence on the water shutoff effect of DPG. As the mobility ratio increases, it is more unfavorable to water plugging in the high permeable regions.
Data availability statement
The original contributions presented in the study are included in the article/supplementary material, further inquiries can be directed to the corresponding author.
Author contributions
GS, derived the mathematical model, performed the calculation analysis, drafted and revised the manuscript; PL, revised the manuscript; DD and TS, participated the discussions; DL, contributed to the new idea of the study and approved the submission.
Funding
This work was supported by the National Science and Technology Major Project of China (Grant No. 2017ZX05009005-002).
Conflict of interest
DD and TS were employed by the company of Shengli Oilfield Kangbei Petroleum Engineering Equipment Co., Ltd.
The remaining authors declare that the research was conducted in the absence of any commercial or financial relationships that could be construed as a potential conflict of interest.
Publisher’s note
All claims expressed in this article are solely those of the authors and do not necessarily represent those of their affiliated organizations, or those of the publisher, the editors and the reviewers. Any product that may be evaluated in this article, or claim that may be made by its manufacturer, is not guaranteed or endorsed by the publisher.
References
Al-Muntasheri, G. A., Nasr-El-Din, H. A., and Hussein, I. A. (2007). A rheological investigation of a high temperature organic gel used for water shut-off treatments. J. Petroleum Sci. Eng. 59 (1), 73–83. doi:10.1016/j.petrol.2007.02.010
Bai, B., Li, L., Liu, Y., Liu, H., Wang, Z., and You, C. (2007a). Preformed particle gel for conformance control: Factors affecting its properties and applications. SPE Reserv. Eval. Eng. 10 (4), 415–422. doi:10.2118/89389-pa
Bai, B., Liu, Y., Coste, J.-P., and Li, L. (2007b). Preformed particle gel for conformance control: Transport mechanism through porous media. SPE Reserv. Eval. Eng. 10 (2), 176–184. doi:10.2118/89468-pa
Beverte, I. (2014). Determination of highly porous plastic foam structural characteristics by processing light microscopy images data. J. Appl. Polym. Sci. 131 (4), 39477. doi:10.1002/app.39477
Bybee, K. (2005). Rheology and transport in porous media of new water-shutoff/conformance-control microgels. J. Petroleum Technol. 57 (11), 71–72. doi:10.2118/1105-0071-jpt
Chauveteau, G., Omari, A., Tabary, R., Renard, M., Veerapen, J., and Rose, J. (2001). “New size-controlled microgels for oil production,” in Proceeding of the SPE International Symposium on Oilfield Chemistry, Houston, Texas, USA, February 2001.
Dabiri, A., and Honarvar, B. (2020). Synergic impacts of two non-ionic natural surfactants and low salinity water on interfacial tension reduction, wettability alteration and oil recovery: Experimental study on oil wet carbonate core samples. Nat. Resour. Res. 29 (6), 4003–4016. doi:10.1007/s11053-020-09657-9
Dai, C., Zhao, G., Zhao, M., and You, Q. (2012). Preparation of dispersed particle gel (DPG) through a simple high speed shearing method. Molecules 17 (12), 14484–14489. doi:10.3390/molecules171214484
Dai, C., Zhao, G., You, Q., and Zhao, M. (2014b). A study on environment-friendly polymer gel for water shut-off treatments in low-temperature reservoirs. J. Appl. Polym. Sci. 131 (8), 40154. doi:10.1002/app.40154
Dai, C., Zhao, G., You, Q., and Zhao, M. (2014a). The investigation of a new moderate water shutoff agent: Cationic polymer and anionic polymer. J. Appl. Polym. Sci. 131 (3), 39462. doi:10.1002/app.39462
Dai, C., Liu, Y., Zou, C., You, Q., Yang, S., Zhao, M., et al. (2017). Investigation on matching relationship between dispersed particle gel (DPG) and reservoir pore-throats for in-depth profile control. Fuel 207, 109–120. doi:10.1016/j.fuel.2017.06.076
Deolarte, C., Vasquez, J., Soriano, J., and Santillan, A. (2009). Successful combination of an organically crosslinked polymer system and a rigid-setting material for conformance control in Mexico. SPE Prod. Operations 24 (4), 522–529. doi:10.2118/112411-pa
Ji, S., Tian, C., Shi, C., Ye, J., Zhang, Z., and Fu, X. (2012). New understanding on water-oil displacement efficiency in a high water-cut stage. Petroleum Explor. Dev. 39 (3), 362–370. doi:10.1016/s1876-3804(12)60052-4
Ju, B., Qiu, X., Dai, S., Fan, T., Wu, H., and Wang, X. (2008). A study to prevent bottom water from coning in heavy-oil reservoirs: Design and simulation approaches. J. Energy Resour. Technol. 130 (3), 033102. doi:10.1115/1.2955560
Kazemi Nia Korrani, A., Sepehrnoori, K., and Delshad, M. (2015). Coupling IPhreeqc with UTCHEM to model reactive flow and transport. Comput. Geosciences 82, 152–169. doi:10.1016/j.cageo.2015.06.004
Li, D., Zha, W., Liu, S., Wang, L., and Lu, D. (2016). Pressure transient analysis of low permeability reservoir with pseudo threshold pressure gradient. J. Petroleum Sci. Eng. 147, 308–316. doi:10.1016/j.petrol.2016.05.036
Liu, Y., Dai, C., Wang, K., Zhao, M., Gao, M., Yang, Z., et al. (2016). Investigation on preparation and profile control mechanisms of the dispersed particle gels (DPG) formed from phenol–formaldehyde cross-linked polymer gel. Industrial Eng. Chem. Res. 55 (22), 6284–6292. doi:10.1021/acs.iecr.6b00055
McCool, C. S., Li, X., and Wilhite, G. P. (2009). Flow of a polyacrylamide/chromium acetate system in a long conduit. SPE J. 14 (1), 54–66. doi:10.2118/106059-pa
Moosavi, S. R., Wood, D. A., Ahmadi, M. A., and Choubineh, A. (2019). ANN-based prediction of laboratory-scale performance of CO2-foam flooding for improving oil recovery. Nat. Resour. Res. 28 (4), 1619–1637. doi:10.1007/s11053-019-09459-8
Moradi-Araghi, A. (2000). A review of thermally stable gels for fluid diversion in petroleum production. J. Petroleum Sci. Eng. 26 (1), 1–10. doi:10.1016/s0920-4105(00)00015-2
Perez, D., Fragachan, F. E., Barrera, A. R., and Feraud, J. P. (2001). Applications of polymer gel for establishing zonal isolations and water shutoff in carbonate formations. SPE Drill. Complet. 16 (3), 182–189. doi:10.2118/73196-pa
Qin, J. S., and Li, A. F. (2003). Physical properties of petroleum reservoir. Qingdao: China University of Petroleum Press. (in Chinese).
Seright, R. S., Lane, R. H., and Sydansk, R. D. (2003). A strategy for attacking excess water production. SPE Prod. Facil. 18 (3), 158–169. doi:10.2118/84966-pa
Wang, J., Liu, H., Wang, Z., Xu, J., and Yuan, D. (2013). Numerical simulation of preformed particle gel flooding for enhancing oil recovery. J. Petroleum Sci. Eng. 112, 248–257. doi:10.1016/j.petrol.2013.11.011
Wassmuth, F. R., Arnold, W., Green, K., and Cameron, N., 2007. Polymer flood application to improve heavy oil recovery at East Bodo. In: Proceeding of the Canadian International Petroleum Conference, Calgary, Alberta, Canada, June 2007.
You, Q., Tang, Y., Dai, C., Shuler, P., Lu, Z., and Zhao, F., 2011. Research on a new profile control agent: Dispersed particle gel. In: Proceeding of the SPE Enhanced Oil Recovery Conference, Kuala Lumpur, Malaysia, July 2011.
You, Q., Dai, C., Tang, Y., Guan, P., Zhao, G., and Zhao, F. (2013). Study on performance evaluation of dispersed particle gel for improved oil recovery. J. Energy Resour. Technol. 135 (4), 042903. doi:10.1115/1.4024119
You, Q., Tang, Y., Dai, C., Zhao, M., and Zhao, F. (2014). A study on the morphology of a dispersed particle gel used as a profile control agent for improved oil recovery. J. Chem. 2014, 1–9. doi:10.1155/2014/150256
Zaitoun, A., Tabary, R., Rousseau, D., Pichery, T. R., Nouyoux, S., Mallo, P., et al. 2007. Using microgels to shut off water in a gas storage well. In: Proceeding of the International Symposium on Oilfield Chemistry, Houston, Texas, USA, February-March 2007.
Zha, W., Li, D., Lu, Z., and Jia, B. (2018). An equivalent single-phase flow for oil-water two-phase flow and its potential application in well test. Adv. Geo-Energy Res. 2 (2), 218–227. doi:10.26804/ager.2018.02.09
Zhao, G., Dai, C., Zhao, M., You, Q., and Chen, A. (2013). Investigation of preparation and mechanisms of a dispersed particle gel formed from a polymer gel at room temperature. Plos One 8 (12), e82651. doi:10.1371/journal.pone.0082651
Keywords: dispersed particle gel, in-depth profile control, numerical simulation, heterogeneous reservoirs, a new agent
Citation: Sun G, Li P, Du D, Song T and Lu D (2023) Numerical simulation of in-depth profile control for dispersed particle gel in heterogeneous reservoirs. Front. Energy Res. 11:1106191. doi: 10.3389/fenrg.2023.1106191
Received: 23 November 2022; Accepted: 18 January 2023;
Published: 26 January 2023.
Edited by:
Fuyong Wang, China University of Petroleum, Beijing, ChinaReviewed by:
Wenchao Liu, University of Science and Technology Beijing, ChinaJunjian Li, China University of Petroleum, Beijing, China
Copyright © 2023 Sun, Li, Du, Song and Lu. This is an open-access article distributed under the terms of the Creative Commons Attribution License (CC BY). The use, distribution or reproduction in other forums is permitted, provided the original author(s) and the copyright owner(s) are credited and that the original publication in this journal is cited, in accordance with accepted academic practice. No use, distribution or reproduction is permitted which does not comply with these terms.
*Correspondence: Detang Lu, ZHRsdUB1c3RjLmVkdS5jbg==