 Jiejie Dai
 Jing Xie*
- State Grid Shanghai Shinan Electric Power Supply Company, Shanghai, China
Non-intrusive load monitoring (NILM) is one of the important technologies in home energy management and power demand response scenario. However, the presence of multi-mode appliances and appliances with close power values have affected in diminishing the accuracy of identification based NILM algorithms. To tackle these challenges, the work proposes a resident load decomposition method combining multi-scale attention mechanism and convolutional neural network. At the first stage, the attention scores of the normal load data at the previous few moments of the attention model are smoothed dynamically against the abnormal scores at the current moment. The load identification attention model is optimized by constraint factors. Then, on this basis, convolution filters of different sizes are used to model the mixed load data of different electrical equipment, to mine more abundant characteristic information. Finally, to illustrate the proposed processes and validate its effectiveness, taking the PLAID data set as an example, the method proposed in the article is compared with respect to the existing NILM techniques. The experimental results show that the method based on the multi-scale attention mechanism in this paper can greatly improve the effect of load decomposition. Moreover, it reduces the confusion problem of electrical appliance identification with similar load characteristics.
1 Introduction
With the expansion of smart energy service scenarios on the customer side, load monitoring of resident has become a key factor in interactive energy use and demand response (Afrasiabi et al., 2020). Relying on load monitoring, the energy consumption details of various electrical loads of users can be unearthed. Furthermore, it can realize the understanding of user energy needs to stimulate the value creation and improvement of customer-side electricity data.
1.1 Related work
NILM was first proposed by Harts more than 30 years ago (Hart, 1992). Compared with “near-load” installation of sensing equipment for the intrusive load monitoring (ILM) technology, NILM only needs to measure and analyze the voltage, current and other information at the entrance of the power load. Various load categories, harmonics, energy consumption and other load characteristics within the user can be obtained (Wittmann et al., 2018). At present, NILM has become a key technology to realize the Energy-Internet. It has received widespread attention from researchers in related fields.
NILM performance indicators were divided into two categories. They were about indicators on event detection and indicators on electrical power consumption (power estimation). Low-frequency loads used the steady-state characteristics of electrical appliances, based on their own unique operating mode. Low-frequency data need observe the complete operating cycle. More households or more appliances were needed to train the generalization ability of the model. With the advancement of sensing technology and storage technology, high-frequency load data can be obtained. Some researchers used the idea of distinguishing power load events to identify the start-stop state of electrical appliances (Azizi et al., 2020). The power consumption of electrical appliances was further estimated by the state. The more representative algorithms were hidden Markov and its variants (Kim et al., 2011; Kolter and Jaakkola, 2012; Wu et al., 2021). (Makonin et al., 2016) used the hidden Markov model (HMM) to decompose low-frequency load data into state encoding and decoding problems. In (Kong et al., 2018), a NILM solution based on segmented integer quadratic constrained planning was studied. The work proposed an efficient solving algorithm using the improved HMM. To consider the impact of multi-feature fusion, the V-I trajectory was studied to be a distinct load feature and demonstrated to be with efficient identification (Hassan et al., 2014).
With the development of machine learning, various optimizations based NILM approaches have been proposed (Monteiro et al., 2021). Especially with the successful exploration and practice of deep learning in the field of speech recognition (Wu et al., 2017; Cui et al., 2020), researchers have introduced it into NILM and achieved some results (Kelly and Knottenbelt, 2015). By using automatic encoder architecture to treat the NILM task as a noise reduction problem (Bonfigli et al., 2018), the robustness of decomposition in the presence of noise was improved. By data mining algorithms, such as convolutional neural networks (CNN), (Xiang et al., 2022), got rid of the shackles of power load event monitoring. The work directly extracted a unique load characteristic map to achieve fast and effective load resolution. (Zhang et al., 2018; D’Incecco et al., 2020). proposed a migration learning method that aggregated time series to points. It combined deep neural networks to predict the power consumption of equipment at a certain point/period of time. The existing research has achieved great satisfaction in the academic aspects. However, due to the limitations, such as the measurement accuracy of the NILM data and the accuracy and efficiency of the algorithms, it still need continue to improve for practical application.
1.2 Contributions
In response to above analysis, this paper tries to address the application gap with following solutions. Finally, the proposed method is applied for a United Kingdom household. Specifically, following contributions are highlighted.
• The paper proposes a resident load decomposition method based on multi-scale attention mechanism and CNN. This work introduces constraints to optimize the attention model. It smooths out the abnormal scores that may be generated by the attention model at the current moment.
• A load decomposition model with dynamic smooth constraints is constructed. In this way, the extraction and attention to the key characteristics of the load can be realized. On this basis, in order to mine richer load characteristic information, convolution filters of different sizes are used to model the mixed and superimposed load data of various electrical appliances at multiple scales.
• The proposed model and approach are verified by both PLAID (Gao et al., 2014) dataset and UK-DALE dataset from different countries, proving the effectiveness of feature utilization and achieving remarkable NILM decomposition accuracy.
2 Related technologies
2.1 NILM system
NILM collects information such as current, voltage, and power at the entrance of the power supply. Through the analysis of the electricity consumption information, the operation of each load in the electricity consumption network can be learned. In order to obtain the modeling of household electrical equipment, it usually involves the collection and processing of data. It also includes the process of extracting information about the characteristics of different types of events and the identification of load characteristics. Finally, the output results are used for specific business applications. The schematic diagram of its structure is shown in Figure 1. Household smart meter is a relatively basic type of metering device. Usually, the accuracy of household electrical energy measurement is Level 1 (the measurement error does not exceed ±1%).
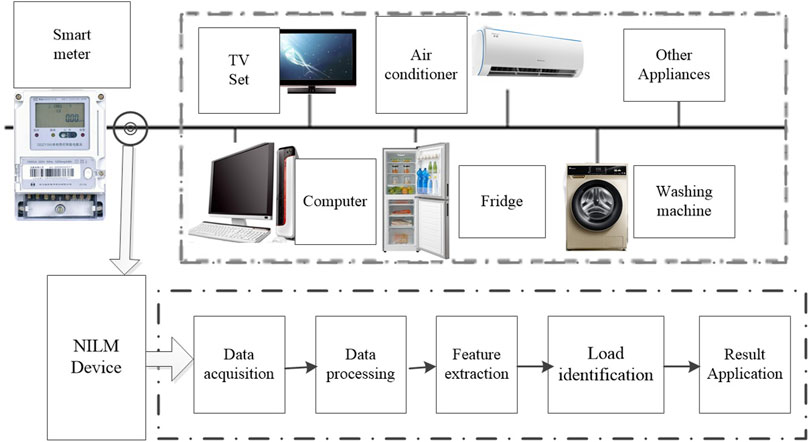
FIGURE 1. The schematic diagram of non-intrusive monitoring system.
2.2 Theoretical basis of attention mechanism
The attention mechanism (T Luong et al., 2015) filters out key areas by quickly scanning global information. Then these focused areas are invested in more attention resources. This allows a larger weight to be allocated to pay attention to the details of the target, while weakening other useless information. At present, the attention mechanism (AM) has gradually developed into one of the hottest core technologies in deep learning tasks.
In the recognition detection task, the model based on the AM converts the input sequence
The encoding process is as follows. The input feature sequence X is encoded into vectors H suitable for the AM.
where f (∙) is the encoding calculation. H∈ℝd is the encoded output. d is the encoded output dimension. hi is the encoded output sequence at the ith time.
The AM process is as follows. Attention score aj at j moment is determined by the encoder, j−1 moment decoding and j−1 moment attention score.
where A is the attention calculation part. sj−1 is the decoder state at the time of j−1. aj−1 is the attention score of j−1 moment.
The integration of aj and H further obtains the new input vector tj of the decoder.
The decoding process is as follows. tj, sj−1 and oj−1 are obtained by decoding and output oj at the time of j.
where g (∙) is the decoding calculation. oj∈ℝz is the output sequence at time j. z is the output dimension.
3 Non-intrusive load decomposition method
Electrical appliances with different working principles, such as rotating motors, heater, electronic frequency conversion equipment, etc., have different current and voltage characteristics. Moreover, the high-frequency data contains richer and easy-to-identify high-overlap load characteristics. Therefore, in this work, the high-frequency current and voltage sampling data of the appliances are used as a unity to form a two-dimensional image. The CNN is further used to mine the correlation between composite images and power characteristics. The use of AM can focus on key areas in the image to improve the accuracy of NILM recognition.
3.1 Convolutional neural network based on attention mechanism
In the AM part, the CNN is used to manipulate the attention scores of the current and voltage images at the previous time (that is the j−1 time) to obtain lj.
where F is the convolution window, and its size is k. * represents the convolution calculation.
Use lj, sj−1, and hi to calculate the score ei,j corresponding to the ith frame at time j.
where vT is the transpose of the offset of the AM. The matrices W, V, and U represent the weights of decoding, feature vectors, and attention scores after convolution operations, b stands for bias.
The calculation results of Eq. 6 are normalized to facilitate the output of load identification.
where,
From the above, it can be seen that when calculating the attention score, there are no constraints in the process. There is a greater probability of outlier values in the attention score. The load that is focused on at adjacent times has a large deviation. It affects the accuracy of load decomposition.
In order to solve the problem of abnormal attention scores, a multi-scale attention model is proposed in this paper. Firstly, the normal attention score of the first r moments is used to constrain the score of the current moment. The attention score
where
In order to coordinate the degree of
where uj is the result of the calculations of sj−1, tj−1, and yj−1. Φ is a shallow neural network model with an output activation function of Sigmoid.
The first r attention scores are smoothed by the weight coefficient constraints of Eq. 9 to obtain a new attention score.
Finally, the Eq. 7 is used to normalize the result of Eq. 10.
3.2 Non-intrusive load decomposition model of multi-scale attention mechanism
In order to consider the modeling of appliances of different load, the work uses convolution cores of different scales for the two-dimensional images of current and voltage to operate.
The difference between Eqs. 5, 11 is that the convolution part of Eq. 11 uses M filters of different sizes. This represents sliding windows of different sizes. It guarantees the effective segmentation of load data of different sizes.
In the model of multi-scale attention mechanism (MSAM), the result calculated by Eq. 11 is dynamically smoothed by Eq. 10. Then the target vectors tm, j of different appliances models are obtained from Eq. 3. For M different target vectors, shallow neural networks are used to integrate and stitch. From this, a target vector
The non-intrusive load decomposition model based on MSAM is shown in Figure 2.
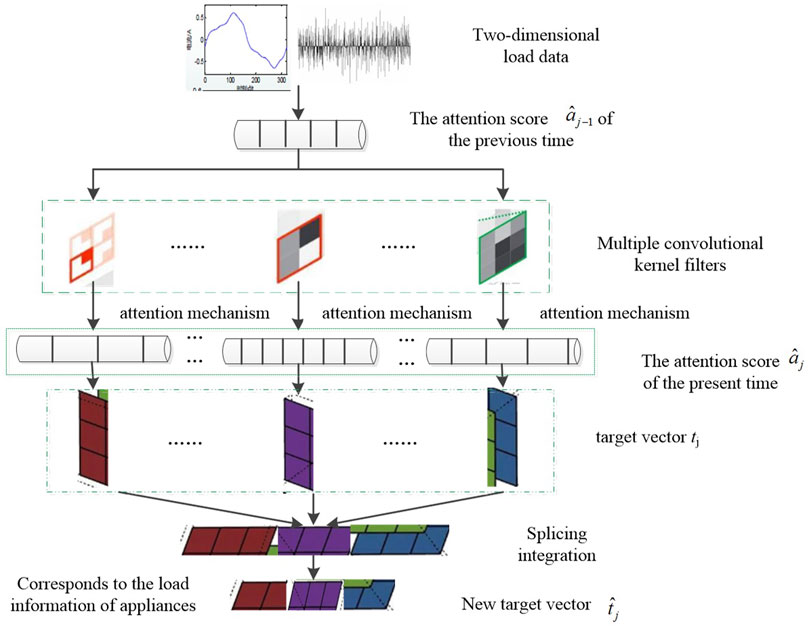
FIGURE 2. Non-intrusive load decomposition model of resident by MSAM.
The basic steps are as follows.
1) A two-dimensional image composed of high-frequency sampling data of current and voltage is used as input.
2) The two-dimensional image data is processed to obtain the attention score of the previous time. The area of attention of the previous time is obtained.
3) Multiple convolutional kernel filters of different sizes are used to obtain the current moment attention score and construct load models of different sizes.
4) Multiple scores after convolution are dynamically smoothed. The abnormal score is eliminated and the initial target vector is obtained.
5) Multiple different target vectors are integrated and spliced. A new target vector corresponding to the load of different appliances is obtained, which is the load decomposition result.
4 Case study
4.1 PLAID dataset
In order to fully verify the feasibility and accuracy of the above algorithm, the work uses the PLAID dataset for computational analysis. The PLAID dataset (Gao et al., 2014) includes current and voltage results sampled at a frequency of 30 kHz for 11 different types of appliances in more than 56 households in Pittsburgh, Pennsylvania, United States of America. Each set of samples contains process data for transient and steady-state operation of the equipment. Each type is represented by dozens of examples of different brands/models. These categories correspond to 11 different types of electrical appliances: air conditioners (AC), compact fluorescent lamp (CFL), fridge, hairdryer, laptop, microwave, washing machines, bulbs, vacuum, fan, and heater.
The dataset consists of a total of 1,094 samples. The training and testing models of 11 types of electrical appliance samples are randomly constructed in a 7:3 ratio. The specific distribution of sample data is shown in Table 1. At the same time, for the convenience of the following, the above-mentioned appliance types are numbered in the order of 1–11.
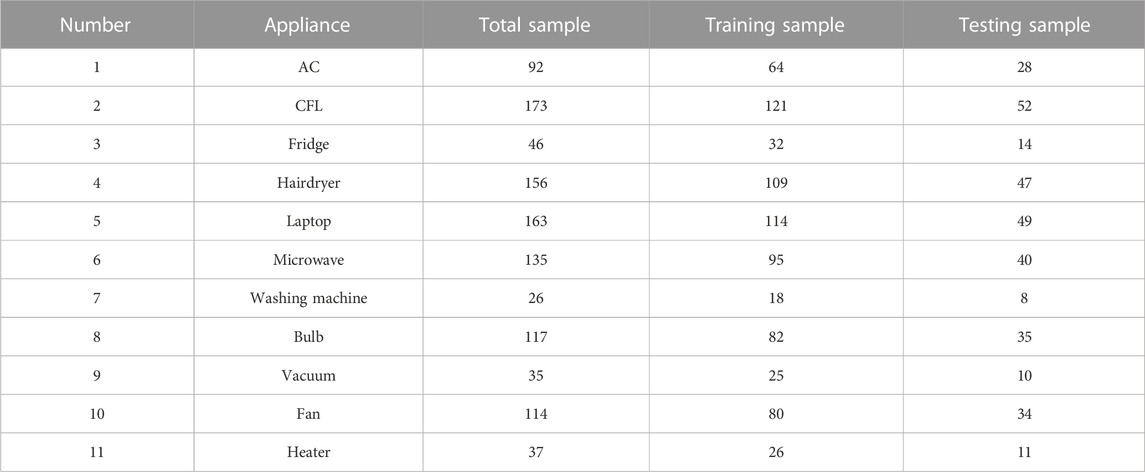
TABLE 1. Distribution of the samples.
4.2 Two-dimensional visualization of current and voltage
In order to extract the two-dimensional characteristics, the work adopts the voltage and current waveforms that are steady-state before and after the load switching moment. Firstly, they are represented by voff, von, ioff, and ion respectively. Then they are segmented. In order to ensure the separation of voltage and current in the time domain, the same initial phase angle must be guaranteed. In this paper, the fast Fourier transform is used to calculate the phase angle of the basic voltage. The sampling point with a phase angle of zero is used as the initial sampling point (Wang et al., 2018).
Finally, the voltage and current of appliance can be expressed as v = (voff + von)/2 and i = (ioff − ion) respectively. The two-dimensional images of current and voltage can be regarded as load characteristics in incremental form. It takes advantage of the difference between two consecutive samples. Moreover, it satisfies the characteristic addition term (Liang et al., 2010). The specific method of two-dimensional graphical acquisition can refer to (Wang et al., 2021; Xiang et al., 2022). Figure 3 shows a typical voltage-current image of fridge and air conditioner respectively.
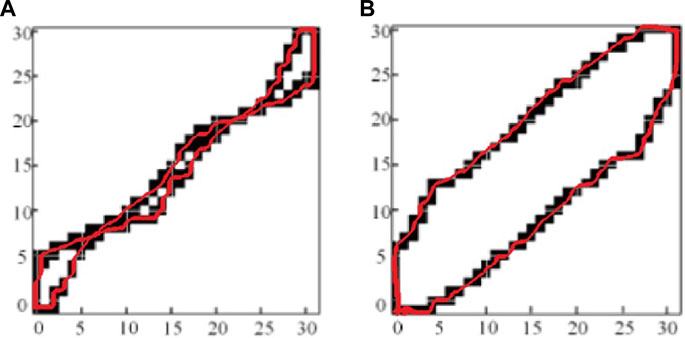
FIGURE 3. Typical voltage-current image of common household appliances. (A) Fridge; (B) Air conditioner.
4.3 Evaluation criteria
Due to the imbalance between samples, the F-measure is used to evaluate the classification performance (Makonin and Popowich, 2015). This is done for each appliance type separately. The true positives (TP), false positives (FP) and false negatives (FN) of appliance, are summed for each testing set. In the end, the average of all the F-a is taken, leading to the so-called F-m.
where TP represents the number of true values that are positive and predicted values that are positive. FP represents the number of true values that are negative and predicted values that are positive. FN represents the number of true values that are positive and predicted values that are negative. pr is the accuracy rate. re is the recall rate. The value range of the metric F-a is 0–1 (if converted to %, it is 0–100). 1 (100) represents the best output of the model. 0 means that the output result of the model is the worst. A is the number of all electrical appliance types. A is 11 in the text.
4.4 Model parameters setting
In the encoding part of the AM model, a 3-layer Bi-directional long-short term memory (BLSTM) network is used. There are 900 neurons in each layer. The decoding part is one layer long-short term memory (LSTM) network. The number of neurons is 400. The activation function is RELU (rectified linear unit, ReLU) function. In the MSAM, the number of neurons in the hidden layer of the neural network model is 2048. The activation function is Sigmoid. When calculating the attention score, after experimental comparison, the constraints of
The MSAM uses four convolution filters. The convolution window sizes are 30, 60, 120, and 240 respectively. At the same time, in order to facilitate the verification of the results, the method proposed in this paper is compared with HMM, clustering model, V-I trajectory model, CNN model.
5 Results analysis
The NILM decomposition model of the MSAM in this paper and the recognition results of several other methods on the training set are shown in Figure 4. Figures 4A–E represent the identification results of SMAM, HMM, clustering, V-I trajectory, and CNN respectively. In Figure 4, the numbers 1–11 correspond to the 11 kinds of electrical appliances in Table 1.
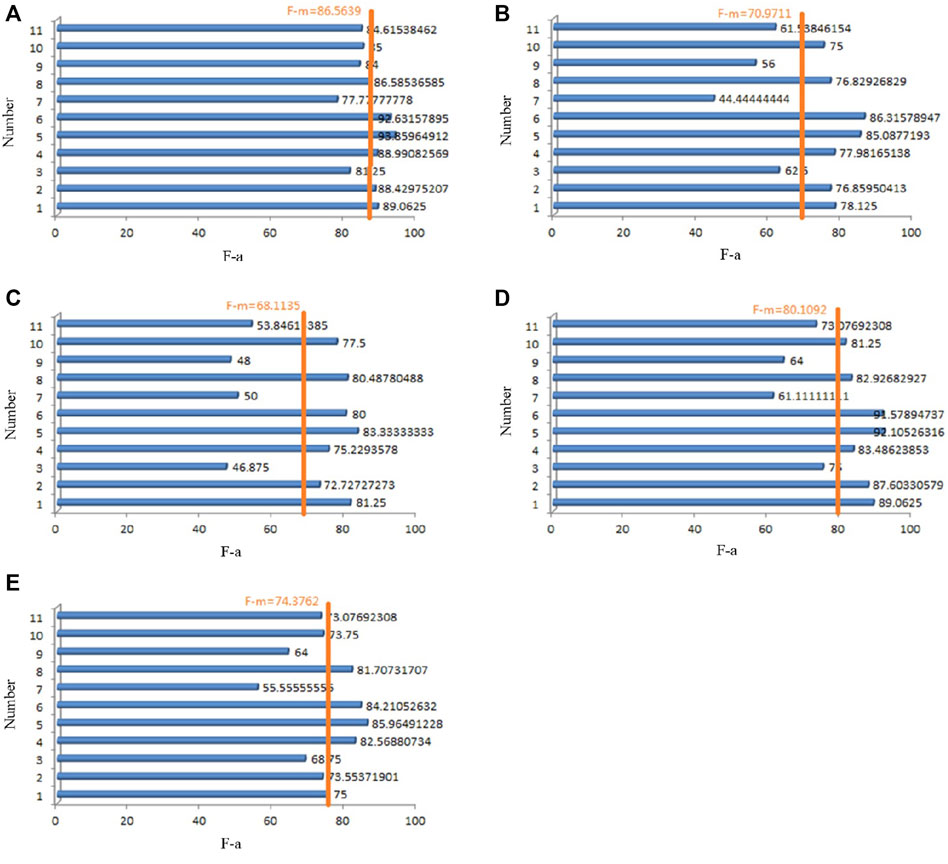
FIGURE 4. Identification results of different algorithms in the training set. (A) MSAM; (B) HMM; (C) Clustering; (D) V-I trajectory; (E) CNN.
As can be seen, the F-m values of the MSAM, the HMM, the clustering, the V-I trajectory, and the CNN are 86.57%, 70.97%, 68.11%, 80.11%, and 74.38%. In addition, for the F-a of each appliance, it can be seen from Figure 4A that the identification result for the washing machine (77.78%) is significantly lower than the F-m. The results for other appliances are close to or significantly higher than F-m. However, the decomposition accuracies of washing machine in other models are only 40%–65%. The identification effect of fridge, vacuum, and heater is not very good. From the distribution in Table 1 Distribution of the samples, it can be inferred that in the case of small samples, the MSAM mentioned in this paper can focus on its load characteristics. By paying attention to the key information of the load, the recognition effect can be improved to a certain extent.
The constructed decomposition models are verified through the testing dataset. Their confusion matrixes are shown in Figure 5. In confusion matrix, the larger the value on the diagonal is, the more the predicted value matches the actual type. Therefore, the better the recognition effect is. From studying Figure 5, it can be seen that the MSAM has the best recognition effect. There are fewer types that are easily confused. It can be shown from the distribution of the identification results that compared with the other methods mentioned in this article, the accuracies of washing machine, fridge, vacuum and heater in other types of models are lower. They are easier to confuse with each other. Because the working principle of these four types appliance is similar to that of the motor. The power load characteristics are not easy to distinguish. So, their identification effect is not ideal.
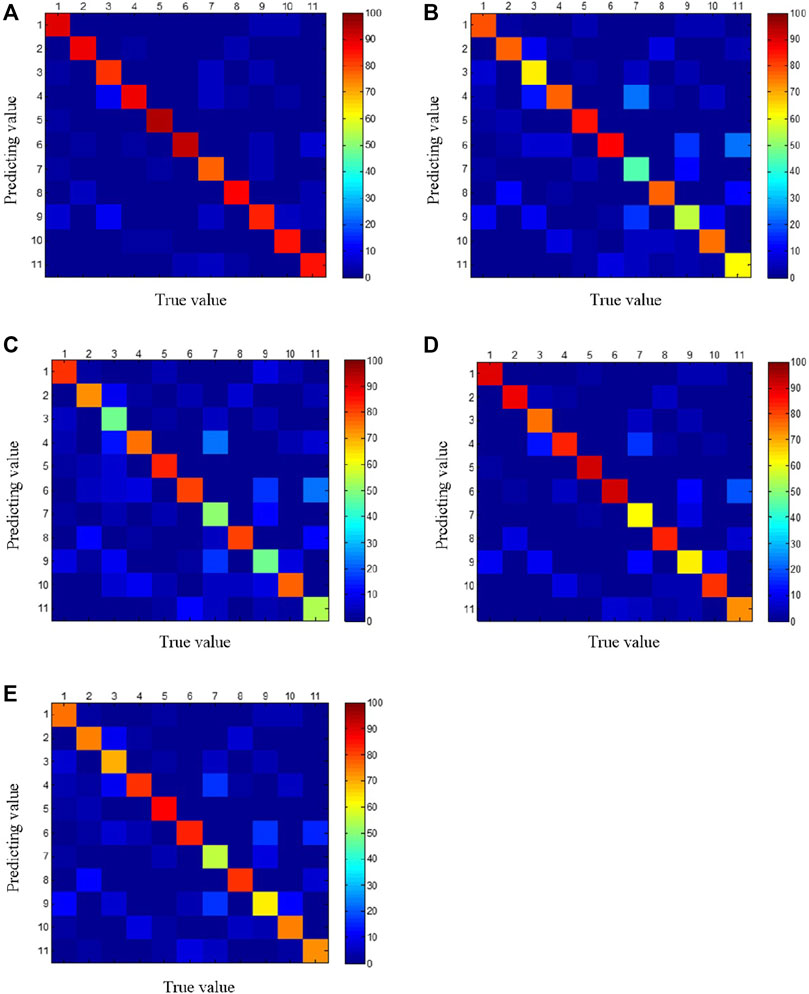
FIGURE 5. Identification confusion matrix of different algorithms in the testing set. (A) MSAM; (B) HMM; (C) Clustering; (D) V-I trajectory; (E) CNN.
Finally, the MSAM is compared with the ordinary AM model. The work focuses on the identification effects of washing machine, fridge, vacuum and heater (as shown in Table 2).
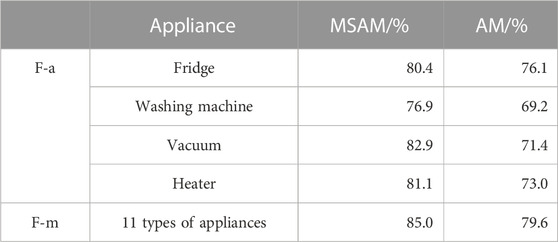
TABLE 2. Identification effect of different attention mechanisms.
With the dynamic adjustment of the filter size, the characteristic extraction of voltage and current by the proposed model is gradually refined. The extracted power characteristics are enriched. Therefore, the effect of recognition has also been greatly improved. Compared with the traditional AM model, the F-m value of the method proposed in this article has increased by 5.4%.
6 Application for UK-DALE Dataset House 1
To further validate the advantages of our method, we apply it to the UK-DALE dataset. The UK-DALE dataset consists of load monitoring data from five United Kingdom households. The load data of House 1 contains 16 kHz current and voltage sampling values. Among them, the data from December 2012 to March 2014 are used to construct the model to get the decomposition parameters. The results of the decomposition identification of fridge freezer, kettle, Toaster, vacuum cleaner, CRT TV, oven, and Laptop computer loads from April 2014 to December 2014 are as shown in Figure 6. In addition, we calculated the Kappa coefficient to measure the effectiveness of the classification in Table 3. The higher the value of this coefficient, the higher the classification accuracy achieved by the model. kappa coefficient can be expressed in this way.
Where, po= (Sum of diagonal elements)/(Sum of all elements in the entire matrix). pe = [Σi(sum of the elements in Line i)*(sum of the elements in Column i)]/(Σ all the elements of the entire matrix)2.
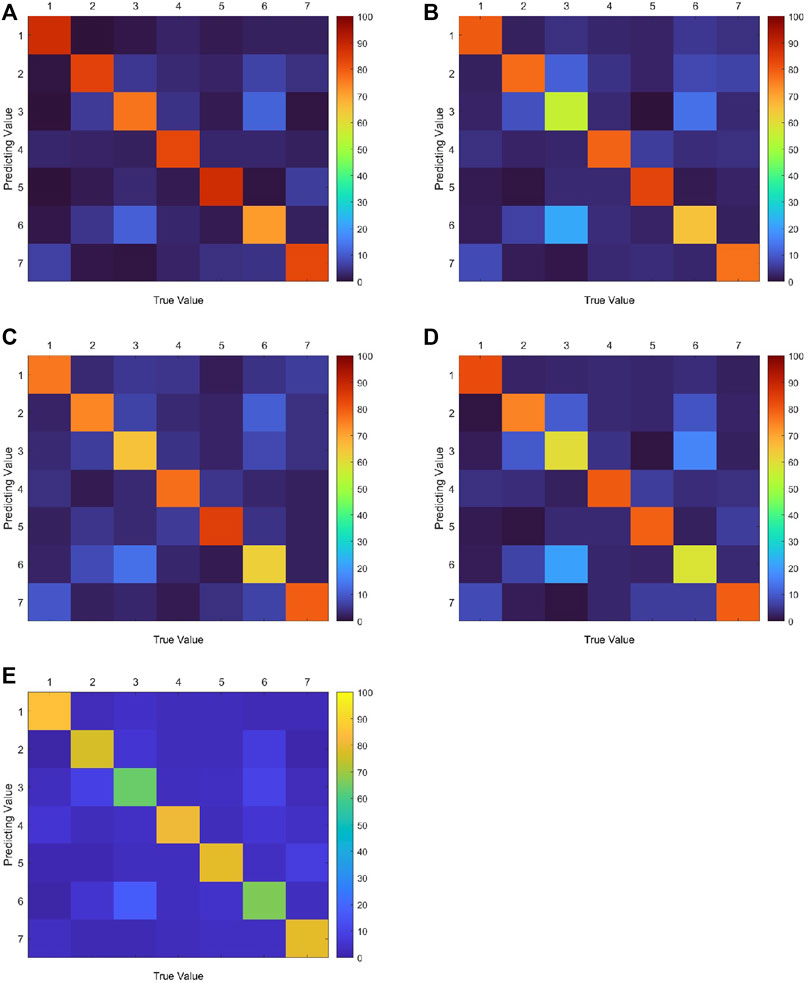
FIGURE 6. Identification results of different algorithms for the UK-DALE Dataset House 1. (A) MSAM; (B) HMM; (C) Clustering; (D) V-I trajectory; (E) CNN.
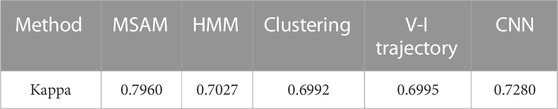
TABLE 3. Kappa statistics measure of different methods.
From the results, MSAM method of load decomposition for House 1 has a high degree of consistency with the actual situation.
7 Conclusion
In view of the low accuracy of NILM, this paper proposes a CNN load decomposition method based on MSAM. The problem of abnormal attention scoring in the traditional AM is analyzed. By introducing constraints, the attention score of the previous moment is dynamically smoothed. The adaptive optimization of the model is realized. The high-frequency current and voltage sampling data of appliance are used as a unity to form a two-dimensional image. The NILM data is modeled by using convolution filters of different sizes to explore the correlation between the composite image and the power characteristics. Under the AM, the model automatically pays attention to the key information of different appliance power load data. By comparing the decomposition recognition capabilities of different algorithms, it is verified that the recognition effect of the algorithms mentioned in this paper is better. Especially for the types of electrical appliances with smaller samples, the recognition effect of the proposed algorithm has also been significantly improved. The next research focus is to ensure the accuracy of NILM decomposition and further improve the efficiency of the algorithm model. At the same time, the feasibility of this model in the identification of low-frequency power data will be actively explored.
Data availability statement
Publicly available datasets were analyzed in this study. This data can be found here: https://figshare.com/articles/dataset/PLAID_2014/11605074.
Author contributions
Formal analysis is done by JX. Methodology is done by JD and HL. Software is done by YM and SL. Supervision is done by BW and CH. Validation is done by HL and SL. Writing-original draft is done by JD. Writing-review and editing is done by CH and JX.
Conflict of interest
JD, JX, CH, BW, HL, YM, and SL were employed by the company State Grid Shanghai Shinan Electric Power Supply Company.
Publisher’s note
All claims expressed in this article are solely those of the authors and do not necessarily represent those of their affiliated organizations, or those of the publisher, the editors and the reviewers. Any product that may be evaluated in this article, or claim that may be made by its manufacturer, is not guaranteed or endorsed by the publisher.
References
Afrasiabi, M., Mohammadi, M., Rastegar, M., Stankovic, L., Afrasiabi, S., and Khazaei, M. (2020). Deep-based conditional probability density function forecasting of residential loads. IEEE Trans. Smart Grid 11 (4), 3646–3657. doi:10.1109/TSG.2020.2972513
Azizi, E., M Shotorbani, A., Beheshti, M. T., Mohammadi-Ivatloo, B., and Bolouki, S. (2020). Residential household non-intrusive load monitoring via smart event-based optimization. IEEE Trans. Consum. Electron. 66 (3), 233–241. doi:10.1109/TCE.2020.3008261
Bonfigli, R., Felicetti, A., Principi, E., Fagiani, M., Squartini, S., and Piazza, F. (2018). Denoising autoencoders for non-intrusive load monitoring: Improvements and comparative evaluation: Improvements and comparative evaluation. Energy Build. 158, 1461–1474. doi:10.1016/j.enbuild.2017.11.054
Cui, X., Zhang, W., Finkler, U., Saon, G., Picheny, M., and Kung, D. (2020). Distributed training of deep neural network acoustic models for automatic speech recognition: A comparison of current training strategies. IEEE Signal Process. Mag. 37 (3), 39–49. doi:10.1109/MSP.2020.2969859
D’Incecco, M., Squartini, S., and Zhong, M. (2020). Transfer learning for non-intrusive load monitoring. IEEE Trans. Smart Grid 11 (2), 1419–1429. doi:10.1109/TSG.2019.2938068
Gao, J. K., Giri, S., Kara, E. C., and Berges, M. (2014). “Plaid: A public dataset of high-resoultion electrical appliance measurements for load identification research: Demo abstract,” in Proceedings of the 1st ACM conference on Embedded Systems for Energy-Efficient Buildings, Memphis, November 2014 (ACM), 198–199. doi:10.1145/2674061.2675032
Hart, G. W. (1992). Nonintrusive appliance load monitoring. Proc. IEEE 80 (12), 1870–1891. doi:10.1109/5.192069
Hassan, T., Javed, F., and Arshad, N. (2014). An empirical investigation of V-I trajectory based load signatures for non-intrusive load monitoring. IEEE Trans. Smart Grid 5 (2), 870–878. doi:10.1109/TSG.2013.2271282
Kelly, J., and Knottenbelt, W. (2015). “Neural NILM: Deep neural networks applied to energy disaggregation,” in Proceedings of the 2nd ACM International Conference on Embedded Systems for Energy-Efficient Built Environments, Seoul, November 2015 (ACM), 55–64. doi:10.1145/2821650.2821672
Kim, H., Marwah, M., Arlitt, M. F., Lyon, G., and Han, J. (2011). “Unsupervised disaggregation of low frequency power measurements,” in Proceedings of the 11th SIAM International Conference on Data Mining, Mesa, Arizona, USA, April 2011 (SDM), 747–758. doi:10.1137/1.9781611972818.64
Kolter, J. Z., and Jaakkola, T. (2012). Approximate inference in additive factorial HMMs with application to energy disaggregation. J. Mach. Learn. Res. 22, 1472–1482.
Kong, W., Dong, Z. Y., Ma, J., Hill, D. J., Zhao, J., and Luo, F. (2018). An extensible approach for non-intrusive load disaggregation with smart meter data. IEEE Trans. Smart Grid 9 (4), 3362–3372. doi:10.1109/TSG.2016.2631238
Liang, J., Ng, S. K. K., Kendall, G., and Cheng, J. W. M. (2010). Load signature Study—Part I: Basic concept, structure, and methodology. IEEE Trans. Power Deliv. 25 (2), 551–560. doi:10.1109/TPWRD.2009.2033799
Makonin, S., Popowich, F., Bajić, I. V., Gill, B., and Bartram, L. (2016). Exploiting HMM sparsity to perform online real-time nonintrusive load monitoring. IEEE Trans. Smart Grid 7 (6), 2575–2585. doi:10.1109/TSG.2015.2494592
Makonin, S., and Popowich, F. (2015). Nonintrusive load monitoring (NILM) performance evaluation. Energy Effic. 8, 809–814. doi:10.1007/s12053-014-9306-2
Monteiro, R., de Santana, J., Teixeira, R., Bretas, A., Aguiar, R., and Poma, C. (2021). Nonintrusive load monitoring using artificial intelligence classifiers: Performance analysis of machine learning techniques. Electr. Power Syst. Res. 198, 107347. doi:10.1016/j.epsr.2021.107347
T Luong, M., Pham, H., and Manningc, D. M. (2015). “Effective approaches to attention-based neural machine translation,” in Proceedings of the 2015 Conference on Empirical Methods in Natural Language Processing, Lisbon, September 2015 (ACL), 1412–1421. doi:10.48550/arXiv.1508.04025
Wang, A., Chen, B., Wang, C. G., and Hua, D. D. (2018). Non-intrusive load monitoring algorithm based on features of V-I trajectory. Electr. Power Syst. Res. 157, 134–144. doi:10.1016/j.epsr.2017.12.012
Wang, S. X., Chen, H. W., Guo, L. Y., and Xu, D. (2021). Non-intrusive load identification based on the improved voltage-current trajectory with discrete color encoding background and deep-forest classifier. Energy Build. 244, 111043. doi:10.1016/j.enbuild.2021.111043
Wittmann, F., López, J., and Rider, M. (2018). Nonintrusive load monitoring algorithm using mixed-integer linear programming. IEEE Trans. Consum. Electron. 64 (2), 180–187. doi:10.1109/TCE.2018.2843292
Wu, B., Li, K. H., Ge, F. P., Huang, Z., Yang, M. L., Siniscalchi, S. M., et al. (2017). An end-to-end deep learning approach to simultaneous speech dereverberation and acoustic modeling for robust speech recognition. IEEE J. Sel. Top. Signal Process. 11 (8), 1289–1300. doi:10.1109/JSTSP.2017.2756439
Wu, Z., Wang, C., Zhang, H., Peng, W., and Liu, W. (2021). A Time-efficient factorial hidden semi-Markov model for non-intrusive load monitoring. Electr. Power Syst. Res. 199, 107372. doi:10.1016/j.epsr.2021.107372
Xiang, Y. Z., Ding, Y. F., Luo, Q., Wang, P., Li, Q., Liu, H., et al. (2022). Non-invasive load identification algorithm based on color coding and feature fusion of power and current. Front. Energy Res. 10, 899669. doi:10.3389/fenrg.2022.899669
Keywords: non-intrusive load monitoring, load decomposition, multi-scale, attention mechanism, smooth dynamically
Citation: Dai J, Xie J, Huang C, Wu B, Li H, Ma Y and Li S (2023) A non-intrusive load decomposition method of resident by multi-scale attention mechanism. Front. Energy Res. 11:1091131. doi: 10.3389/fenrg.2023.1091131
Received: 06 November 2022; Accepted: 15 February 2023;
Published: 27 February 2023.
Edited by:
Fei Wang, Shanghai University, ChinaReviewed by:
Veerapandiyan Veerasamy, Nanyang Technological University, SingaporeLijun Zhang, University of Lisbon, Portugal
Copyright © 2023 Dai, Xie, Huang, Wu, Li, Ma and Li. This is an open-access article distributed under the terms of the Creative Commons Attribution License (CC BY). The use, distribution or reproduction in other forums is permitted, provided the original author(s) and the copyright owner(s) are credited and that the original publication in this journal is cited, in accordance with accepted academic practice. No use, distribution or reproduction is permitted which does not comply with these terms.
*Correspondence: Jing Xie, SmluZ3hpZTE5OTJAMTYzLmNvbQ==