 Seyedeh Hosna Talebian
 Amir Jahanbakhsh
 M. Mercedes Maroto-Valer
- 1Department of Chemical and Petroleum Engineering, Ilam University, Ilam, Iran
- 2Research Centre for Carbon Solutions, School of Engineering and Physical Sciences, Heriot-Watt University, Edinburgh, United Kingdom
- 3Industrial Decarbonisation Research and Innovation Centre (IDRIC), Heriot-Watt University, Edinburgh, United Kingdom
In the path to a net-zero carbon and energy transition from fossil fuel, the world is facing a dilemma of growing global energy demand and required actions on climate-related risks. While over 80% of the current global energy needs are supplied by fossil fuels, the number of carbon capture, utilization and storage (CCUS) projects is limited in this sector. There is a huge gap between the scale and distribution of ongoing CCUS projects and the carbon intensity (CI) of energy-intensive industries. Furthermore, the climate impact of growing reliance on unconventional resources (Tar sands and shales) as well as the depletion of conventional resources poses challenges to the oil and gas sector to meet energy demand, while limiting their greenhouse gas (GHG) emissions. On the other hand, the economic viability of CCUS projects is highly sensitive to carbon credits policies, which are not yet fully integrated in a way to fill the current gap in the number, scale and distribution of these projects. Moreover, there is limited consistency between the allocated decarbonization funds and the anticipated economic growth of fossil fuel economies to promote wide-scale global resilience to carbon exposure. Therefore, it is essential to take climate-related risks, including socioeconomic impacts, into consideration for the decision-making process of companies and governments to embrace low-carbon energy. The focus of this article is on carbon resilience calibration and emissions scenario analysis in investment decisions to realize decarbonization goals through balancing short-term actions with long-term energy transition plans. The challenges and prospects of the application of CCUS technologies as an industrial decarbonization approach are discussed. Carbon footprint (CFP) observing, factoring and reporting workflows for correlating carbon exposure and resilience as part of climate assessment are introduced. Moreover, the main elements of carbon resilience scenarios are analyzed to fill the gap between the current industrial activities and decarbonization plans and to avoid making decisions solely based on economic aspects. Finally, we propose a workflow for carbon resilience calibration and a cash flow model for a sample CCUS project in the upstream oil and gas industry.
1 Introduction
Climate change and energy security are amongst the main critical concerns of sustainable development (Arachchige et al., 2021), which have direct and indirect impacts on other elements including water and land, as shown in Figure 1 (Ramos et al., 2022). Carbon dioxide (CO2) emissions have increased by approximately 80% since 1970 and global temperatures have risen by more than 1°C since 1950 (Ourworldindata, 2020), which is tied to fossil fuels utilization and widespread clearing of forest lands (IPCC, 2018). The share of the global fossil CO2 emissions by sectors are 38% for power industry, 21% for other industrial combustion, 21% for transport, 10% for non-combustion and 9% for buildings. (World Resource Institute, 2015).
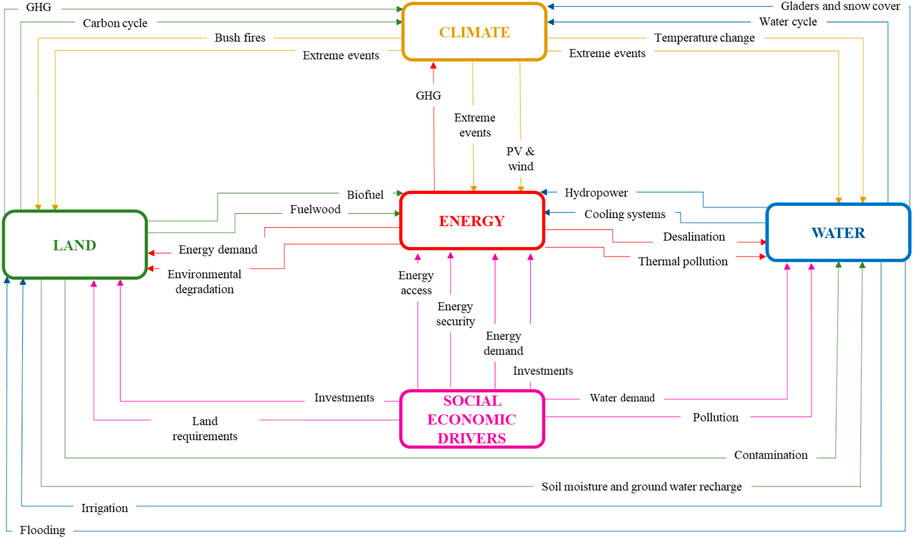
FIGURE 1. Direct and indirect physical impacts of sustainable development pillars (Ramos et al., 2022) (courtesy to UN, DESA).
The intensification of the greenhouse effect due to human activities poses global environmental problems and unprecedented abrupt changes in the global ecosystem, with 89% of current changes associated with global climate change (Jentsch and Beierkuhnlein, 2008). Climate change effects include disrupting weather patterns, leading to extreme weather events, unpredictable water availability, exacerbating water scarcity and contaminating water supplies (Babaeian, 2015). The goals of Paris agreement pose growing pressure on investors to address climate-risks associated with their investment portfolios, given the need to meet energy demand globally, while limiting GHG emissions. According to the annual oil and gas investor survey published in early 2022, 70% of investors feel pressure to invest in green funds and decrease the weighting of fossil fuels in their portfolios, which was 10% higher compared to 2020 (BCG, 2021).
Despite investments to improve efficiency, the energy intensity of oil and gas extraction activities has increased by 33% since 1980 in the country members of the organization for economic cooperation and development (OECD) (English and English, 2022). Moreover, average CO2 emissions is 5.5 tones per capita in developed countries, which is higher than countries with lower human development index (HDI) (Programme, 2022). Carbon footprint (CFP) of an average person in North West Europe (UK, Norway, Denmark and the Netherlands) is around 17–19 tons of CO2 per year from direct emissions (power, heating, private transport and industry) and indirect emissions (consumption of food and material goods) (Tukker, 2014). This number is around 1.5 tons per capita in Africa (Ritchie et al., 2020). It is worth mentioning that, nearly 80% of EUs energy was provided from fossil fuel sources in 2018 (Eurostat, 2020). In 2020, the range of EU energy sources was made up of 35% petroleum products, 24% natural gas, 12% solid fossil fuels, 17% renewables and 13% nuclear energy (Simplified, 2020).
On the other hand, according to the World Bank indicator for countries’ preparedness for a low-carbon transition (Group, 1944), the fossil fuel dependent countries (FFDCs) are least prepared for the energy transition in terms of exposure (hydrocarbon exports make up for GDP) and resilience to carbon emissions (revenues from oil and gas sales not adequately managed). This is mainly due to energy investment priorities based on economics to reduce poverty and increase standards of living, with minimum or no integration with climate impacts. Green climate fund was founded as a structure under the united nations framework convention on climate change (UNFCCC) to financially aid developing countries (up to a total 100 billion dollars) reaching their carbon emissions reductions goals based on the Paris agreement, while not losing their GDP. However, the infrastructure of these funds is not clear yet (Deng et al., 2022). Up to now, only 10 billion dollars of the green fund has been confirmed (Green Climate Fund, 2023).
The growing reliance on unconventional resources such as heavy oil and oil sands, reservoir depletion in areas with mature hydrocarbon fields, and the complexities surrounding productivity of newly-developed carbonate fields are the examples leading to high carbon intensity (CI) activities (Masnadi et al., 2018; Talebian et al., 2021). CI is defined as the issuer’s direct and first-tire indirect GHG emissions divided by the revenue, which is recommended to consider for climate-related risk analysis (Global, 2021). Additionally, the hard-to-abate industries also pose a major challenge in achieving net-zero emission ambitions. The CI values of several energy-intensive products are shown in Figure 2, according to commercial examples around the globe (Duncan et al., 2009), where the bubble size represents the CO2 concentration in gas stream to CO2 capture equipment. It can be seen that iron and steel, cement and chemical sectors are significant carbon emitters, due in part to the need for high-temperature heat generation and CO2 process (Bervikccs, 2019).
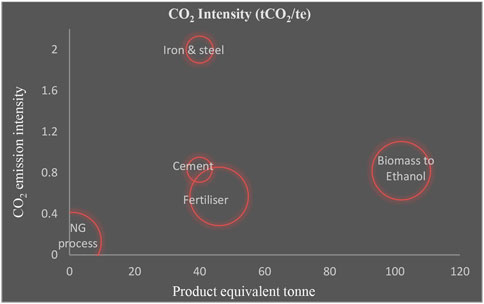
FIGURE 2. CI of energy intensive industry products, courtesy to (adopted data from Duncan et al., 2009).
Figure 3 illustrates the countries across the globe that have set laws, policy documents and legislations to achieve concrete timeline targets of net-zero emissions. The carbon neutrality goals in the grey zones in this figure are under discussion with no defined plan of action, while the green zones including Suriname, Bhutan, Benin, Gabon, Guinea-Bissau, Guyana, Cambodia, Liberia and Madagascar have already achieved net zero (Netzerotracker, 2023). The distribution of target plans for achieving carbon neutrality includes different combinations of renewables, decarbonizing the power sector and industrial process, hydrogen production and CCUS (BCG, 2021).
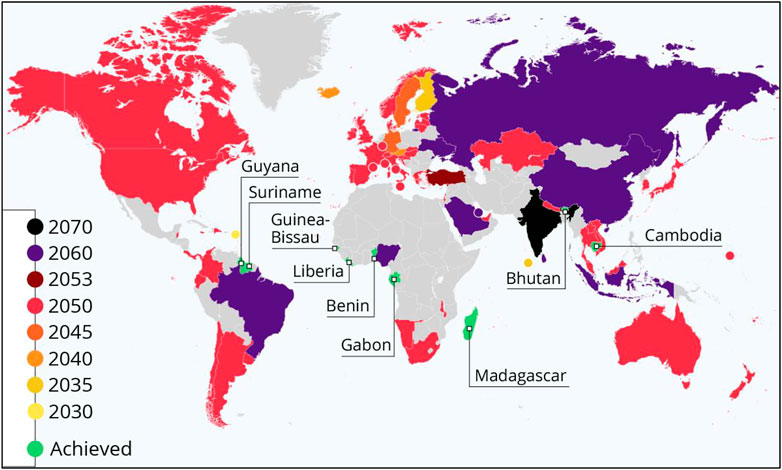
FIGURE 3. Timeline targets for carbon neutrality (copyright permission is obtained from Zandt, 2022, by corresponding author).
In the following sections we discuss different aspects of CCUS deployment, the high sensitivity of CCS sustainability to carbon tax policies in different countries, the huge gap between the active CCS projects and high CI activities. The importance of factoring climate-risks for decarbonizing the operations and rebalancing the business portfolios based on integration of technology-economics and environmental aspects in decision-making process is also discussed.
2 CCUS industry uncertainties
CCUS is currently considered indispensable to achieve decarbonization goals. A successful CCUS project requires capital, capture at source, transfer and storage sites. The approved underground storage sites include saline formations, depleted oil and gas reservoirs, unmineable coal seams, organic-rich shales and basalt formations. CO2 is trapped in the subsurface via structural, residual, solubility and mineral trapping mechanisms.
CCUS technology is developing rapidly, with more than 130 CCUS-related facilities under construction and in operation worldwide as of September 2021. The world’s CCUS investment scale approached USD 3 billion in 2020, which was a significant increase compared to USD 800 million in 2018 and USD 1 billion in 2019. Figure 4 presents the distribution of operational and planned global CCS/CCUS projects in comparison with CI of upstream and downstream activities, estimated based on the life cycle analysis (LCA) methodology (Masnadi et al., 2018). The size and color of bubbles varies with the number of active and under development CCS/CCUS projects in a country. As can be seen, the distribution of CCS/CCUS projects is not in line with the distribution of the highest CI projects.
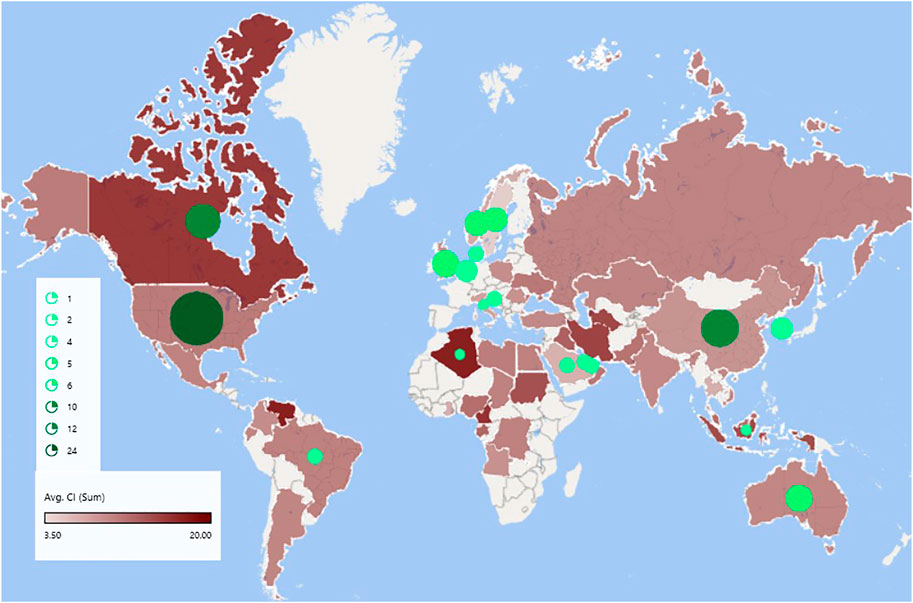
FIGURE 4. Status of global CCS/CCUS projects in terms of numbers (bubbles) in comparison with average CI of upstream and downstream activities (graduated colors from deep red at highest values to light red at lowest range) (Figure is original and designed by authors, adopted data from Masnadi et al., 2018).
Recent studies on evolution of announced available storage capacity shows a 40% gap between available and demanded storage capacity by 2030 (English and English, 2022). Storage capacity is the volume of CO2 geologically stored in a geological formation, which controls the cumulative volume that can be injected over the life of the project. Furthermore, containment risks associated with potential leakage pathways through caprock, faults and old legacy wells and the risks due to induced seismicity represent uncertainties (Zoback and Gorelick, 2012), that can damage public perception about geological storage and affect projects performance especially at early stages.
Figure 5 presents the cost of CO2 abatement in different sectors by using first of kind (FOAK) capture plants, in different countries around the globe (Irlam, 2017). As can be seen in this figure, the cost of CO2 avoided in heavy industry sectors is higher in all regions.
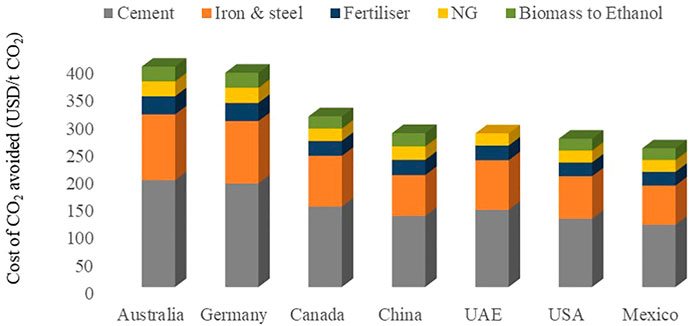
FIGURE 5. Cost of CO2 avoided in FOAK in different regions (data adopted from Irlam, 2017).
A comparison of the cost estimates of chemicals, heavy industries, natural gas (NG) and ethanol production without CCS and with FOAK and Nth of a kind (NOAK) CCS technologies is presented in Figure 6 (Budinis et al., 2018). As can be seen in Figure 6, cost reduced by migrating from FOAK to NOAK plants, which is mainly due to plant size increase and consequent reduction of performance risks.
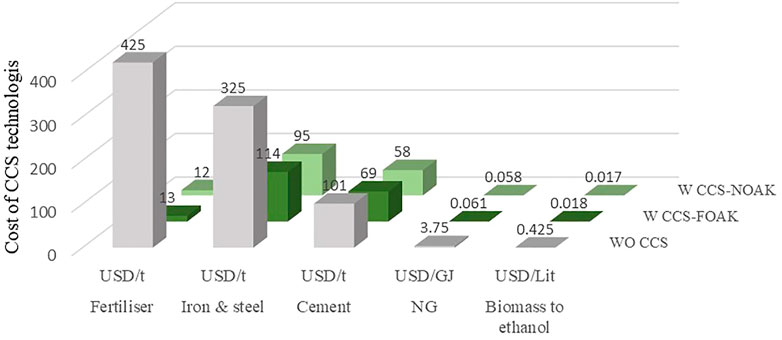
FIGURE 6. Comparison of cost of CCS technologies for chemicals and heavy industries vs. natural gas processing in FOAK and NOAK plants in the US (adopted data in figure from Budinis et al., 2018).
The market price for CO2 after spending huge amounts of investments in the upfront drilling, infrastructure, injection phase operation and continuous monitoring is of the main concerns of CCS developers in terms of economic risks. Financial assessment of three scenarios of CO2 storage, which include 1) CO2 storage for CCS, 2) CO2 storage for CCS and enhanced oil recovery (EOR), and 3) CO2 storage for CCS, EOR and temporarily underground storage via CO2 interim storage (CIS), showed that they can only be economically viable when the tax credit is above 40 USD per ton of captured ad sequestrated CO2 (Farhat et al., 2013).
Figure 7 presents the benchmark capture cost for different industries and the global captured emissions for each industry, where the bubble size represents the capture rate percentage. For the green colored bubbles, with 50 USD/t CO2 threshold market price for CO2 in OECD countries, CCUS in these industries in commercially viable. While for the industries with capture costs higher than the threshold market price, CCUS is not commercially viable.
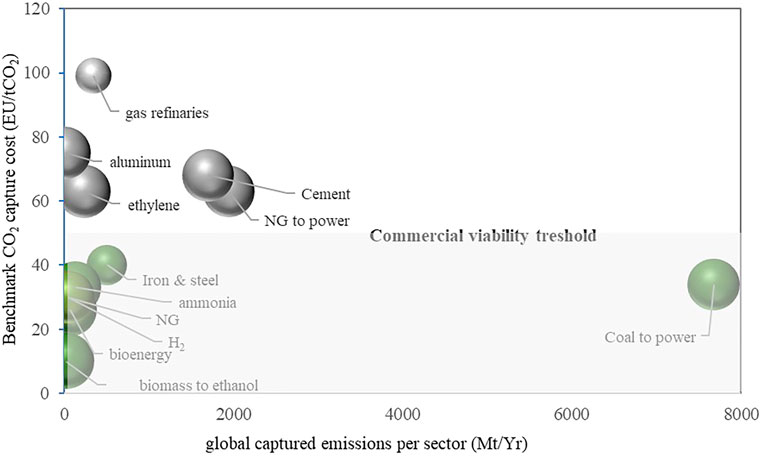
FIGURE 7. Global benchmark of capture cost vs. captured emissions per sector, bubble size is capture rate per sector (Figure adopted data from Irlam, 2017 and utilised in figure design).
However, according to the recently passed Inflation Reduction Act (IRA) in the US, the increased 45Q tax credits to USD 85/t CO2 has assigned CCUS as one of the most attractive energy transition industries on a levelised value of carbon basis. Figure 8 shows that the new incentives significantly expanded CCUS commercial viability for gas refining, hydrogen, cement and steel sectors (Bailera et al., 2021; Wamsted et al., 2022; Abdou, Alabbasi, Adair).
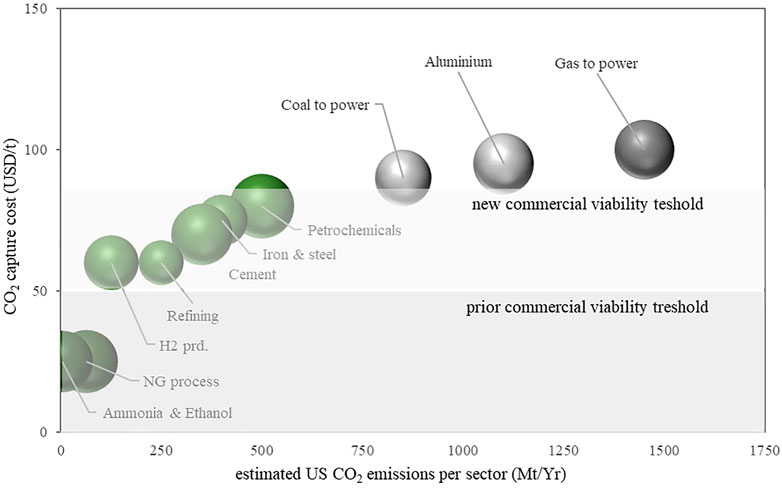
FIGURE 8. Capture cost vs. emissions per sector in the US, bubble size is capture rate per sector (Figure adopted data from BCG, 2021; Bailera et al., 2021; Wamsted et al., 2022; Abdou, Alabbasi, Adair).
3 Carbon factoring
In an environment of new agreements on climate change, shift of interests from fossil fuels and changing business financials, the risks associated to carbon (carbon risk) results from the transition process from a carbon-intensive brown economy to a low-carbon green economy. Brown-minus-green (BMG) risk factor was proposed for measuring the risks associated to energy transition in investment portfolios (Görgena, 2019). BMG accounts for three main dimensions, including value chain (impact of climate policy on trade, production, sales, etc.), public perception and adaptability. The BMG factor is measured for different sectors, where the greener a financial institution’s investment, the lower is its BMG factor (Roncalli et al., 2021). Overall, the energy and materials sectors are recognized to be the most sensitive sectors impacted by an unexpected acceleration in the transition process towards a green economy. Given the high sensitivity of energy sector to energy transition, the role of oil and gas companies on understanding the climate risks and opportunities through reporting carbon footprint (CFP), climate factoring and resilience forecasting is highlighted. CFP is a parameter used to measure the amount of direct and indirect GHGs originated by a company, event, activity or during the life cycle of a product or service (Useche-Narvaez et al., 2021).
Three scopes have been established for CFP of an organization, where scope 1 is direct GHGs from sources controlled by the organization, scope 2 is indirect emissions occur outside the organization from imported external resources, and scope 3 is indirect emissions occur outside the organization from source not owned or controlled by it, but linked to its activities (Useche-Narvaez et al., 2021). While it is clear that energy and materials sector have a large scope 1 emissions mainly due to extraction, production and refining operations, there is a significant scope 3 sources of indirect emissions (at least 40% of total scope 1 and 2), which is currently hard to define due the lack of global reporting standards. The reporting boundaries for scope 3 upstream and downstream emission sources of an oil company and by implication a refinery unit is illustrated in Figure 9 (Institute, 2016). This figure shows the complexities of scope 3 calculations in terms of data availability, quality and perhaps double counting. Operators can enhance understanding of the scope 3 emissions by generating baselines and AI-driven CIs of their products to track the impact on the environment and shift to less carbon-intensive products to promote the reduction of their scope 3 emissions.
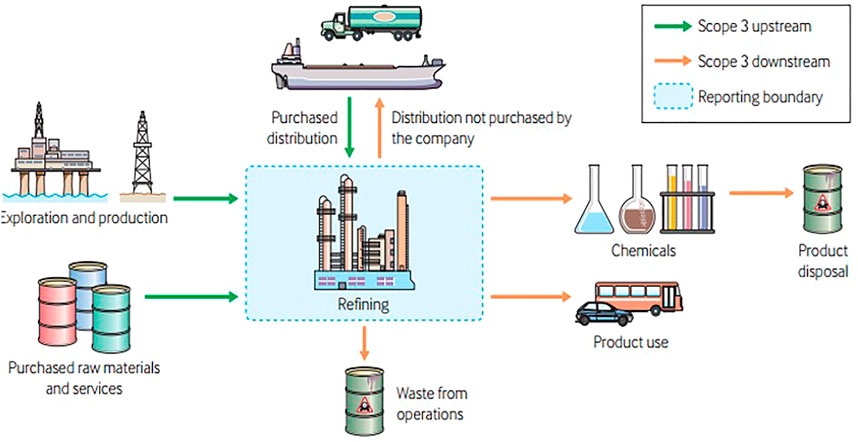
FIGURE 9. Scope 3 emission sources for a refinery (Institute, 2016).
While 78% of investors are considering the addition of CFP factoring into evaluations of oil and gas companies, almost 70% of investors who are currently factoring CFP into their present and long-term models do not believe they impact valuations (BCG, 2021), which is attributed to vague factoring boundaries and standards. The accurate CFP values define the limitations of resources, sources of emissions and energy consumption and can be used for a sensible and balanced decision-making towards decarbonization goals by suggesting alternative activities with reduced carbon emissions at each point of time (Bista et al., 2019).
4 Carbon resilience calibration (CRC)
In response to the anticipated shrinkage in traditional oil and gas practice in North Sea as decarbonization accelerates, viable technologies over the next 30 years in providing low-carbon energy are divided into proven, probable and possible, as shown in Figure 10 (Quirk et al., 2021). Technology cost, CFP, plant scale and area and climate impact are the measured elements in ranking the technologies. However, collaborative mindset and collective thinking is the essential unmeasurable element to optimize the benefit from technical solutions.
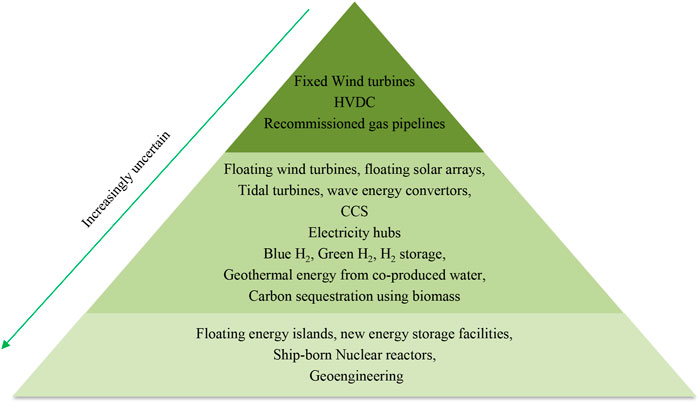
FIGURE 10. Proven, probable and possible technologies (from vertex to the base), applicable in North Sea through energy transition (Figure designed by authors and adopted data from (Quirk et al., 2021)).
The carbon resilience calibrator (CRC) analysis is proposed here for monitoring, factoring and predicting the climate-risk of different levels of decisions in upstream and refining process management. In this work, Carbon resilience is defined as the capacity to absorb carbon risks and thrive in altered circumstances during the energy transition. CPF, carbon risk factoring and analysis of exposure and resilience in decision-making process is illustrated in Figure 11.
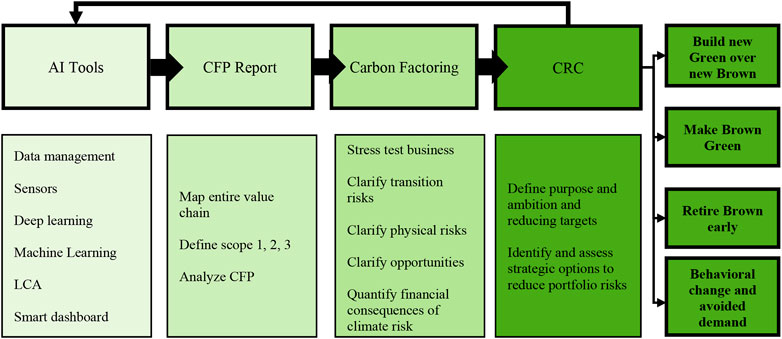
FIGURE 11. Proposed CRC workflow.
Artificial intelligence (AI) tools support the predictions of data-driven CI of new projects based on the historical data bank (Mor et al., 2021). Integrated AI framework based on data-driven approach has become of interest to predict the CFP of oilfield activities in terms of associated development and production operations such as drilling new wells, artificial lift systems (ALS) and oilfield-produced water treatments to enhance production while minimizing the operations CFP (Yang et al., 2016; Katterbauer, 2021). Figure 12 is our proposed cash flow model for a sample CCS/CCUS project to promote CRC through emission scenario analysis. However, it is important to consider the sizable electricity contribution of AI, large scale machine learning and information and communication technologies, which is up to 8 percent of the global energy use, in the CRC scenario analysis. According to recent studies (Patterson et al., 2022), the data training phase of the AI-based ChatGPT tool emitted 552 tones CO2e, and its daily CFP is around 24 kg CO2e (Ludvigsen, 2022). The carbon cost associated to the application of smart technology in CRC method can be reduced by shifting to sustainable AI infrastructure and embracing “Green AI” (Dhar, 2020).
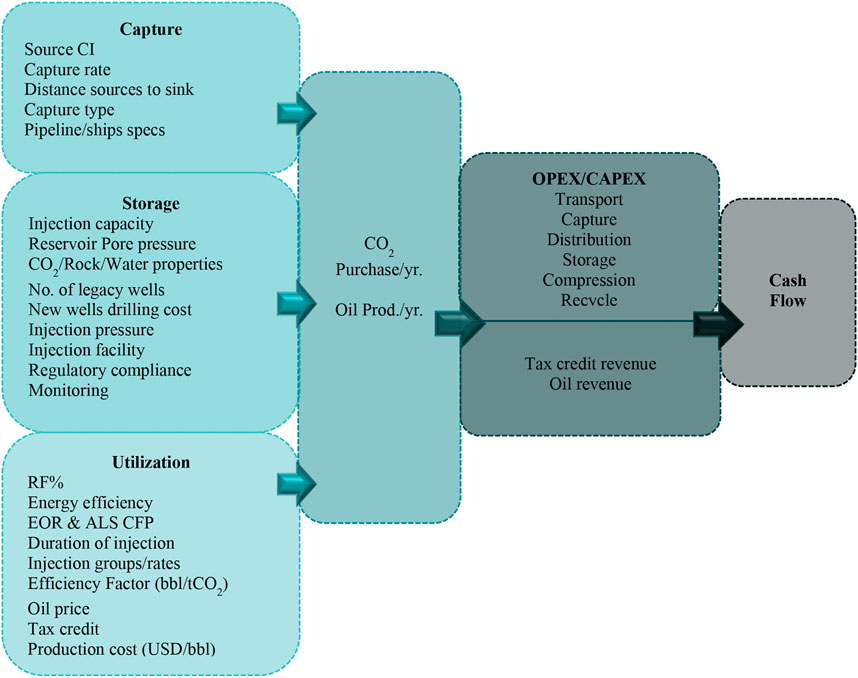
FIGURE 12. Proposed CCS/CCUS cash flow model based on CRC approach.
5 Conclusion
This paper illustrates the importance of carbon factoring and carbon resilience calibration in the decision-making process of sectors with high CI, in the road to industrial decarbonization and achieving sustainability goals. Data-driven CI estimates can encourage prioritizing low-CI actions and methods and enable decision-makers to decarbonize the operations.
However, the progress in this direction will rely fundamentally on improved reporting and enhanced transparency of industrial emissions. CFP reporting and factoring and carbon resilience analysis are introduced and discussed as the tools enabling decision-makers to decarbonize operations. For example, different levels of decision makers at any mature or green field development can assess their decisions based on CFP. Therefore, the decision-making process will be supported by carbon resilience calibration, to provide added value and resilience.
Data availability statement
The original contributions presented in the study are included in the article/Supplementary Material, further inquiries can be directed to the corresponding authors.
Author contributions
Conceptualization, SHT and AJ; Formal analysis, SHT; Visualization, SHT; Writing—original draft, SHT; Writing—review and editing, AJ and MMM-V. All authors have read and agreed to the published version of the manuscript.
Acknowledgments
Corresponding author would like to thank Mr. Mu Jabbari from Ilam University for his assistance on preparing the 3D plots. A. Jahanbakhsh and M. M. Maroto-Valer would like to acknowledge that this work was supported by the UKRI ISCF Industrial Challenge within the UK Industrial Decarbonisation Research and Innovation Centre (IDRIC) award number: EP/V027050/1.
Conflict of interest
The authors declare that the research was conducted in the absence of any commercial or financial relationships that could be construed as a potential conflict of interest.
Publisher’s note
All claims expressed in this article are solely those of the authors and do not necessarily represent those of their affiliated organizations, or those of the publisher, the editors and the reviewers. Any product that may be evaluated in this article, or claim that may be made by its manufacturer, is not guaranteed or endorsed by the publisher.
References
Abdou, Walid, Alabbasi, Yasser Abdulrahim, and Adair, B. Ammonia technology roadmap. Paris, UK: International Energy. Agency. www.iea.org.
Arachchige, U., Wandana, S., and Preethika, P. (2021). Carbon footprint analysis: Promoting sustainable development. Berlin, Germany: Research gate.
Babaeian, I. (2015). Simulation of climate change in Iran during 2071-2100 using PRECIS regional climate modelling system. Desert 20 (2), 123–134.
Bailera, M., Lisbona, P., Pena, B., and Romeo, L. M. (2021). A review on CO2 mitigation in the Iron and Steel industry through Power to X processes. J. CO2 Util. 46–101456. doi:10.1016/j.jcou.2021.101456
Bcg, (2021). Infographic oil gas investor survey. https://www.bcg.com/publications/2020/infographic-oil-gas-investor-survey. 2021.
Bervikccs, (2019). Transforming Industry through CCUS. International Energy Agency. www.iea.org.
Bista, S., Jennings, P., and Anda, M. (2019). Carbon footprint management of unconventional natural gas development in the export scenario. Renew. Energy Environ. Sustain. 4, 3. doi:10.1051/rees/2018008
Budinis, S., Krevor, S., Dowell, N. M., Brandon, N., and Hawkes, A. (2018). An assessment of CCS costs, barriers and potential. Energy Strategy Rev. 22, 61–81. doi:10.1016/j.esr.2018.08.003
Deng, Q., Ling, X., Zhang, K., Tan, L., Qi, G., and Zhang, J. (2022). CCS and CCUS technologies: Giving the oil and gas industry a green future. Front. Energy Res. 10. doi:10.3389/fenrg.2022.919330
Dhar, P. (2020). The carbon impact of artificial intelligence. Nat. Mach. Intell. 2, 423–425. doi:10.1038/s42256-020-0219-9
Duncan, I. J., Nicot, J.-P., and Choi, J.-W. (2009). Risk assessment for future CO2 sequestration projects based CO2 enhanced oil recovery in the U.S. Energy Procedia 1 (1), 2037–2042. doi:10.1016/j.egypro.2009.01.265
English, J. M., and English, K. L. (2022). An overview of carbon capture and storage and its potential role in the energy transition. First Break 40 (4), 35–40. doi:10.3997/1365-2397.fb2022028
Farhat, K., Koplin, J., Lewis, D., Peterlin, S., and Simms, R. (2013). Financial assessment of CO2 capture and storage with electricity trading in the U.S.: Role of interim storage and enhanced oil recovery. Energy Procedia 37, 7512–7525. doi:10.1016/j.egypro.2013.06.695
Global, S. P. (2021). S&P global platts launches crude carbon intensity calculations and daily carbon offset premiums. Arlington, USA: S and P Global.
Green Climate Fund (2023). GCF: Catalysing finance for climate solution. https://www.greenclimate.fund/document/catalysing-finance-for-climate-solutions.
Group, W. B. (1944). Worldbank. https://www.worldbank.org.
Institute, T. A. P. (2016). Estimating petroleum industry value chain (Scope 3) greenhouse gas emissions. The global oil and gas industry association for environmental and social issues. www.ipieca.org.
Ipcc, Global warming of 1.5 ºCGlobal warming of 1.5 ºC. 2018, the intergovernmental panel on climate change (IPCC). Geneva, Switzerland: IPCC. https://www.ipcc.ch/.
Irlam, L. (2017). Global costs of carbon capture and storage. Melbourne, Australia: Global CCS Institute.
Jentsch, A., and Beierkuhnlein, C. (2008). Research frontiers in climate change: Effects of extreme meteorological events on ecosystems. Comptes Rendus Geosci. 340 (9), 621–628. doi:10.1016/j.crte.2008.07.002
Katterbauer, K., Carbon footprint forecasting of IOR activities via an intelligent NARX framework for promoting greener reservoir management. 2021. 2021(1): 1–9.
Ludvigsen, K. G. A. (2022). The carbon footprint of ChatGPT. Towards data science. [cited 2023; Available from: https://towardsdatascience.com/the-carbon-footprint-of-chatgpt-66932314627d.
Masnadi, M. S., El-Houjeiri, H. M., Schunack, D., Li, Y., Englander, J. G., Badahdah, A., et al. (2018). Global carbon intensity of crude oil production. Science 361 (6405), 851–853. doi:10.1126/science.aar6859
Mor, S., Madan, S., and Prasad, K. (2021). Artificial intelligence and carbon footprints: Roadmap for Indian agriculture. Strateg. Change 30, 269–280. doi:10.1002/jsc.2409
Netzerotracker, (2023). Netzerotracker. https://eciu.net/netzerotracker.
Ourworldindata (2020). Our world India. National Aeronautics and Space administration (NASA), Goddard Institute for space studies (GISS). https://data.giss.nasa.gov/gistemp/.
Patterson, D., Gonzalez, J., Holzle, U., Le, Q., Liang, C., Munguia, L. M., et al. (2022). The carbon footprint of machine learning training will plateau, then shrink. Computer 55 (7), 18–28. doi:10.1109/mc.2022.3148714
Programme, U. N. D. (2022). Human development index. https://hdr.undp.org/data-center/human-development-index#/indicies/HDI. 2022.
Quirk, D. G., Underhill, J. R., Gluyas, J. G., Wilson, H. A., Howe, M. J., and Anderson, S. (2021). The North Sea through the energy transition. First Break 39 (4), 31–43. doi:10.3997/1365-2397.fb2021026
Ramos, E. P., Sridharan, V., Alfstad, T., Niet, T., Shivakumar, A., Howells, M. I., et al. (2022). Climate, Land, Energy and Water systems interactions – from key concepts to model implementation with OSeMOSYS. Environ. Sci. Policy 136, 696–716. doi:10.1016/j.envsci.2022.07.007
Ritchie, H., Roser, M., and Rosado, P. (2020). CO2 and Greenhouse Gas Emissions. . Available at: https://ourworldindata.org/co2-and-greenhouse-gas-emissions.
Roncalli, T., Guenedal, T. L., Lepetit, F., and Sekine, T. (2021). The market measure of carbon risk and its impact on the minimum variance portfolio. J. Portfolio Manag. 47 (9), 54–68. doi:10.3905/jpm.2021.1.285
Simplified, Eurostat. (2020). Energy balances. Available from https://ec.europa.eu/eurostat/databrowser/view/NRG_BAL_S__custom_1946578/bookmark/table?lang=en&bookmarkId=8760d5fb-bdbe-4cfe-9b79-c0dc3eaafe8f.
Talebian, S. H., Fahimifar, A., and Heidari, A. (2021). Review of enhanced oil recovery decision making in complex carbonate reservoirs: Fluid flow and geomechanics mechanisms. J. Comput. Appl. Mech. 52 (2), 350–365.
Tukker, A. (2014). The Global Resource Footprint of Nations: Carbon, water, land and materials embodied in trade and final consumption calculated with EXIOBASE 2. Singapore: Academia.
Useche-Narvaez, C., Montes Páez, E., and Guerrero Martin, C. (2021). Evaluation of the carbon footprint produced by conventional artificial lift systems in a Colombian field. J. Petroleum Sci. Eng. 208–108865. doi:10.1016/j.petrol.2021.108865
Wamsted, Dennis, Mattei, Suzanne, and Mawji, Omar (2022). Reality Check on CO2 emissions capture at hydrogen-from-gas plants. Lakewood, OH, USA, Institute for Energy Economics and Financial Analysis IEEFA.
World Resource Institute, (2015). CAIT Climate data explorer. https://www.wri.org/data/cait-climate-data-explorer.
Yang, S., Yang, W., Chen, G., Fang, X., Lv, C., Zhong, J., et al. (2016). Greenhouse gas emissions from oilfield-produced water in Shengli Oilfield, Eastern China. J. Environ. Sci. 46, 101–108. doi:10.1016/j.jes.2015.11.031
Zandt, F. (2022). Countries with laws policy documents or timed pledges for carbon neutrality. https://www.statista.com/chart/26053/countries-with-laws-policy-documents-or-timed-pledges-for-carbon-neutrality/.
Keywords: decarbonization, CCS, carbon resilience scenario analysis, carbon risk, carbon factoring
Citation: Talebian SH, Jahanbakhsh A and Maroto-Valer MM (2023) Carbon resilience calibration as a carbon management technology. Front. Energy Res. 11:1089778. doi: 10.3389/fenrg.2023.1089778
Received: 04 November 2022; Accepted: 28 March 2023;
Published: 06 April 2023.
Edited by:
Xindi Sun, Slippery Rock University of Pennsylvania, United StatesReviewed by:
Henrique A. Matos, University of Lisbon, PortugalEdris Joonaki, TÜV SÜD (United Kingdom), United Kingdom
Copyright © 2023 Talebian, Jahanbakhsh and Maroto-Valer. This is an open-access article distributed under the terms of the Creative Commons Attribution License (CC BY). The use, distribution or reproduction in other forums is permitted, provided the original author(s) and the copyright owner(s) are credited and that the original publication in this journal is cited, in accordance with accepted academic practice. No use, distribution or reproduction is permitted which does not comply with these terms.
*Correspondence: Seyedeh Hosna Talebian, aHNuLnRhbGViaWFuQGdtYWlsLmNvbQ==; Amir Jahanbakhsh, QS5KYWhhbmJha2hzaEBody5hYy51aw==