- Korea Advanced Institute of Science and Technology (KAIST), Daejeon, South Korea
Two different approaches are widely accepted for transient Monte Carlo (MC) simulation namely the Dynamic Monte Carlo (DMC) and the Predictor-Corrector Quasi-Static Monte Carlo (PCQS-MC). The MC transport code iMC developed at the Korea Advanced Institute of Science and Technology incorporates both approaches. In this paper, an original method for properly assessing the uncertainty of PCQS-MC is proposed and demonstrated using the iMC code. A detailed description of applying the PCQS method for transient MC calculation is presented with an emphasis on the origins of PCQS-MC uncertainties. The implementation of a quasi-static method, i.e., calculation of point-kinetics (PK) parameters, incurs an additional uncertainty for PCQS-MC calculation alongside the conventional stochastic MC uncertainty. Such quasi-static treatment-driven stochasticity cannot be recognized through the conventional MC sampling scheme, insinuating a significant underestimation of uncertainty without proper measures. To verify the findings, null-transient simulations have been performed for GODIVA and C5G7 benchmarks, where the former and latter problems require continuous and multi-group energy treatment respectively. For an improved uncertainty evaluation, a new sampling scheme referred to as the PK-sampling scheme is proposed where cycle-wise PK correction is made. Proper estimation of uncertainty can be made from the heap of cycle-wise corrected power through a unique screening process based on the null hypothesis testing. The proposed PK sampling scheme is tested for C5G7-TD transient benchmarks using iMC where the result plainly attests to the effectiveness of the new sampling approach.
1 Introduction
Over the past few years, in the wake of widespread high-power computing resources and algorithmic breakthroughs, the Monte Carlo (MC)-based nuclear reactor analysis has gained attention for both steady-state and transient simulations. For steady-state MC calculation, various techniques have been proposed to either reduce the variance or accelerate the computing process and were successfully demonstrated in numerous MC transport codes. Especially, the recently proposed improved Deterministic Truncation of Monte-Carlo (iDTMC) philosophy suffices both goals and was implemented in the iMC transport code developed in Korea Advanced Institute of Science and Technology (KAIST), which clearly improves figure-of-merit (FOM) (Kim and Kim, 2022a; Kim et al., 2022).
For time-dependent MC calculation, two major philosophical approaches are often recognized, which are the Dynamic Monte Carlo (DMC) and the Predictor-Corrector Quasi-Static Monte Carlo (PCQS-MC), and have been adopted in many reactor analysis programs. TRIPOLI-4 (Faucher et al., 2018), McCARD (Shaukat et al., 2017), Serpent2 (Leppänen, 2013), and OpenMC (Mylonakis et al., 2017), programs utilized the DMC method for time-dependent reactor simulation. Meanwhile, RMC (Guo et al., 2021) and McBOC (Jo et al., 2016) adopted the PCQS-MC model alongside deterministic-like correction during transient simulation. It is noteworthy to articulate that unlike most of the other codes, iMC supports both the DMC and PCQS-MC calculation based on the user’s preference (Kim and Kim, 2021), although it is the PCQS-MC and its inherent uncertainty-related issues that will be presented in this paper.
The MC calculation is in nature a stochastic process which necessitates an evaluation of uncertainty for the acquired quantities of interest. For steady-state calculation, it has been a standard to use the central limit theorem (CLT) for assessing the variance of the cycle-wise tallied parameters including the multiplication factor. Although non-negligible cycle-wise correlation manifests as an underestimation in uncertainty, i.e., apparent variance, still meaningful estimation can be made (Ueki et al., 1997). Note that the cycle-wise tallied quantities are expected to follow a normal distribution with enough number of histories.
On the other hand, sole usage of the aforementioned conventional MC uncertainty estimation method becomes ineffective for PCQS-MC calculation. The deterministic-stochastic hybrid framework of PCQS-MC requires the evaluation of point-kinetics (PK) parameters during the active cycle along with the cycle-wise power, i.e., predicted power. From the solution of the PK equation, the cycle-wise averaged power is then corrected, hence attaining the name of predictor-corrector quasi-static scheme. The uncertainty of the cycle accumulated power can be appraised easily from the conventional approach; however, it would not reflect the stochastic behaviour of the PK parameter and its effect on the corrected power. Whereupon, a different measure must be envisaged for the proper estimation of PCQS-MC uncertainty that incorporates the above considerations (Kim and Kim, 2022b; Kim, 2022).
This paper is organized as follows. Section 2 describes the framework of the PCQS-MC method. Section 3 explains the uncertainty sources for PCQS-MC calculation and presents an original PK sampling scheme for the proper estimation of uncertainty. The numerical results for demonstrating the applicability of the new method are given in Section 4, and Section 5 provides conclusions of the presented work.
2 Predictor-corrector quasi-static Monte Carlo method
2.1 Transient fixed-source problem (TFSP) for PCQS-MC method
The time-dependent neutron transport equation and the precursor concentration balance equation need to be simultaneously solved for transient reactor analysis.
where
Implementation of implicit Euler method with a time-step of
where TPCQS is defined as
The following linear variation assumption for fission source and exponential transformation are then applied.
1) Linear Variation of Fission Source
1) Exponential Transformation
Substituting Eqs. 9,10 into Eq. 7, one yields the following expression for the time-dependent transport equation.
where
Similarly, the balance equation for precursor concertation can be expressed as
One could recognize that Eq. 11 is in the form of a transient fixed-source problem (TFSP) and its calculation result directly determines the precursor concentration according to Eq. 14. The MC method applied to Eq. 11 samples the fission source for the updated time-step (
2.2 Point-kinetics equation for PCQS-MC method
As aforementioned, it is the correction based on the point-kinetics (PK) equation that determines the final solution for the PCQS-MC method. For derivation of PK equation, the angular flux is factorized into the amplitude function n(t) and the shape function as:
Note that such a factorization is not an assumption, but rather demands an additional equation to render such a factorization to be unique. Mathematically, the following condition is imposed,
where
By multiplying the weighting function to the original time-dependent balance equations and integrating over the space, angle, and energy, the following point-kinetics (PK) time-dependent differential equations can be obtained:
where n(t) is the amplitude function and cd(t) is the weighted integrals of precursor concentration. Note that Equation 17 will be referred to as the point-kinetics equations (PKE) throughout this manuscript. All the other notations are defined as below:
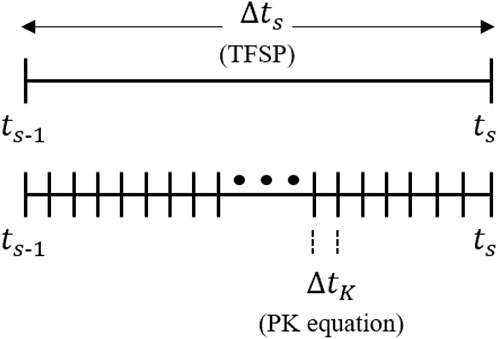
The PK parameters are evaluated (tallied) based on Eqs 18–21 for every cycle, thus insinuating stochasticity in nature. From the cycle averaged values; Eq. 17 is solved using the implicit Euler method with a finer time-step difference of
The total spectrum
which is necessary for the preservation of Eq. 1 (Ott and Neuhold, 1985). For the steady-state MC calculation, by sampling the quasi-static precursor concentration, the expression given in Eq. 23 can be met, which allows the evaluation of effective (adjoint-weighted) kinetic parameters according to Eqs 19, 20 (Leppänen et al., 2014). Considering the TFSP for PCQS-MC calculation, Eq. 23 can be met by assessing the PK parameters based on particles originating from ts related source terms in Eq. 11. As aforementioned, the ts-1 related source terms are pre-evaluated from the previous time-step whereas the ts related source terms are re-evaluated for every cycle.
It should be noted that variation exists for the definitions of PK parameters concerning the usage of proper spectrum, which also have been successfully applied for solving the time-dependent transport problem under the PCQS framework (Shang et al., 2018). Nevertheless, it must be articulated that the definitions included in this manuscript is also consistently formulated, where its applicability for PCQS-MC calculation have been demonstrated several times (Jo et al., 2016; Kim and Kim, 2021; Kim and Kim, 2022b; Kim, 2022).
The updated amplitude function
where
3 Origins for PCQS-MC uncertainty and PK sampling scheme
3.1 Null-transient simulation
Unlike the conventional steady-state MC calculation, not only the cycle-wise source correlation but also the innate uncertainty of tallied PK parameters contributes to the stochastic uncertainty of the PCQS-MC calculation. For a quantitative assessment of each uncertainty source, a null-transient simulation using the critical GODIVA benchmark has been considered. Note that ‘null-transient’ refers to a transient calculation without invoking any perturbation, hence any deviation from the original steady-state calculation result can be perceived as an extent of uncertainty.
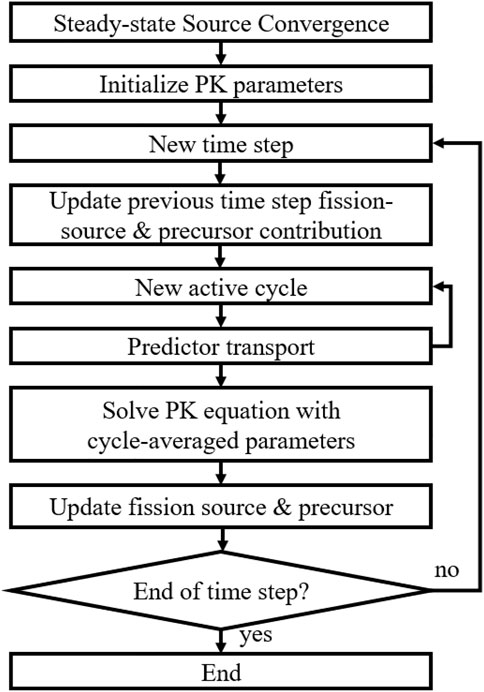
The cycle-wise correlation-induced uncertainty can be easily captured by employing the conventional MC uncertainty analysis scheme. As shown in Figure 1, during the active cycle, a predictor transport is performed, where the power level of the predicted solution can be scored for each cycle. From the deviation of cycle-wise predicted power, its uncertainty can be obtained and can be scaled accordingly to Eq. 24 using the correction factor. However, such an approach cannot accommodate the uncertainty stemming from deducing PK parameters.
For the null-transient test using the critical GODIVA benchmark, three different cases have been envisioned. Case 1 is a non-controlled case which represents a normal PCQS-MC calculation condition. For case 2, the dynamic reactivity (ρ) used in the PK equation calculation is set to zero, which signifies the exclusion of PK parameter-associated uncertainty. In the last case, variance due to cycle-wise source correlation is suppressed through a large number of histories per cycle. Table 1 enumerates a detailed calculation condition for each case with a unit vector being universally employed as a weighting function in this work, which alleviates any concerns related to the proper usage of spectrum whilst tallying the PK parameters, i.e., energy dependency of
Figure 3 depicts the calculated time-wise power profiles for each case from the null-transient simulation, where 500 micro time-steps were considered for each macro time-step interval. The uncertainty (error bar) corresponds to the 1-sigma range, and has been obtained from the cycle-wise tallied predicted power scaled with a correction factor. One can notice that the estimated PCQS-MC error bar cannot cover the extent of stochastic power fluctuation in the time domain for case 1. In addition, the effect of source correlation for the magnitude of fluctuation was marginal which can be seen from case 3.
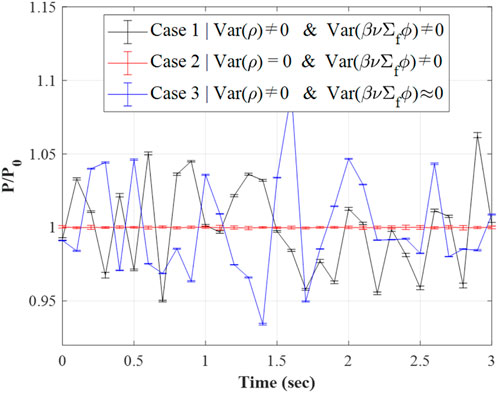
FIGURE 3. Estimated power-evolution from null-transient simulation and uncertainties for three different cases.
However, the fluctuation of power in time was noticeably suppressed, being comparable to the range of the error bar, for case 2. Note that dynamic reactivity was intentionally set to be zero for such a case, i.e., zero uncertainty, implying that PK parameter-related uncertainty is the major source for fluctuation of the PCQS-MC calculation, which must be taken into account for the proper estimation of uncertainty.
3.2 Point-kinetics sampling scheme for PCQS-MC
From the null-transient study, it is plain that the uncertainty of tallied PK parameters, especially the dynamic reactivity, has the most noticeable effect on the fluctuation of PCQS-MC power estimation. As discussed, the aforementioned conventional cycle-wise uncertainty assessment severely underestimates such an inherent uncertainty of the PCQS-MC framework. To circumvent such a limitation of the conventional approach, a modified simulation scheme referred to as the point-kinetics (PK) sampling method is proposed in this work.
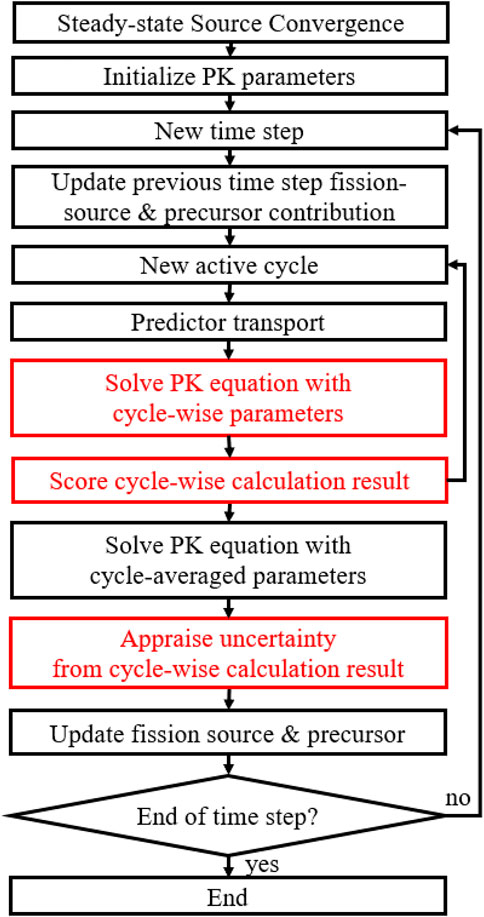
In comparison with the conventional PCQS-MC framework, which solves the PK equation based on the cycle-averaged tallied information, i.e., PK parameters, the PK sampling approach additionally solves the PK equation based on each cycle-wise tallied information. Note that the extra computing burden introduced by solving cycle-wise PK equation is insignificant compared to the MC transport calculation. The cycle-wise PK equation solution is then applied for each cycle-wise predicted power resulting in an accumulation of cycle-wise corrected power, in which the PK parameter-driven stochasticity is embedded. The overall procedure of the PK sampling scheme is shown in Figure 4.
Nevertheless, caution is needed whilst deducing the uncertainty from the heap of cycle-wise predicted power since solving the PK equation introduces non-linearity. It is worthwhile to explicitly mention that we are interested in the uncertainty of cycle-averaged PK parameter-based corrected power, not the average of cycle-wise corrected power. In fact, due to the non-linearity of the PK equation, one cannot guarantee equivalence between the cycle-averaged PK information-based corrected power and the average of cycle-wise PK information-based corrected power. Mathematically, one can express such an issue as below:
where fPK denotes the operation of solving PK equation, E represents an average, and
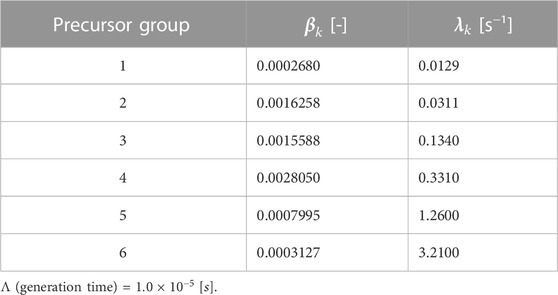
To validate the above speculation, a numerical test which mimics the null-transient PCQS-MC calculation has been envisioned. The PK calculation based on typical PWR kinetic parameters listed in Table 2 has been performed whilst perturbing the dynamic reactivity based on Eq. 18, where the multiplication factor is sampled from a normal distribution having a mean value of unity with a prescribed uncertainty (
Figure 5 illustrates the scatter plots of cycle-wise PKE calculated null-transient powers where the presence of seemingly outliers prevails with an increase of uncertainty. For comparison, the sample mean and 3-sigma range based on sample variance are marked for each case, where an increase in the multiplication uncertainty renders the sampled null-transient power to have a skewed distribution. Such an observation highlights the effect of non-linearity stemming from solving the PKE. As expected, the deviation between the average value of the cycle-wise PK calculation and PK calculation based on the cycle-averaged multiplication factor escalates with an increase in the uncertainty (
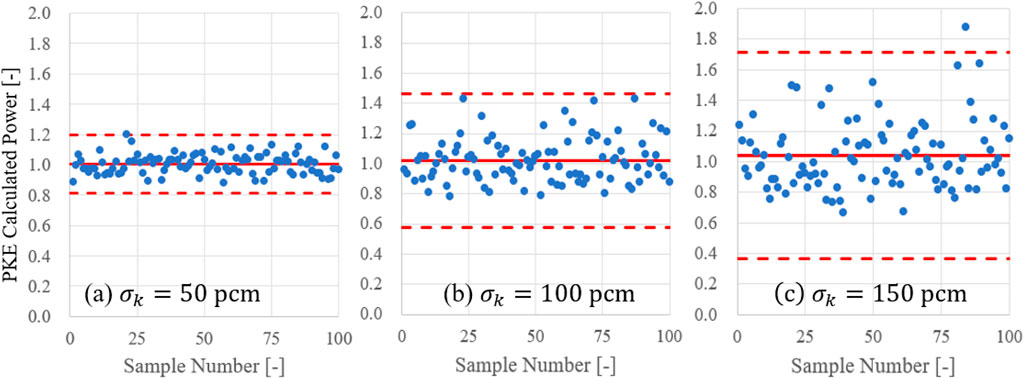
FIGURE 5. Scatter plots of sampled cycle-wise PKE calculated power for (A) 50 pcm, (B) 100 pcm, and (C) 150 pcm. Sample mean and 3-sigma range are marked with a red colour.
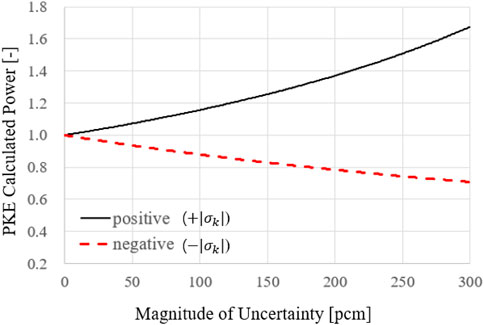
The overestimation of the average value of the cycle-wise PK calculation, i.e., the right-skewed distribution of cycle-wise PK calculation result as shown in Figure 5, can be explained from Eq. 17. The point-kinetics equation is in the form of 1st order differential equation, implying exponential growth term in its solution. Even with the same magnitude of uncertainty for k(t) in Eq. 18, the extent of resulting deviation in the calculated corrected power will vary according to the sign of
Figure 6 exhibits that the extent of change in the PKE calculated power becomes relatively larger for having a positive perturbation (+
3.3 Screening process based on null hypothesis test
When a noticeable non-linearity effect exists, the sampled cycle-wise corrected power deviates from a normal distribution as discussed in Section 3.2. Especially, the presence of outlier-like PK corrected power manifests as an overestimation in the sample variance for null-transient calculation. From such observations, the authors conjectured that through a proper screening process which excludes outlier-like sample data, the remaining heap of cycle-wise sample data could be perceived as following a normal distribution and a reasonable uncertainty estimation can be made. Obviously, a mathematical standard must be employed for determining normality, i.e., the degree of following a normal distribution, and screening of the sample data.
To verify the normality of a certain sample, the Shapiro-Wilk (SW) normality test (Shapiro and Wilk, 1965), which is a null hypothesis testing, has been exploited. The p-value calculated from the SW normality test is compared with a prescribed significance level α, and the sample is regarded as normal when the p-value is bigger than alpha. When the given sample does not suffice such a condition, the data residing out of
Step1) Check whether the given set of sample data satisfies the Shapiro-Wilk normality test
Step2) If not, exclude the data out of
Step3) Check whether the screened set of sample data satisfies Shapiro-Wilk normality test.
Step4) If not, repeat Steps 2–3 until Shapiro-Wilk normality test is satisfied or all the elements reside within the range of screening.
The screening process has been applied to a null-transient simulation result with an uncertainty of 150 pcm. As shown in Table 3, the direct calculation of sample standard deviation from the heap of data overestimates the real uncertainty evaluated from batch-wise calculation. However, the uncertainty after the screening process with a significance level of 0.05 and
4 Numerical results
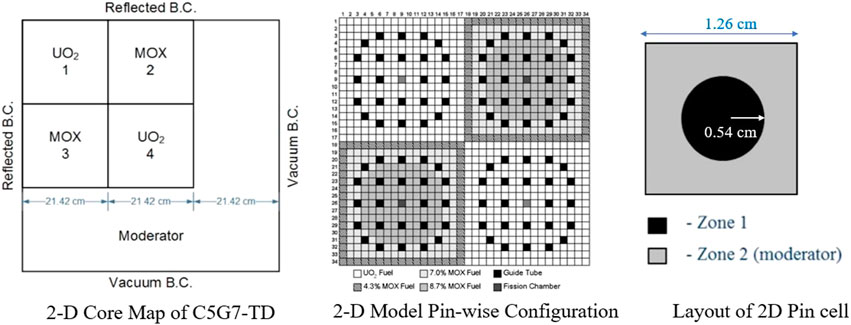
To substantiate the applicability of the PK sampling scheme for actual transient calculation, the C5G7-TD benchmark problem which involves the movement of control rods in a 2D geometry alongside a null-transient simulation has been considered. The problem inherits the 2D geometry configuration and few-group cross-sections of the C5G7 benchmark. The overall geometry of the benchmark is shown in Figure 8, where each fuel assembly has a 17 × 17 configuration that consists of 264 fuel cells, 24 guide tube cells, and a single fission chamber cell at the center. A more detailed description can be found elsewhere (Boyarinov et al., 2016). The calculated multiplication factor using iMC is compared with the reference as shown in Table 4.
4.1 Null-transient simulation of C5G7-TD
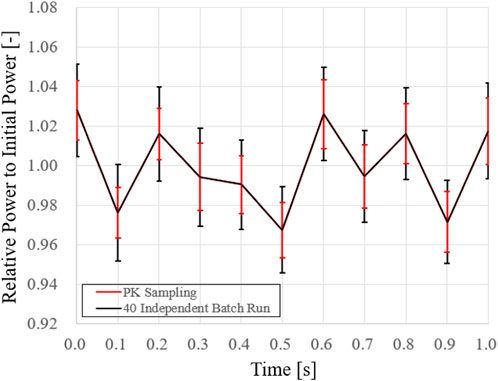
As aforementioned, the fluctuation of power in time for a null-transient simulation can be directly regarded as an extent of PCQS-MC uncertainty. For the verification of the proposed PK sampling scheme, the uncertainty based on PK sampling including the screening process is compared with the real variance acquired from batch-wise calculation. The time-step was set to be 0.1 s with 150,000 histories per cycle, having 100 inactive and 100 active cycles. Each consecutive macro time interval consists of 500 micro time-steps for PK calculation, and a total number of 40 independent batch runs were considered for the assessment of real uncertainty. Regarding the screening process, a significance level of 0.05 with a
One could observe that extent of real and PK sampling-based uncertainties are consistent throughout the simulation, where the latter always underestimates the real variance due to the presence of cycle-wise correlation. Such an attribute has been reported before during the preliminary assessment of the PK sampling strategy (Kim and Kim, 2022b; Kim, 2022; Oh et al., 2022). Nevertheless, the presented null-transient result plainly attests to the effectiveness of the proposed scheme for deducing proper uncertainty for PCQS-MC transient calculation.
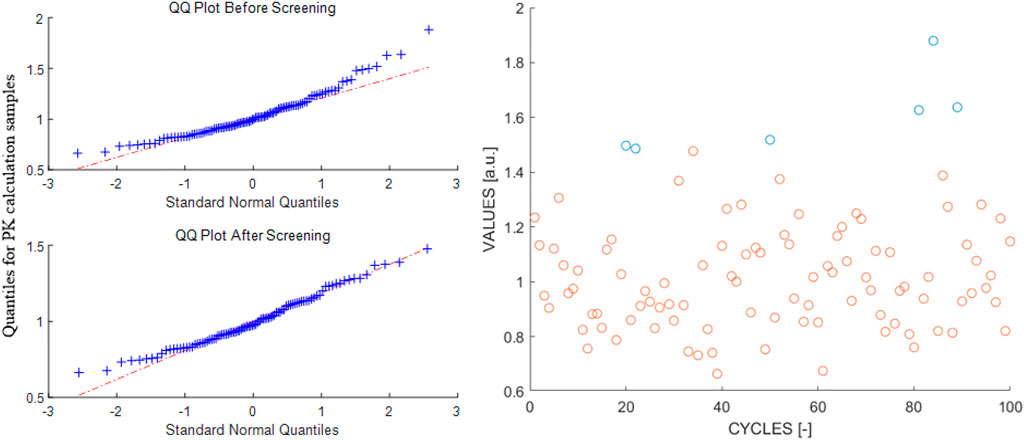
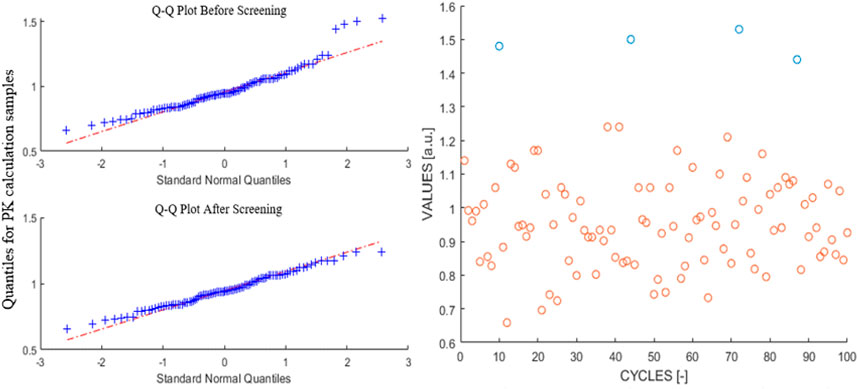
It is the screening process that guarantees the set of samples, i.e., cycle-wise PK corrected power, to follow a normal distribution. Figure 10 illustrates the Q-Q plot and the raw data that have been obtained at a time-step of 0.1 s, where the screened-out data are marked with a blue colour. Identical magnitudes of uncertainties were obtained with different values of significance levels: α = 0.046 (
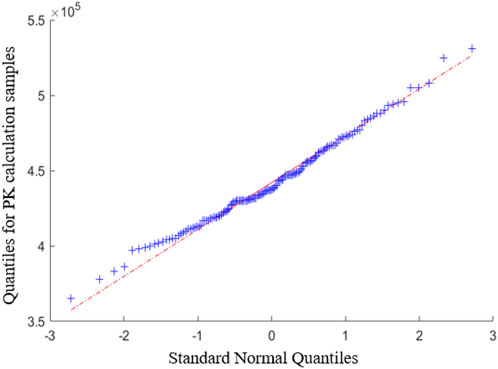
As discussed, the proposed PK sampling scheme postulates near equivalence concerning Eq. 26 for deducing proper uncertainty estimation from a heap of PK-corrected power. Although inherent non-linearity forever exists, it is expected that sampled cycle-wise data will follow a normal distribution when enough number of particles are considered. Such speculation has been partially tested and confirmed using a numerical test that mimics a null-transient, but it is essential for it to be appraised based on a real PCQS-MC calculation. Hence, the same null-transient test for the C5G7-TD benchmark has been performed with an enlarged number of particles, e.g., one-million histories per cycle with 150 active and inactive cycles. It must be articulated that the number of cycles is irrelevant to the normality issue, which only determines the number of sampled cycle-wise corrected power to undergo the screening process. It is the number of histories per cycle that dictates the extent of attaining normality. Figure 11 depicts the Q-Q plot for the raw data, where the cycle-wise corrected power satisfies the Shapiro-Wilk test without any screening process, i.e., a p-value of 0.2132 was obtained. Note that it is mathematically valid to regard the presented data to be sampled from a normal distribution considering such a large p-value.
4.2 C5G7-TD0
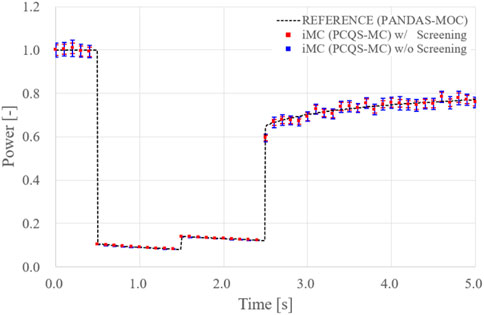
The C5G7-TD0 benchmark transient calculation is induced with a step reactivity insertion, where the control rods abruptly plunge into 10% of the core and reside for one second. Then, the rods are lifted to half of the originally inserted depth, i.e., 5% of the core, and remain for another second. Finally, the control rods are fully withdrawn out of the core. With respect to the number of banks involved, several test cases are considered in the benchmark, where the presented manuscript postulates all the banks to be subjected to movement. The analytic representation of the guide thimble cross-section in time, where the control rods are inserted, is written as
where
Although seemingly no significant difference exists for the two evaluated uncertainties for Figure 12, it is philosophically imperative to include the screening process. As aforementioned, the sampled cycle-wise PK corrected power is subjected to a non-linearity issue, where one cannot guarantee the normality of the sampled data. Whereupon, the calculated sample variance without the screening process not only tends to overestimate the true uncertainty but its appropriateness for representing the uncertainty of the heap of cycle-wise corrected power also becomes vague. Figure 13 depicts the Q-Q plot and the raw data obtained at a time step of 4.0 s, where the screened-out data are marked with a blue colour. Mathematically, it is the data after the screening process that can be regarded as normal, which renders the calculated sample variance to be applicable for representing the uncertainty.
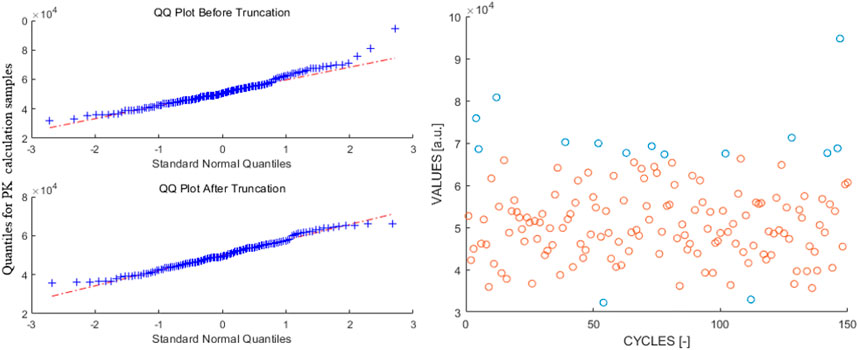
FIGURE 13. Cycle-wise PK corrected power for C5G7-TD0-5 problem at 4.0 s (Left) Q-Q plot and (Right) Scatter plot.
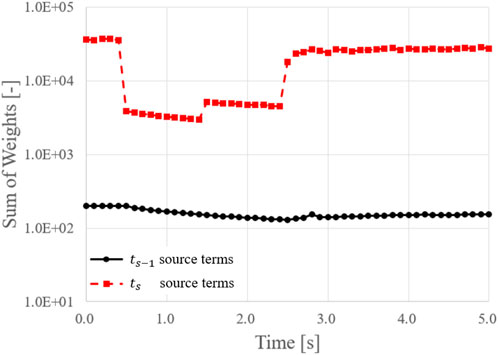
As discussed in Section 2.2, only the neutrons born from ts related source terms should be included whilst tallying the PK parameters for retaining consistency. However, during the actual PCQS-MC calculation implemented in the iMC, all the neutrons are tracked for tallying the PK parameters regardless of its origin. Nevertheless, such difference does not impair the realization of Eq. 23 since predominant contribution originates from the ts related source terms as shown in Figure 14.
Unlike the ts-1 related source terms, which are predetermined from the previous time step, the ts related source terms are updated for every active cycle. Hence, it can be envisaged that the uncertainty stemming from the cycle wisely evaluated ts related source terms determines the uncertainty of tallied PK parameters, which manifests into the overall uncertainty of PCQS-MC calculation. Such an interpretation could explain the noticeable decrease in the PCQS-MC uncertainty exhibited in Figure 12, where the time intervals for reduced uncertainty and the summation of weights concur with each other as shown in Figure 14.
4.3 C5G7-TD1 and 2
Benchmarks TD1 and TD2 postulate continuous (constant) movement of control rods which results in a ramp reactivity insertion. The duration of insertion is set to be one second, and the fractional depth of the rods after 1 s of insertion are 1% and 10% for TD1 and TD2 respectively. The rods are then withdrawn with the same speed, being fully withdrawn after 2 s after the initiation of a transient. The analytic representation analogous to Section 4.2 is given below where w denotes the fractional depth of insertion.
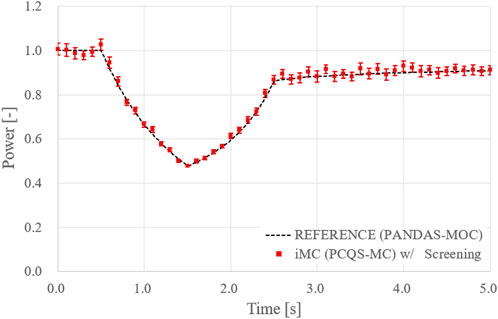
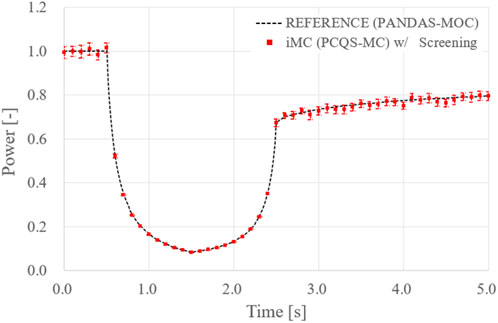
The same calculation conditions for C5G7-TD0 were imposed for TD1 and TD2 simulation and the iMC PCQS-MC result are depicted in Figs. 15 and 16, where only the uncertainty after the screening process is included. Note that PCQS-MC estimated power and MOC-based power reside within the range of uncertainty, i.e., error bar, whilst accommodating the inherent fluctuation of the PCQS-MC method.
5 Conclusion
In this paper, a novel approach for assessing the uncertainty of the Predictor-Corrector Quasi-Static Monte Carlo simulation has been proposed. Unlike the steady-state MC calculation, not only the cycle-wise source correlation but also the stochasticity of the sampled point-kinetics parameters must be accommodated for the proper estimation of PCQS-MC uncertainty. To highlight the importance of reflecting the uncertainty of PK parameters, a null-transient simulation using the critical GODIVA benchmark has been considered.
To overcome the limitation of the conventional cycle-wise uncertainty appraisal scheme for PCQS-MC, a different measure referred to as the PK sampling scheme has been proposed. By solving the PK equation based on the cycle-wise PK parameters, the cycle-wise corrected power can be obtained, in which the PK parameter-associated uncertainty is embedded. However, due to the non-linearity stemming from solving the PK equation, a direct calculation of sample variance from the heap of cycle-wise corrected power could result in an erroneous uncertainty estimation.
Whereupon, a screening process based on the null hypothesis test for normality has been devised. Through proper usage of the significance level and its counterpart
Data availability statement
The raw data supporting the conclusions of this article will be made available by the authors, without undue reservation.
Author contributions
TO, IK, and YK contributed to the conception and design of the study. TO designed the unique statistical analysis scheme, generated the data, and wrote the first draft of the manuscript. IK provided critical thoughts and comments on the unique statistical analysis scheme, YK provided overall guidance for this work. All authors contributed to the manuscript revision, read, and approved the submitted version.
Funding
This work was supported by the National Research Foundation of Korea (NRF) Grants funded by the Korean government (MSIP) (2021M2D2A2076383) and BK21 FOUR (Fostering Outstanding Universities for Research) Project NO. 4120200313637.
Conflict of interest
The authors declare that the research was conducted in the absence of any commercial or financial relationships that could be construed as a potential conflict of interest.
Publisher’s note
All claims expressed in this article are solely those of the authors and do not necessarily represent those of their affiliated organizations, or those of the publisher, the editors and the reviewers. Any product that may be evaluated in this article, or claim that may be made by its manufacturer, is not guaranteed or endorsed by the publisher.
References
Boyarinov, V., Fomichenko, P., Hou, J., Ivanov, K., Aures, A., Zwermann, W., et al. (2016). Deterministic time-dependent neutron transport benchmark without spatial homogenization (C5G7-TD). Paris, France: Nuclear Energy Agency Organisation for Economic Co-operation and Development NEA-OECD.
Faucher, M., Mancusi, D., and Zoia, A. (2018). New kinetic simulation capabilities for Tripoli-4®: Methods and applications. Nucl. Energy 120, 74–88. doi:10.1016/j.anucene.2018.05.030
Guo, X., Shang, X., Song, J., Shi, G., Huang, S., and Wang, K. (2021). Kinetic methods in Monte Carlo code RMC and its implementation to C5G7-TD benchmark. Ann. Nucl. Energy 151, 107864. doi:10.1016/j.anucene.2020.107864
Jo, Y., Cho, B., and Cho, N. Z. (2016). Nuclear reactor transient analysis by continuous-energy Monte Carlo calculation based on predictor-corrector quasi-static method. Nucl. Sci. Eng. 183 (2), 229–246. doi:10.13182/nse15-100
Kim, H., and Kim, Y. (2021). A comparison of time-dependent Monte Carlo frameworks: Predictor-corrector quasi-static method and dynamic simulation. Jeju, Korea: Transactions of the Korean Nuclear Society Virtual Spring Meeting. May 13-14.
Kim, H. T., and Kim, Y. (2022). Uncertainty quantification in predictor-corrector quasi-static Monte Carlo transient simulation. Anaheim, CA: Transactions of the American Nuclear Society. June 12-16.
Kim, H. T. (2022). “Study of steady-state and time-dependent Monte Carlo neutron transport coupled multi-physics reactor analysis in the imc code,”. PhD Thesis (Daejeon, South Korea: Department of Nuclear and Quantum Engineering).
Kim, I., Kim, I., and Kim, Y. (2022). An iDTMC-based Monte Carlo depletion of a 3D SMR with intra-pin flux renormalization. Front. Energy Res. 10, 859622. doi:10.3389/fenrg.2022.859622
Kim, I., and Kim, Y. (2022). An improved deterministic truncation of Monte Carlo solution for pin-resolved nuclear reactor analysis. Ann. Nucl. Energy 166, 108723. doi:10.1016/j.anucene.2021.108723
Leppänen, J., Aufiero, M., Fridman, E., Rachamin, R., and van der Marck, S. (2014). Calculation of effective point kinetics parameters in the Serpent 2 Monte Carlo code. Ann. Nucl. Energy 65, 272–279. doi:10.1016/j.anucene.2013.10.032
Leppänen, J. (2013). “Development of a dynamic simulation mode in Serpent 2 Monte Carlo code,” in Proceedings of the M&C, Sun Valley, Idaho, May 2013.
Mylonakis, A. G., Varvayanni, M., Grigoriadis, D. G. E., and Catsaros, N. (2017). Developing and investigating a pure Monte-Carlo module for transient neutron transport analysis. Ann. Nucl. Energy 104, 103–112. doi:10.1016/j.anucene.2016.12.039
Oh, T., Kim, I., and Kim, Y. (2022). A new approach for evaluating the uncertainty of predictor-corrector quasi-static Monte Carlo transient simulation. Changwon, Korea: Transactions of the Korean Nuclear Society Autumn Meeting.
Ott, K. O., and Neuhold, R. J. (1985). Nuclear reactor dynamics. La Grange Park, Illinois, USA: American Nuclear Society.
Shang, X., Xu, Q., and Wang, K. (2018). Pseudo mesh for adjoint weight flux in predictor corrector quasi static kinetics calculation in Monte Carlo code RMC. Cancun, Mexico: PHYSOR 2018. April 22-26.
Shapiro, S. S., and Wilk, M. B. (1965). An analysis of variance test for normality (complete samples). Biometrika 52 (3-4), 591–611. doi:10.2307/2333709
Shaukat, N., Ryu, M., and Shim, H. J. (2017). Dynamic Monte Carlo transient analysis for the organization for economic Co-operation and development nuclear energy agency (OECD/NEA) C5G7-TD benchmark. Nucl. Eng. Technol. 49 (5), 920–927. doi:10.1016/j.net.2017.04.008
Tao, S., and Xu, Y. (2022). Neutron transport analysis of C5G7-TD benchmark with PANDAS-MOC. Ann. Nucl. Energy 169, 108966. doi:10.1016/j.anucene.2022.108966
Keywords: Monte Carlo, iMC code, predictor-corrector quasi-static method, uncertainty estimation, PK-sampling scheme, screening process
Citation: Oh T, Kim I and Kim Y (2023) A new approach for uncertainty quantification in predictor-corrector quasi-static Monte Carlo transient simulation. Front. Energy Res. 11:1089340. doi: 10.3389/fenrg.2023.1089340
Received: 04 November 2022; Accepted: 04 January 2023;
Published: 19 January 2023.
Edited by:
Zhouyu Liu, Xi’an Jiaotong University, ChinaReviewed by:
Zhouyu Liu, Xi’an Jiaotong University, ChinaChen Hao, Harbin Engineering University, China
Chao Yang, University of South China, China
Copyright © 2023 Oh, Kim and Kim. This is an open-access article distributed under the terms of the Creative Commons Attribution License (CC BY). The use, distribution or reproduction in other forums is permitted, provided the original author(s) and the copyright owner(s) are credited and that the original publication in this journal is cited, in accordance with accepted academic practice. No use, distribution or reproduction is permitted which does not comply with these terms.
*Correspondence: Yonghee Kim, eW9uZ2hlZWtpbUBrYWlzdC5hYy5rcg==
 Taesuk Oh
 Inyup Kim